News

Consumer inflation exceeds estimates again in US

11 September 2020

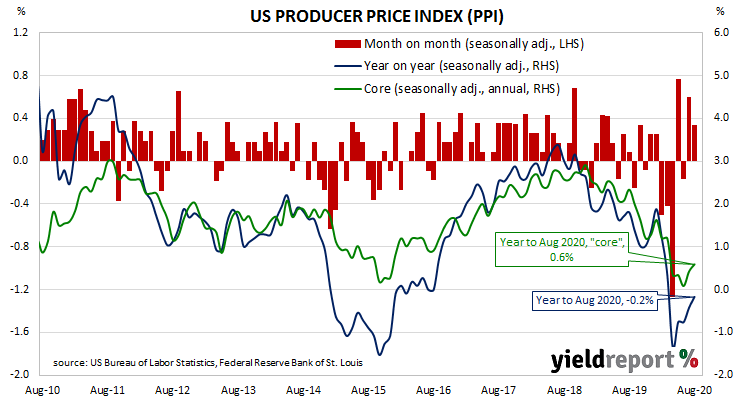
Summary:  August CPI increase double expected figure; headline and core figures rise by same amounts; “broad based”, some stability returning to formerly volatile categories; prices of used cars and trucks, fuel up.


The annual rate of US inflation as measured by changes in the consumer price index (CPI) halved from nearly 3% in the period from July 2018 to February 2019. It then fluctuated in a range from 1.5% to 2.0% through 2019 before rising above 2.0% in the final months of that year. “Headline” inflation is known to be volatile and so references are often made to “core” inflation for analytical purposes. Substantially lower rates for both measures were reported from March to May but recent reports indicate consumer inflation has been rekindled.

The latest CPI figures released by the Bureau of Labor Statistics indicated seasonally-adjusted consumer prices increased by 0.4% on average in August. The rise was double the expected figure of 0.2% but less than July’s 0.6% increase. On a 12-month basis, the inflation rate accelerated from July’s rate of 1.0% to 1.3%.

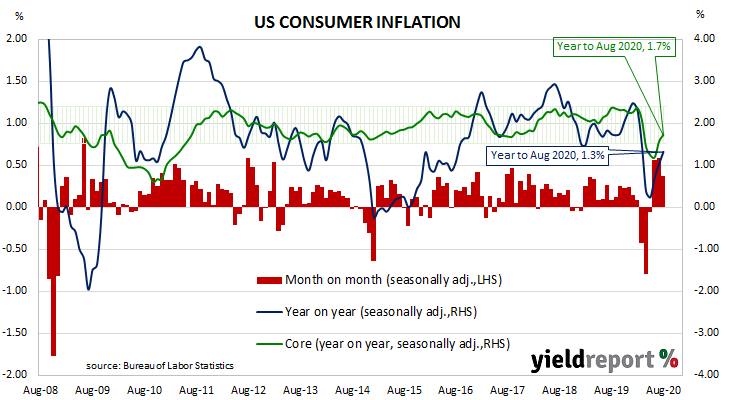
Core inflation, a measure of inflation which strips out the volatile food and energy components of the index, also increased on a seasonally-adjusted basis by 0.4% for the month. The increase was more than the 0.2% rise which had been expected but lower than July’s comparable figure of 0.6%. The seasonally adjusted annual rate ticked up from 1.6% to 1.7%.

“The monthly rise was broad based, with signs that recent gyrations in certain categories are stabilising,” said ANZ economist Hayden Dimes.

Higher prices for services drive US PPI up

10 September 2020

Summary: Prices received by producers increase by 0.3% on average; rise slightly higher than expected; annual “core” PPI continues moves away from zero; long-term US bond yields decline on day; PPI rise predominantly driven by higher services prices.


Around the end of 2018, the annual inflation rate of the US producer price index (PPI) began a downtrend which then continued through 2019. Months in which prices received by producers increased suggested the trend may have been coming to an end, only for it to continue, culminating in a plunge in April. Figures from subsequent months suggest a return to “normal”.

The latest figures published by the Bureau of Labor Statistics indicate producer prices rose by 0.3% after seasonal adjustments in August. The increase was above the 0.2% rise which had been generally expected but also half July’s 0.6% rise. On a 12-month basis, the rate of producer price inflation after seasonal adjustments increased to -0.2%, up from the -0.4% annual rate recorded in July.

PPI inflation excluding foods and energy rose by 0.4% after recording increases of 0.5% in July and declines of 0.3% in June. The annual rate increased from 0.4% to 0.6%.

Longer-term US Treasury bond yields finished lower. By the end of the day, the 10-year yield had lost 2bps to 0.68% and the 30-year yield had shed 4bps to 1.42%. The 2-year yield finished 1bp higher at 0.14%.

The BLS stated higher prices for final demand services were the main drivers of the month’s increase after they rose by 0.5% on average. Prices of goods increased by just 0.1% on average.

The producer price index (PPI) is a measure of prices received by producers for domestically produced goods, services and construction. It is put together in a fashion similar to the consumer price index (CPI) except it measures prices received from the producer’s perspective rather than from the perspective of a retailer or a consumer. It is another one of the various measures of inflation tracked by the US Fed, along with core personal consumption expenditure (PCE) price data.

US quits, separations, openings all up in July

09 September 2020

Summary: US quit rate increases for third consecutive month; job openings also up; total separations up; retail trade sector significant in each categories; report consistent with improvement in other labour market indicators.


The number of US employees who quit their jobs as a percentage of total employment increased slowly but steadily after the GFC. It peaked in March 2019 and then tracked sideways until virus containment measures were introduced in March 2020. Quit rates plummeted as alternative employment opportunities rapidly dried up. However, a rapid recovery seems to have taken place.

Figures released as part of the most recent JOLTS report show the quit rate continued to stage a recovery. 2.1% of the non-farm workforce left their jobs voluntarily in July, a rise from June’s comparable figure of 1.9%. The largest source of additional quits arose from the “Retail trade” and “Professional and business services” sectors while the three sectors which experienced fewer quits did so only in small amounts. Overall, the total number of quits for the month increased from June’s figure of 2.605 million to 2.949 million in July.

April’s non-farm payroll report indicated average hourly pay had spiked, possibly the result of fewer lower-paid jobs relative to higher paying ones. Subsequent months’ figures then saw falls in average hourly pay, with a corresponding fall in the annual growth rate from 8.0% in April to 4.7% in August.

Total vacancies at the end of July increased by 617,000, or 10.3%, from June’s revised figure of 6.001 million to 6.618 million, driven by large increases in the “Retail trade” and, to a lesser extent, the “Health care and social assistance” sectors. Reduced openings in the “Accommodation and food services” and “Arts, entertainment and recreation” sectors provided the only non-trivial drags. Overall, 13 out of 18 sectors experienced more job openings than in the previous month.

Total separations during the same period increased by 108,000 from June’s revised figure of 4.899 million to 5.007 million. The change was led by the “Retail trade” sector, where there were 112,000 more separations than in June. Separations decreased in 8 of 18 sectors, with the “Retail trade” and “Professional and business services” sectors experiencing the two largest falls.

“Overall, the report is consistent with the improvement seen in other labour market indicators,” said Westpac senior economist Elliot Clarke.

“Weakness in other states” blots September sentiment report

09 September 2020

Summary: Household sentiment bounces significantly, continuing recent erratic path; confidence index back to pre-pandemic level; weakness in other states due to virus clusters and possible “second wave”; survey carried out prior to Victorian announcement of slow reopening; Vic disappointment may be offset by containment success.


After a lengthy divergence between measures of consumer sentiment and business confidence in Australia which began in 2014, confidence readings of the two sectors converged again around July 2018. Both readings then deteriorated gradually in trend terms, with consumer confidence leading the way. Household sentiment fell off a cliff in April and then went through a series of partial recoveries which were followed by bouts of pessimism.

According to the latest Westpac-Melbourne Institute survey conducted in the first week of September, household sentiment has bounced back, continuing an erratic path. The Consumer Sentiment Index jumped from 79.5 to 93.8, taking it back to the levels recorded prior to the introduction of pandemic restrictions.

“We suspected last month’s 9.5% collapse in the Index was an over-reaction but this month’s 18% rebound is a pleasant surprise nonetheless,” said Westpac chief economist Bill Evans. “The rebound means the Index is now just 1.6% below the average over the six months prior to the emergence of COVID-19 in March.”

Local Treasury bond yields fell, especially at the long end, largely following US Treasury movements in overnight trading. By the end of the day, the 3-year ACGB yield had shed 2bps to 0.29%, the 10-year yield had lost 7bps to 0.91% while the 20-year yield finished 8bps lower at 1.49%.

In the cash futures market, expectations of a change in the actual cash rate remained fairly stable. By the end of the day, contracts implied the cash rate would remain in a range of 0.11% to 0.12% through to the latter part of 2021.

Any reading below 100 indicates the number of consumers who are pessimistic is greater than the number of consumers who are optimistic. The latest figure has returned to the low end of the normal range, below the long-term average reading of just over 101.

Home loan approvals stage comeback; refinancing presents “major implications”

09 September 2020

Summary: Home loan approvals rise in number and value in July; “broadly based” but Victoria the exception; reflected improved economic conditions, access to housing inspections; owner-occupier loan commitments surge but “not start of trend”; “a last hurrah” before Victorian lockdown; investor commitments up modestly; “massive wave” of refinancing activity.


A very clear downtrend was evident in the monthly figures of both the number and value of home loan commitments through late-2017 to mid-2019. Then the RBA reduced its cash rate target in a series of cuts and both the number and value of mortgage approvals began to noticeably increase. Figures from February through to May provided an indication the trend had finished but the last two sets of figures have contradicted that idea.

July’s housing finance figures have now been released and the total number of loan commitments (excluding refinancing loans) to owner-occupiers increased by 9.7%. The gain came after a 7.7% rise in June after revisions and, on an annual basis, the rate of growth increased from June’s revised figure of -0.6% to +7.8%.

“As with June, the July lift was broadly based but with some notable exceptions in Victoria, which continues to underperform, and around refinance activity, which has been unaffected by market disruptions and has been responding more to interest rate changes,” said Westpac senior economist Matthew Hassan.

Local Treasury bond yields fell, especially at the long end, largely following US Treasury movements in overnight trading. By the end of the day, the 3-year ACGB yield had shed 2bps to 0.29%, the 10-year yield had lost 7bps to 0.91% while the 20-year yield finished 8bps lower at 1.49%.

In the cash futures market, expectations of a change in the actual cash rate remained fairly stable. By the end of the day, contracts implied the cash rate would remain in a range of 0.11% to 0.12% through to the latter part of 2021.

ANZ economist Adelaide Timbrell said the solid result “built on the strength of June and reflected improved economic conditions and access to housing inspections in the previous months since lending occurs at settlement.”

In dollar terms, total loan approvals excluding refinancing increased by 8.9% over the month. The rise was greater than the 2.0% which had been generally expected and it built on June’s 6.4% increase after revisions. On a year-on-year basis, total approvals excluding refinancing increased by 11.8%, an acceleration from the previous month’s comparable figure of +4.7%.

Business conditions worsen; non-Vic states dragged down

08 September 2020

Summary: Business conditions worsen; business confidence improve; numbers “largely as expected”; capacity usage reverses course after rising for 3 months; conditions deteriorate more in Queensland, South Australia and Tasmania than in Victoria.


NAB’s business survey indicated Australian business conditions were robust in the first half of 2018, with a cyclical-peak reached in April of that year. Readings from NAB’s indices then began to slip, declining to below-average levels by the end of 2018. Forecasts of a slowdown in the domestic economy began to emerge in the first half of 2019 and the indices trended lower, hitting a nadir in April 2020. Conditions then improved as pandemic containment measures were relaxed.

According to NAB’s latest monthly business survey of over 400 firms conducted in the last two weeks of August, business conditions deteriorated after three months of improving. NAB’s conditions index registered -6, down from July’s reading of 0.

In contrast, business confidence improved. NAB’s confidence index rose from July’s reading of -14 to -8. Typically, NAB’s confidence index leads the conditions index by approximately one month, although some divergences appear from time to time.

“The impact of the Melbourne stage 4 restrictions on activity is evident in Victoria with a decline in conditions, though not as bad as feared,” said NAB chief economist Alan Oster. Westpac senior economist Andrew Hanlan said the figures were “largely as expected”.

NAB’s report came out on the same day as the latest ABS Weekly payroll figures and Commonwealth bond yields remained almost completely stable in the absence of a lead from the US Treasury bond market. By the end of the day, 3-year and 10-year ACGB yields remained steady at 0.31% and 0.91% while the 20-year yield finished 1bp higher at 1.57%.

In the cash futures market, expectations of a change in the actual cash rate, currently at 0.13%, continued to remain low. By the end of the day, contracts implied the cash rate would remain in a range of 0.115% to 0.120% through to the end of 2021.

Job ads rebound stalls in August

07 September 2020

Summary:  Job ads increase modestly in August; previous months’ rebound “did not continue into August”; Victoria a problem but New South Wales “sluggish”; ANZ expects employment to fall in August, September.


From mid-2017 onwards, year-on-year growth rates in the total number of Australian job advertisements consistently exceeded 10%. That was until mid-2018 when the annual growth rate fell back markedly. 2019 was notable for its reduced employment advertising and this trend continued into the first quarter of 2020. Figures plunged in April as pandemic restrictions took effect; subsequent reports’ numbers indicated a partial recovery has taken place.

According to the latest ANZ figures, total advertisements increased by 1.6% in August on a seasonally-adjusted basis. The rise followed a 19.1% rise in July and a 41.0% bounce in June after revisions. On a 12-month basis, total job advertisements were 30.0% lower than in August of last year, up from July’s comparable figure of -33.8%.

ANZ senior economist Catherine Birch said, “The solid rebound in ANZ Job Ads in June and July, which saw more than half the pandemic losses recovered, did not continue into August…”

Longer-term Commonwealth bond yields moved higher, largely following US Treasury movements on Friday trading. By the end of the day, the 10-year ACGB yield had increased by 7bps to 0.98% while the 20-year yield finished 10bps higher at 1.56%. The 3-year yield ticked up 1bp to 0.31%.

Birch noted the influence of Victorian restrictions on a quarter of the nation’s employed, saying the regulations “have undoubtedly put the brakes on.” Perhaps more concerning was the data from New South Wales. There, growth in job advertising “has been sluggish compared with other parts of the country.”

“Decidedly solid” US August jobs report

04 September 2020

Summary: August non-farm payrolls increase by over 1 million; jobless rate down considerably even as participation rate increases; government jobs rise but private sector accounts for bulk of gain; employment-to-population ratio up for fourth consecutive month; underemployment rate down again but still in mid-teens.


The US economy ceased producing jobs in net terms as infection controls began to be implemented in March. The unemployment rate had been around 3.5% but that changed as job losses began to surge through March and April. May’s non-farm employment report represented a turning point as the US economy began to re-open. Subsequent months have continued to provide substantial employment gains.

According to the US Bureau of Labor Statistics, the US economy created an additional 1.371 million jobs in the non-farm sector in August. The increase was below the 1.5 million which had been generally expected and less than the 1.734 million jobs which had been added in July after revisions. Employment figures for June and July were revised down by a total of 39,000.

The unemployment rate dropped from July’s rate of 10.2% to 8.4%. The total number of unemployed decreased by 2.788 million to 13.550 million while the total number of people who are either employed or looking for work increased by 968,000 to 160.838 million. The rise in the number of people in the labour force raised the participation rate from July’s rate of 61.4% to 61.7%.

“Although some 230,000 of the public sector payrolls were temporary census workers, the 1 million-plus rise in private payrolls was decidedly solid,” said Westpac senior economist Elliot Clarke.


Long-term US Treasury yields shot up on the day. By the close of business, the US Treasury 2-year bond yield had crept up 1bp to 0.14%, the 10-year yield had gained 8bps to 0.72% while the 30-year yield finished 11bps higher at 1.47%.

In terms of US Fed policy, expectations of any change in the federal funds rate over the next 12 months retained a slight easing bias. OIS contracts for September implied an effective federal funds rate of 0.075%, about 1.5bps below the current spot rate.

July retail data extend “Impressive rebound”

04 September 2020

Summary: Retail sales grow significantly in July; sales extend rebound from April shock; spending in all categories, especially on household goods, rises; economists expect retail growth to “soften going forward”; online sales growing strongly.


Growth figures of domestic retail sales have been declining since 2014 and they reached a low-point in September 2017 when they registered an annual growth rate of just 1.5%. They then began increasing for about a year, only to stabilise at around 3.0% to 3.5% through late 2018. A downtrend took place through 2019 and early 2020, culminating in a plunge in April as pandemic restrictions took hold. A recovery has since taken place, primarily in non-Victorian states.

According to the latest ABS figures, total retail sales increased by 3.2% in July on a seasonally-adjusted basis. The fall was basically in line with the 3.3% increase which had been expected after “flash” figures were released on 20 May and larger than June’s comparable figure of 2.7%. On an annual basis, retail sales increased by 12.0%, up from June’s comparable figure of 8.5%.

“The July retail report confirmed preliminary estimates showing sales extending on their impressive rebound from April’s COVID shock,” said Westpac senior economist Matthew Hassan. He noted “Victoria was a notable exception…”

Longer-term Commonwealth bond yields moved modestly lower, largely in line with US Treasury bond movements. By the end of the day, the 3-year ACGB yield remained unchanged at 0.30%, the 10-year yield had slipped 1bp to 0.91% while the 20-year yield finished 3bps lower at 1.46%.

In the cash futures market, expectations of any material change in the actual cash rate, currently at 0.13%, continued to remain low. By the end of the day, contracts implied the cash rate would remain in a range of 0.110% to 0.115% through to the end of 2021.

“Retail will continue to outperform most other types of household spending, but we expect to see growth soften going forward,” said ANZ economist Adelaide Timbrell.

ADP numbers suggest “downside risk” to non-farm payrolls report

02 September 2020

Summary: ADP payroll numbers up in August; again, much less than expected; July numbers revised up moderately; size of gain suggests “downside risk” to upcoming non-farm payrolls (NFP) report; figures up across firms of all sizes; services sector accounts for 90% of gains; report cited as “not accurate reflection” of NFP for past few months.


The ADP National Employment Report is a monthly report which provides an estimate of US non-farm employment in the private sector. Since the report began to be published in 2006, its employment figures have exhibited a high correlation with official non-farm payroll figures, although a large difference can arise in any individual month.

The ADP August report indicated private sector employment increased by 0.428 million, far less than the 0.9 million which had been generally expected. July’s increase was revised from 167,000 to 212,000.

NAB Head of FX Strategy within its FICC division Ray Attrill said the report suggests “downside risk to Friday’s non-farm payrolls…”

Short-term US Treasury yields rose a little while longer-term yields fell. By the close of business, the 2-year Treasury bond yield had gained 2bps to 0.14%, the 10-year yield had shed 3bps to 0.65% and the 30-year yield finished 4bps lower at 1.38%.

In terms of US Fed policy, expectations of any change in the federal funds rate over the next 12 months retained a slight easing bias. OIS contracts for September implied an effective federal funds rate of 0.073%, about 2bps below the current spot rate.

Employment numbers in net terms were up across a range of differently sized businesses, especially larger ones. Firms with less than 50 employees filled a net 52,000 positions, mid-sized firms (50-499 employees) gained 79,000 positions while large businesses (500 or more employees) accounted for 289,000 additional employees.

Click for more news