News

Manufacturing continues recovery in US

01 September 2020

Summary: ISM purchasing managers index moves further above 50; reading above consensus expectation; manufacturing continues recovery; employment sub-index still shows “factories are cutting jobs”; US economy growing at fast pace.


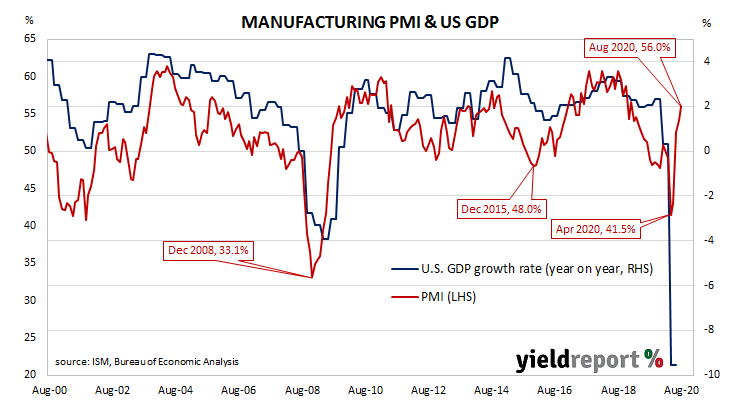
US purchasing managers’ indices (PMIs) reached a cyclical peak in September 2017 before they started a downtrend which stabilised in late 2019 after a truce of sorts was made with the Chinese regarding trade. March’s report signalled a contraction in US manufacturing activity had begun; it stayed in this state until June.

According to the latest Institute of Supply Management (ISM) survey, its Purchasing Managers Index recorded a reading of 56.0% in August. The result was above the expected figure of 54.4% and higher than July’s final reading of 54.2%. The average reading since 1948 is 52.9% and any reading above 50% implies an expansion in the manufacturing sector. A reading “above 42.8%, over a period of time, generally indicates an expansion of the overall economy,” according to the ISM.

“The data confirmed manufacturing has been able to continue its recovery despite the summer surge in COVID-19 infections,” said ANZ analyst Rahul Khare.

Long-term US Treasury yields fell on the day. By the close of business, the 10-year Treasury bond yield had shed 3bps to 0.68% and the 30-year yield had dropped 6bps to 1.42%. The 2-year remained unchanged at 0.12%.

In terms of US Fed policy, expectations of any change in the federal funds rate over the next 12 months retained a slight easing bias. OIS contracts for September implied an effective federal funds rate of 0.074%, about 2bps below the current spot rate.

NAB currency strategist Rodrigo Catril noted the employment sub-index, at 46.4%, “continued to show factories are cutting jobs. So the rebound from very depressed levels continues, but unfortunately we are not yet seeing an improvement strong enough to add new jobs to the US manufacturing sector.”

Purchasing Managers’ Indices (PMIs) are economic indicators derived from monthly surveys of executives in private-sector companies. They are diffusion indices, which means a reading of 50% represents no change from the previous period, while a reading under 50% implies respondents reported a deterioration on average. They are particularly useful as a leading indicator.

Home approvals bounce likely short-lived

01 September 2020

Summary: Home approval numbers jump; rise much higher than expected; house and apartment approvals both rise substantially; economists do not expect approvals to keep rising; non-residential approvals resume falling.


Approvals for dwellings, that is apartments and houses, had been heading south since mid-2018. As an indicator of investor confidence, falling approvals had presented a worrying signal, not just for the building sector but for the overall economy. However, approval figures from late-2019 and the early months of 2020 painted a picture of a recovery taking place, even as late as April. Recent months’ figures have been volatile.

The Australian Bureau of Statistics has released the latest figures from July and total residential approvals rose by 12.0% on a seasonally-adjusted basis. The rise over the month was in contrast to 1% decline which had been generally expected and June’s revised 4.2% decline. Total approvals increased by 6.3% on an annual basis, a marked turnaround from June’s comparable figure of -14.8% after it was revised up from -15.8%.

“Dwelling approvals came in well above expectations, surging 12% in July, exceeding our top of the range forecast of a 3% gain. Gains were both stronger and more broadly based than we had expected,” said Westpac senior economist Matthew Hassan.

Commonwealth bond yields slipped a little. By the end of the day, 3-year, 10-year and 20-year Treasury yields had all slipped 1bp to 0.31%, 0.99% and 1.57% respectively.

In the cash futures market, expectations of a change in the actual cash rate, currently at 0.13%, continued to remain low. By the end of the day, contracts implied the cash rate would remain in a range of 0.115% to 0.125% through to the end of 2021.

Economists do not expect approvals to keep rising. “The weak labour market and very low population growth outlook are likely to keep building approvals trending down, particularly in Victoria where the second wave of COVID-19 and related lockdowns are likely to slow the economic recovery. In particular, the impacts of rising unemployment on the rental market will reduce investor demand. Homebuilder is likely to keep house approvals more resilient than unit approvals this year,” said ANZ economist Adelaide Timbrell.

Inflation index inches up in August

31 August 2020

Summary: Melbourne Institute inflation index inches up in August; third consecutive month of rises following plunge in May; annual rate maintained above 1%.


Despite the RBA’s desire for a higher inflation rate, ostensibly to combat recessions, attempts to accelerate inflation through record-low interest rates have failed to date. The RBA’s stated objective is to achieve an inflation rate of between 2% and 3%, “on average, over time.” Since the GFC, Australia’s inflation rate has been trending lower and lower; then the “coronavirus recession” crushed it.

The Melbourne Institute’s latest Inflation Gauge index inched up by 0.1% through August. The increase follows a 0.9% jump in July and a 0.6% rise in June. On an annual basis, the index increased by 1.3%, the same rate as in July.

Long-term Commonwealth bond yields moved lower, following US 10-year Treasury yields in overnight trading. By the end of the day, 10-year and 20-year ACGB yields both finished 4bps lower at 1.00% and 1.58% respectively. The 3-year yield remained unchanged at 0.32%, 7bps above the RBA’s target.

The Melbourne Institute’s Inflation Gauge is an attempt to replicate the ABS consumer price index (CPI) on a monthly basis. It has turned out to be a reliable leading indicator of the CPI, although there are periods in which the Inflation Gauge and the CPI have diverged for as long as twelve months. On average, the Inflation Gauge’s annual rate tends to overestimate the ABS headline rate by an average of a little under 0.1%.

Central bankers desire a certain level of inflation which is “sufficiently low that it does not materially distort economic decisions in the community” but high enough so it does not constrain “a central bank’s ability to combat recessions.” Hence the obsession among central bankers to increase inflation.

“Weakest results since GFC”; private credit falls again

31 August 2020

Summary: Private sector credit contracts for third consecutive month in July; result primarily driven by investor and business lending; owner-occupier loans grow steadily; weak demand rather than cost of credit; business loan growth “to remain weak”; weakest results for private sector credit “since GFC”.


The pace of lending to the non-bank private sector by financial institutions in Australia has been trending down since October 2015. Private sector credit growth appeared to have stabilised in the September quarter of 2018 but the annual growth rate then continued to deteriorate through to the end of 2019. The early months of 2020 provided some positive signs; these disappeared in April.

According to the latest RBA figures, private sector credit contracted by 0.1% in July, its third consecutive month of contraction. The result was in line with expectations but more than June’s -0.2%. The annual growth rate slowed to 2.4% from June’s comparable rate of 2.8% after revisions.

“We believe it’s the weak demand for credit rather than the cost of credit that’s holding back overall credit growth,” said Citi Research economist Josh Williamson.

The result was largely driven by a large fall in investor loans, with business loans and personal debt also contracting. Owner-occupier loans continued to grow steadily.Long-term Commonwealth bond yields moved lower, following US 10-year Treasury yields in overnight trading. By the end of the day, 10-year and 20-year ACGB yields both finished 4bps lower at 1.00% and 1.58% respectively. The 3-year yield remained unchanged at 0.32%, 7bps above the RBA’s target.

In the cash futures market, expectations of a change in the actual cash rate, currently at 0.13%, continued to remain low. At the end of the day, contract prices implied the cash rate would remain in a range of 0.115% to 0.120% through to the end of 2021.

The traditional driver of loan growth rates, the owner-occupier segment, grew by 0.4% over the month, the same rate as in June after it was revised up from 0.3%. The sector’s 12-month growth rate remained at 5.4%.

US PCE price deflator up for third month

28 August 2020

Summary: US Fed’s favoured inflation measure rises 0.3%; below market expectations; previous month revised up; annual rate increases for third consecutive month; Treasury bond yields mixed.


One of the US Fed’s favoured measures of inflation is the change in the core personal consumption expenditures (PCE) price index. After hitting the Fed’s target at 2.0% in mid-2018, the annual rate then hovered in a range between 1.8% and 2.0% before it eased back to a range between 1.5% and 1.8% through 2019. It then plummeted below 1.0% in April 2020.

The latest figures have now been published by the Bureau of Economic Analysis as part of the July personal income and expenditures report. Core PCE prices increased by 0.3% for the month, below the 0.5% which had been expected but in line with June’s increase after it was revised up from 0.2%. On a 12-month basis, the core PCE inflation rate accelerated for a third consecutive month, from 1.1% in June after revisions to 1.3%.

Longer-term US Treasury yields finished lower while yields at the front of the curve moved a touch higher. By the end of the day, the 10-year yield had lost 4bps to 0.72% while the 30-year yield finished 1bp lower at 1.50%. The 2-year yield ticked up 1bp to 0.16%.

In terms of US Fed policy, expectations of any change in the federal funds rate over the next 12 months retained a slight easing bias. OIS contracts for September implied an effective federal funds rate of 0.072%, about 1bp below the current spot rate.

The core version of PCE strips out energy and food components, which are volatile from month to month, in an attempt to identify the prevailing trend. It’s not the only measure of inflation used by the Fed; it also tracks the Consumer Price Index (CPI) and the Producer Price Index (PPI) from the Department of Labor. However, it is the one measure which is most often referred to in FOMC minutes.

June quarter capex beats estimates; sharp contraction expected in 2021 FY

27 August 2020

Summary: Private capital expenditures down but better than expected; fall larger than in March quarter; points to sharp contraction in 2021/21; mining hold up, other sectors suffer larger drops; 2020/21 capex estimates noticeably lower than comparable estimates from 2019/20.


Australia’s capital expenditure (capex) slump was thought to be coming to an end as investment in the mining sector reverted back to its long-term mean after a spike early in the decade. Total investment had begun to grow again, driven by investment in the services sector. However, contractions in recent quarters have become the norm.

According to the latest ABS figures, seasonally-adjusted private sector capex in the June quarter fell by 5.9%. This latest figure was above the 7.9% contraction which had been expected but less than the March quarter’s revised figure of -2.1%. On a year-on-year basis, total capex contracted by 11.9% after recording an annual rate of -6.3% in the previous quarter after revisions.

“This latest update on capex plans point to a sharp contraction in business investment in 2020/21, as is to be expected in the current environment,” said Westpac senior economist Andrew Hanlan.

Long-term Commonwealth Government bond yields fell moderately. By the end of the Australian trading day, the 10-year Treasury bond yield had lost 3bps to 0.94% and the 20-year yield had shed 2bps to 1.50%. The 3-year yield remained unchanged at 0.31%.

In the cash futures market, expectations of any change in the actual cash rate, currently at 0.13%, continued to remain low. By the end of the day, contracts implied the cash rate would remain in a range from 0.115% to 0.12% through to the end of 2021.

Construction spending holds up; June GDP forecasts to rise

26 August 2020

Summary: Construction spending contracts but at much less than expected; March quarter revised up; residential, non-residential building down; engineering up, possibly stronger mining investment; June quarter GDP growth forecasts likely to be less negative than previously thought.


Construction expenditure increased substantially in Australia in the early part of last decade following a more-steady expansion through the 2000s. A large portion of the increase came from the commissioning of new projects and the expansion of existing ones to exploit a tripling in price of Australia’s mining exports in the previous decade. The return to “normal” investment levels is still continuing.

According to the latest construction figures published by the ABS, total construction in the June quarter fell by 0.7%. The decline was considerably smaller than the 7% contraction which had been expected but it was a reversal of the March quarter’s 0.7% increase after it was revised up from -1.0%. On an annual basis, the growth rate improved from March’s revised figure of -4.4% to -2.2%.

“Recall that the construction sector was classified as essential, limiting the disruption to work during the April lock-down,” said Westpac senior economist Andrew Hanlan.

Commonwealth Government bond yields finished the day noticeably higher, outpacing higher US Treasury yields in overnight trading. By the end of the day, the 3-year ACGB yields had inched up 1bp to 0.31% while 10-year and 20-year yields each finished 6bps higher at 0.97% and 1.52% respectively.

In the cash futures market, expectations of any change in the actual cash rate, currently at 0.13%, continued to remain low. By the end of the day, contracts implied the cash rate would remain in at 0.12% through to the end of 2021.

Residential building construction contracted by 5.5%, a deterioration from the previous quarter’s flat result. On an annual basis, expenditure in this segment was 12.1% lower than the June 2019 quarter, less than the March quarter’s comparable figure of -10.2% after revisions.

Payrolls, wages fall; “second-round impacts” kick in

25 August 2020

Summary: Payrolls and wages both fall in fortnight to 8 August; “weakest since early June”; payrolls and wages both down by around 5%, 6% respectively since start of restrictions; “second-round impacts” affecting non-Victorian states; timing of stage 4 restrictions in Melbourne “suggests further falls in payrolls are likely”.


The ABS has released its latest payroll report containing new statistics on jobs and wages based on Single Touch Payroll data provided by the ATO. Job losses do not directly translate into additional unemployment; some people hold more than one job and the report’s figures are not seasonally adjusted.

Payroll numbers continued to ease in the last week of July and the first week of August. Total payrolls for the fortnight to 8 August fell by 0.8%, adding to the 0.3% fall in the previous fortnight.

“Although the most recent historical payroll jobs data were revised upwards, jobs are now down 4.9% since the week ending 14 March. This is the weakest they’ve been since early June,” said ANZ senior economist Catherine Birch.

The picture for wages also appears a little grim. Total wages for the fortnight to 8 August fell by 0.6%, adding to the 1.3% drop in the previous two weeks. Between the week ending 14 March 2020 and the week ending 8 August 2020, the total number of Australian jobs contracted by 4.8%. Total wages fell by 6.2% over the same 21 week period.

13 out of the 19 sectors experienced losses in the week to 8 August, with the “Administrative and support services”, “Health care and social assistance” and Professional, scientific and technical services” segments providing the largest source of losses on the overall total. Payrolls declined in these sectors by 1.8%, 0.6% and 1.1% respectively over the week. The “Education and training” segment accounts for just over 8% of total payrolls and its 1.4% increase had a sizable offsetting effect.

US consumer confidence “back to pandemic lows”

25 August 2020

Summary: US consumer confidence deteriorates for second consecutive month; view of present and future conditions worsen; consumers’ spending likely to cool; “back to pandemic lows”.


US consumer confidence collapsed in late 2007 as the US housing bubble burst and the US economy went into recession. By 2016, it had clawed its way back to neutral and then went from strength to strength until late 2018. Measures of consumer confidence then oscillated within a fairly narrow band at historically high levels until they collapsed earlier this year.

The latest Conference Board survey held during the first half of August indicated US consumer confidence has retreated for a second consecutive month after staging a modest recovery through May and June. August’s Consumer Confidence Index registered 84.8, below the median consensus figure of 93.0 and considerably lower than July’s final figure of 91.7. Consumers’ views of present conditions and of future conditions both deteriorated from those held at the time of the July survey.

“Consumer spending has rebounded in recent months but increasing concerns amongst consumers about the economic outlook and their financial well-being will likely cause spending to cool in the months ahead,” said Lynn Franco, a senior director at The Conference Board.

Longer-term US Treasury bond yields increased moderately. By the end of the day, the 10-year Treasury bond yield had gained 3bps to 0.69% and the 20-year yield had increased by 4bps to 1.40%. The 2-year yield finished unchanged at 0.15%.

In terms of US Fed policy, expectations of any change in the federal funds rate over the next 12 months retained a slight easing bias. OIS contracts for September implied an effective federal funds rate of 0.073%, about 2bps below the current spot rate.

NAB Head of FX Strategy within its FICC division Ray Attrill described the report as “on the surface, a disappointing read.” He noted the index “has tended to follow the labour market over time, offering a partial explanation. This reading puts consumer confidence back to pandemic lows.”

ifo index up again; economists express doubts

25 August 2020

Summary: ifo business climate index increases for fourth consecutive month; in line with expectations; German economy on road to recovery”; German, French bond yields rise noticeably; economists express some doubts about recovery’s sustainability.


Following a recession in 2009/2010, ifo Institute’s business climate index largely ignored the European debt-crisis of 2010-2012, remaining at average-to-elevated levels through to early-2020. However, the index was quick to react in the March survey, falling precipitously. A rebound began in May.

According to the latest figures released by the Institute, its business climate index increased for a fourth consecutive month to 92.6 in August. The reading was broadly in line with the expected reading of 92.2 and 2.2 points above July’s final reading of 90.4. The average reading since January 2005 is just above 97.

Its expectations index similarly increased, registering a result comparable with those from late-2018. It increased from July’s final figure of 96.7 to 97.5 in August, a little below the expected figure of 98.0. The current situation index rose from 84.5 to 87.9.

A month ago, Clemens Fuest, the president of the ifo Institute had described the German economy as “recovering step by step.” In this latest report, he reinforced this view, stating, “The German economy is on the road to recovery.”

German and French 10-year bond yields increased noticeably. By the close of business, the German 10-year bund yield had gained 5bps to -0.44% and the French OAT yield had jumped by 7bps to -0.13%.

ANZ senior economist Catherine Birch sounded a note of caution. “Overall, Germany’s economy is steadily improving and the question is now whether the recent gains will be able to be maintained.”

Click for more news