News

Euro-zone sentiment improves; index still relatively low

21 August 2020

Summary: European Union households slightly less pessimistic in August; confidence index back to June level, above consensus expectation; still significantly below long-term average; euro-zone bond yields largely unchanged.


EU consumer confidence plunged during the GFC and again in 2011/12 during the European debt crisis. Since early 2014, it has been at average or above-average levels, rising to a cyclical peak at the beginning of 2018.  Even after it dropped back significantly in late 2018, the index remained at a level which corresponds to significant optimism among households until a substantial drop took place in April 2020. The latest reading indicates households still remain somewhat pessimistic.

The August survey conducted by the European Commission indicated its Consumer Confidence index has crept up to -14.7, the same value as in June. The figure was above the -15.0 which had been expected and a little higher than July’s final figure, also -15.0. The average reading since the beginning of 1985 has been -11.6.

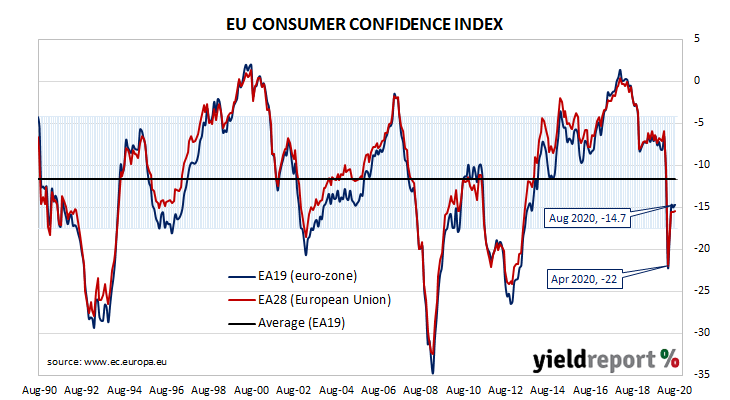
The report had a trivial effect on major European bond markets, the spotlight largely on “flash” Markit PMIs. By the end of the day, the German 10-year bund yield had slipped 1bp to -0.51% while the French 10-year OAT yield remained unchanged at -0.20%.

US post-pandemic recovery “losing steam”: leading index

20 August 2020

Summary: US leading index increases for the third consecutive month; increase more than expected; initial post-pandemic recovery “losing steam”.


The Conference Board Leading Economic Index (LEI) is a composite index composed of ten sub-indices which are thought to be sensitive to changes in the US economy. The Conference Board describes it as an index which attempts to signal growth peaks and troughs; turning points in the index have historically occurred prior to changes in aggregate economic activity. Readings from March and April signalled “a deep US recession” but more recent readings indicate the worst has passed.

The latest reading of the LEI indicates it rose by 1.4% in July. The result was slightly more than the 1.0% increase which had been generally expected but less than half of June’s 3.0% after it was revised up from 2.0%. On an annual basis, the LEI growth rate increased from June’s revised figure of -8.1% to -7.2%.

“Despite the recent gains in the LEI, which remain fairly broad-based, the initial post-pandemic recovery appears to be losing steam. The LEI suggests that the pace of economic growth will weaken substantially during the final months of 2020,” said Ataman Ozyildirim, Senior Director of Economic Research at The Conference Board.

Changes over time can be large but once they are standardised, a clearer relationship with GDP emerges. The latest reading implies a year-on-year growth rate of -2.2% in October.

Long-term US Treasury bond yields finished lower. By the end of the day, the 2-year yield had inched up 1bp to 0.15% while 10-year and 30-year yields each finished 3bps lower at 0.65% and 1.39% respectively.

In terms of US Fed policy, expectations of any change in the federal funds rate over the next 12 months retained a slight easing bias. OIS contracts for September implied an effective federal funds rate of around 0.07%, about 2bps below the current spot rate.

Leading index stalls; “remains in deep negative territory”

19 August 2020

Summary:  Leading index improves marginally in July; implies annual GDP growth to fall to ~-1.75% later this year/early next year; still consistent with recession; Westpac forecasts flat GDP in September quarter, 2.8% growth in December quarter; forecast based on easing of Victorian restrictions, no outbreaks elsewhere in Australia; RBA expects essentially no growth over second half of 2020.


Westpac and the Melbourne Institute describe their Leading Index as a composite measure which attempts to estimate the likely pace of Australian economic activity over the next three to six months. After reaching a peak in early 2018, the index trended lower through 2018, 2019 and the early months of 2020 before plunging to recessionary levels in the second quarter.

The latest reading of the six month annualised growth rate of the indicator increased ever-so-slightly, from June’s revised figure of –4.43% to -4.37% in July.

“The Index growth rate remains in deep negative territory consistent with recession,” Westpac chief economist Bill Evans.

Index figures represent rates relative to trend-GDP growth, which is generally thought to be around 2.75% per annum. The index is said to lead GDP by three to six months, so theoretically the current reading represents an annualised GDP growth rate of around -1.75% in the last quarter of 2020 and/or the first quarter of 2021.

Commonwealth Government bond yields remained stable except at the ultra-long end. By the end of the day, 3-year and 10-year ACGB yields both remained unchanged at 0.30% and 0.9% respectively while the 20-year yield finished 2bps lower at 1.44%.

In the cash futures market, expectations of a change in the actual cash rate, currently at 0.13%, continued to remain low. By the end of the day, contracts implied the cash rate would remain in a range of 0.125% to 0.135% through to the latter part of 2021.

Evans said Westpac now expects the Victorian economy to contract by 9%, offsetting growth elsewhere in Australia. “For Australia overall, we expect growth in the economy to be flat in the September quarter before lifting by 2.8% in the December quarter on the assumption that Victoria moves through Stage 4 to Stage 2 and the other states avoid ‘second wave’ outbreaks.”

US recovery continues; output, capacity usage rise

14 August 2020

Summary: US output increases for third consecutive month; gain higher than expected; capacity utilisation increases but still at GFC levels.


The Federal Reserve’s industrial production (IP) index measures real output from manufacturing, mining, electricity and gas company facilities located in the United States. These sectors are thought to be sensitive to consumer demand and so some leading indicators of GDP use industrial production figures as a component.

Production began to recover in May after a collapse which took place through March and April.

According to July’s figures, US industrial production expanded by 3.0% on a seasonally adjusted basis, the third consecutive monthly increase. The result was greater than the 2.7% expansion which had been expected but half that of June’s 5.4%. On an annual basis, the growth rate increased from June’s revised figure of -11.0% to -8.2%.

The report was released on the same day as July’s retail sales figures and the University of Michigan’s latest consumer sentiment report. US Treasury bond yields moved lower except at the ultra-long end where they increased a little. By the end of the day; the US 2-year Treasury yield had shed 3bps to 0.15%, the 10-year yield had slipped 1bp to 0.71% while the 30-year yield finished 2bps higher at 1.45%.

The same report includes US capacity utilisation figures which are generally accepted as an indicator of future investment expenditure and/or inflationary pressures. Capacity usage had hit a high for this business cycle in early 2019 before it began a downtrend which ended with April’s multi-decade low of 64.2%. July’s reading extended on the previous month’s recovery; capacity utilisation increased from June’s revised figure of 68.5% to 70.6%.

Confidence stable in US but “bad times” expected to persist

14 August 2020

Summary: US consumer confidence stable in August; index still close to April low; low interest rates help current conditions; lack of additional fiscal stimulus clouded outlook; “bad economic times” to persist.


US consumer confidence started 2020 at an elevated level. However, by March, surveys had begun to reflect a growing uneasiness with the global spread of COVID-19 and its reach into the US. After a plunge in April, US household confidence began to recover. However, it has since fallen back.

The latest survey conducted by the University of Michigan indicates the average confidence level of US households essentially remained unchanged at a depressed level in August. The University’s preliminary reading from its Index of Consumer Sentiment registered 72.8 in August, more than the generally expected figure of 71.

The result represented a slight improvement from July’s final figure of 72.5. “Two significant changes since April have been that consumers have become more pessimistic about the five-year economic outlook and more optimistic about buying conditions,” said the University’s Surveys of Consumers chief economist, Richard Curtin.

The report was released on the same day as July retail sales and June industrial production figures. US Treasury bond yields moved lower except at the ultra-long end where they increased a little. By the end of the day; the US 2-year Treasury yield had shed 3bps to 0.15%, the 10-year yield had slipped 1bp to 0.71% while the 30-year yield finished 2bps higher at 1.45%.

Curtin said the lack of an additional stimulus package had prompted the weaker outlook while lower interest rates had created more favourable buying conditions. Overall, he said the survey indicated the US household sector anticipated “bad economic times…to persist” in the year ahead, with a majority of consumers expecting “no return to a period of uninterrupted growth over the next five years.”

Less-confident households are generally inclined to spend less and save more; some drop off in household spending could be expected to follow. As private consumption expenditures account for a majority of GDP in advanced economies, a lower rate of household spending growth would flow through to lower GDP growth if other GDP components did not compensate.

Retail sales back above pre-pandemic level in US

14 August 2020

Summary:  Retail sales increases for a third consecutive month; back to pre-pandemic level; majority of category segments increase sales over month; food and drink sales, “gas station” sales the largest influences on month’s total.


US retail sales had been trending up since late 2015 but, commencing in late 2018, a series of weak or negative monthly results led to a drop-off in the annual growth rate which brought the annual rate below 2.0% by the end of that year. Growth rates then increased in trend terms through 2019 and into early 2020 until pandemic restrictions on American households sent it into negative territory.

According to the latest “advance” sales numbers released by the US Census Bureau, total retail sales increased by 1.2% in July. The gain was less than the 1.7% which had been expected and much lower than the 8.4% jump after revisions in June. On an annual basis, the growth rate increased from June’s revised rate of 2.1% to 2.7%.

“The value of retail sales is now above the pre-pandemic level. The rebound in activity has been disproportionately in online sales, while restaurant spending remains lower,” said ANZ economist Hayden Dimes.

The report was released on the same day as the University of Michigan’s August consumer survey and June industrial production figures. US Treasury bond yields moved lower except at the ultra-long end where they increased a little. By the end of the day; the US 2-year Treasury yield had shed 3bps to 0.15%, the 10-year yield had slipped 1bp to 0.71% while the 30-year yield finished 2bps higher at 1.45%.

A majority of segments increased sales over the month, with the “Food services & drinking places” and “Gasoline station” segments providing the largest influences on the overall result. Sales in these segments increased by 5.0% and 6.2% respectively over the month.

US CPI rises for second consecutive month

12 August 2020

Summary:  July CPI increase double expected figure; both headline and core figures record large monthly increase; “virus still raging in the US”, “may be some time” before sustained improvement in activity; fuel prices, car insurance premiums up but higher prices of vehicles, clothing and domestic airfare responsible for surprise; Fed unofficial estimate of underlying inflation ticks up.


The annual rate of US inflation as measured by changes in the consumer price index (CPI) halved from nearly 3% in the period from July 2018 to February 2019. It then fluctuated in a range from 1.5% to 2.0% through 2019 before rising above 2.0% in the final months of that year. “Headline” inflation is known to be volatile and so references are often made to “core” inflation for analytical purposes. Substantially lower rates for both measures were reported from March to May but recent reports indicate consumer inflation has been rekindled.

The latest CPI figures released by the Bureau of Labor Statistics indicated seasonally-adjusted consumer prices increased by 0.6% on average in July. The rise was double the expected figure but the same as June’s increase. On a 12-month basis, the inflation rate accelerated from June’s rate of 0.7% to 1.0%. Core inflation, a measure of inflation which strips out the volatile food and energy components of the index, increased on a seasonally-adjusted basis by 0.6% for the month. The increase was more than the 0.2% rise which had been expected and significantly higher than June’s 0.2%. The seasonally adjusted annual rate increased from 1.2% to 1.6%,

“This data and the PPI released a day earlier were both stronger than expected but with the virus still raging in the US it may be some time before there is a sustained improvement in economic activity,” said ANZ FX strategist John Bromhead.

US Treasury bond yields finished higher at the long end. By the end of the day, the US 2-year Treasury yield remained unchanged at 0.15% while 10-year and 30-year yields each finished 3bps higher at 0.67% and 1.36% respectively.

In terms of US Fed policy, expectations of any change in the federal funds range over the next 12 months remained fairly soft. OIS contracts for September implied an effective federal funds rate of 0.072%, or 3.4bps less than the end-of-day spot rate of 0.10%.

Production recovery continues in euro-zone

12 August 2020

Summary: Euro-zone industrial production continues recovery after huge falls in March, April; monthly figure less than consensus estimate; annual rate still very negative; major euro-zone economies except Italy exceed overall rate.


Following a recession in 2009/2010 and the debt-crisis of 2010-2012 which flowed from it, euro-zone industrial production recovered and then reached a peak four years later in early-2016. Growth rates then fell and recovered through 2016/2017 before beginning a steady and persistent slowdown from the start of 2018. That decline was transformed into a plunge in March and April.

According to the latest figures released by Eurostat, euro-zone industrial production expanded on a seasonally-adjusted basis by 9.1% in June. The increase was less than the 12.0% increase which had been generally expected and less than May’s revised figure of 12.3%. On an annual basis, the seasonally-adjusted growth rate increased from May’s revised rate of -20.4% to -11.9%*.

German and French 10-year bond yields moved uniformly higher on the day. By the close of business, yields on German and French 10-year bonds had both gained 3bps to -0.45% and -0.17% respectively.

Industrial production continued to rebound across all four of the largest euro-zone economies. Germany’s production increased by 10.8% while comparable figures for France, Spain and Italy were 12.9%, 14.5% and 8.2% respectively.

Pessimism spreads from Victoria in August

12 August 2020

Summary: Household sentiment retreats for second consecutive month; confidence index back to level comparable to April; extent of deterioration in non-Victorian states a surprise; index significantly below long-term average; Westpac chief economist says August reading be treated cautiously; households “extremely worried” about job loss.


After a lengthy divergence between measures of consumer sentiment and business confidence in Australia which began in 2014, confidence readings of the two sectors converged again around July 2018. Both readings then deteriorated gradually in trend terms, with consumer confidence leading the way. Household sentiment fell off a cliff in April but then staged a recovery through May and June. Recent readings have reversed much of that.

According to the latest Westpac-Melbourne Institute survey conducted in early August, average household sentiment has continued to falter. The Consumer Sentiment Index declined from 87.9 to 79.5, taking it back to a level not far above April’s cyclical low of 75.6.

“The scale of the fall comes as a major surprise,” said Westpac chief economist Bill Evans.

Local Treasury bond yields increased noticeably at the long end, largely in line with higher US Treasury yields in overnight trading. By the end of the day, the 3-year ACGB yield had added 1bp to 0.31%, the 10-year yield had gained 5bps to 0.94% while the 20-year finished 6bps higher at 1.51%.

In the cash futures market, expectations of a change in the actual cash rate remained fairly stable. By the end of the day, contracts implied the cash rate would remain in a range of 0.12% to 0.13% through to the latter part of 2021.

Any reading below 100 indicates the number of consumers who are pessimistic is greater than the number of consumers who are optimistic. The latest figure has fallen further below the low end of the normal range and it is significantly below the long-term average reading of just over 101.

US producer price rise double expected, long term yields jump

11 August 2020

Summary: Prices received by producers increase noticeably on average; rise double expected figure; annual “core” PPI moves away from zero; long-term US bond yields jump; PPI rise driven by both higher goods and services prices.


Around the end of 2018, the annual inflation rate of the US producer price index (PPI) began a downtrend which then continued through 2019. Months in which prices received by producers increased suggested the trend may have been coming to an end, only for it to continue. The downtrend turned into a plunge in April.

The latest figures published by the Bureau of Labor Statistics indicate producer prices rose by 0.6% after seasonal adjustments in July. The increase was double to the 0.3% rise which had been generally expected and in contrast to June’s 0.2% fall. On a 12-month basis, the rate of producer price inflation after seasonal adjustments increased to -0.4%, higher than the -0.8% annual rate recorded in May and June.

Core PPI inflation increased by more than expected. PPI inflation excluding foods and energy rose by 0.5% after recording consecutive declines in 0.3% in June and 0.1% in May. The annual rate increased from 0.1% to 0.4%.

US Treasury bond yields finished higher across the curve, especially at the long end. By the end of the day, the US 2-year yield had added 2bps to 0.15%, the 10-year yield had gained 6bps to 0.64% while the 30-year yield finished 8bps at 1.33%.

The BLS stated higher prices for final demand services were the main drivers of the month’s increase after they rose by 0.5% on average. Prices of goods increased by 0.8% on average.

The producer price index (PPI) is a measure of prices received by producers for domestically produced goods, services and construction. It is put together in a fashion similar to the consumer price index (CPI) except it measures prices received from the producer’s perspective rather than from the perspective of a retailer or a consumer. It is another one of the various measures of inflation tracked by the US Fed, along with core personal consumption expenditure (PCE) price data.

Click for more news