News

Confidence slides in US, more falls “likely”

16 July 2020

Summary: US consumer confidence retreats in July; index close to April low as US virus infections surge; declines “more likely” in months ahead.


US consumer confidence started 2020 at an elevated level. However, by March, surveys had begun to reflect a growing uneasiness with the global spread of COVID-19 and its reach into the US. After a plunge in April, US household confidence began to recover.

The latest survey conducted by the University of Michigan indicates the average confidence level of US households deteriorated in July after improving in May and June. The University’s preliminary reading from its Index of Consumer Sentiment registered 73.2 in July, less than the expected figure of 80.

The result represented a deterioration from June’s final figure of 78.1. “Consumer sentiment retreated in the first half of July due to the widespread resurgence of the coronavirus,” said the University’s Surveys of Consumers chief economist, Richard Curtin.US consumer confidence retreats in July; index close to April low as US virus infections surge; declines “more likely” in months ahead.

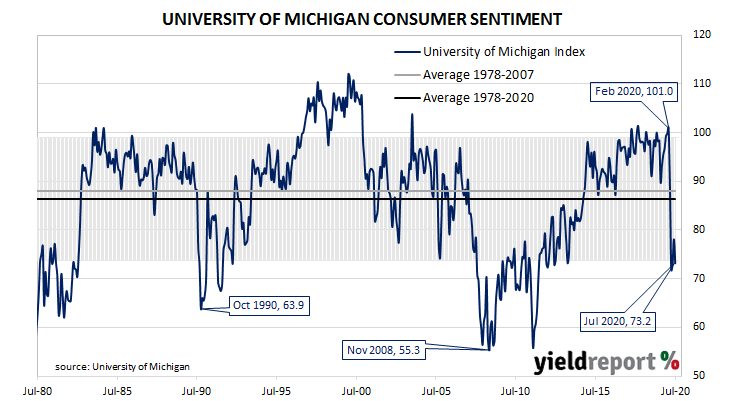
Despite the report, US Treasury bond yields moved a little higher. By the end of the day; the US 2-year Treasury yield was unchanged at 0.14%, the 10-year yield had inched up 1bp to 0.63% and the 30-year yield finished 2bps higher at 1.33%.

Curtin was pessimistic in the short-term. “Unfortunately, declines are more likely in the months ahead as the coronavirus spreads and causes continued economic harm, social disruptions, and permanent scarring.” He said “another aggressive fiscal response” by the US government was required “urgently” and without it “another plunge in confidence and a longer recession is likely to occur.”

Less-confident households are generally inclined to spend less and save more; some drop off in household spending could be expected to follow. As private consumption expenditures account for a majority of GDP in advanced economies, a lower rate of household spending growth would flow through to lower GDP growth if other GDP components did not compensate.

Retail continues recovery in US; may be “old news”

16 July 2020

Summary:  Retail sales increases for second consecutive month; back to positive on annual basis; most segments make gains, some substantial; report viewed as “old news” given recent US infection rates.


US retail sales had been trending up since late 2015 but, commencing in late 2018, a series of weak or negative monthly results led to a drop-off in the annual growth rate which brought the annual rate below 2.0% by the end of that year. Growth rates then increased in trend terms through 2019 and into early 2020, until restrictions on American households took effect in March and April.

According to the latest “advance” sales numbers released by the US Census Bureau, total retail sales increased by 7.5% in June. The gain was a more than the 5.5% which had been expected and it was on top of the huge 18.2% jump after revisions in May. On an annual basis, the growth rate moved back into positive territory, increasing from May’s revised rate of -5.6% to 1.1%.

Despite the figures, US Treasury bond yields finished modestly lower as disappointing initial jobless claims figures took effect. By the end of the day, 2-year and 10-year Treasury yields had each slipped 1bp to 0.15% and 0.62% while the 30-year yield finished 3bps lower at 1.31%.

In terms of likely US monetary policy, expectations of any change in the federal funds rate over the next 12 months retained their slight easing bias. OIS contracts for July implied an effective federal funds rate of 0.079%, about 2bps below the current spot rate.

ANZ economist Adelaide Timbrell said the figures “were treated as old news, given recent developments…The sustainability of this rebound will be largely determined by whether another fiscal deal is reached.”

Most segments increased sales over the month, with the clothing stores, “Motor vehicle & parts dealers” and “Food services & drinking places” segments all providing the largest influences on the overall result. Sales in these segments increased by 105.1%, 8.2% and 20.0% respectively over the month.

Recovery continues in June; US output, capacity usage rise

15 July 2020

Summary: US output increases for a second consecutive month; gain higher than expected; capacity usage increases but still at GFC levels.


The Federal Reserve’s industrial production (IP) index measures real output from manufacturing, mining, electricity and gas company facilities located in the United States. These sectors are thought to be sensitive to consumer demand and so some leading indicators of GDP use industrial production figures as a component.

Figures from early-2020 had been suggestive of a possible end to a downtrend which began in late-2018, only to collapse through March and April.

According to June’s figures, US industrial production expanded by 5.4%, seasonally adjusted. The result was greater than the 4.8% increase which had been expected and significantly higher than May’s revised figure of 1.4%. On an annual basis, the growth rate increased from May’s revised figure of -15.4% to -10.8%.

US output increases for a second consecutive month; gain higher than expected; capacity usage increases but still at GFC levels.

US Treasury bond yields barely moved. By the end of the day, the US 2-year Treasury yield had slipped 1bp to 0.16% while 10-year and 20-year yields had each inched up 1bp to 0.63% and 1.33% respectively.

In terms of likely US monetary policy, expectations of any change in the federal funds rate over the next 12 months remained negligible. OIS contracts for July implied an effective federal funds rate of 0.079%, just over 2bps below the current spot rate.

The same report includes US capacity utilisation figures which are generally accepted as an indicator of future investment expenditure and/or inflationary pressures. Capacity usage had hit a high for this business cycle in early 2019 before it began a downtrend which ended with April’s multi-decade low of 64.2%. June’s reading extended on the previous month’s recovery; capacity utilisation increased from May’s revised figure of 65.2% to 68.6%.

Vic outbreaks drag down household sentiment

15 July 2020

Summary: Household sentiment falls back after two months of rises; confidence index back to level comparable to May; survey period did not cover Sydney cluster announcement; pessimists outnumber optimists; index sensitive to local news regarding COVID-19.


 After a lengthy divergence between measures of consumer sentiment and business confidence in Australia which began in 2014, confidence readings of the two sectors converged again around July 2018. Both readings then deteriorated gradually in trend terms, with consumer confidence leading the way. Household sentiment fell off a cliff in April but then staged a recovery through May and June.

According to the latest Westpac-Melbourne Institute survey conducted in the second week of July, average household sentiment has faltered. The Consumer Sentiment Index declined from 93.7 to 87.9, taking it back to a level comparable with the index in May.

“The timing of the survey is relevant. It covered the week in which the lockdown was announced for Melbourne but the survey closed before the news of a significant cluster was reported for Sydney,” said Westpac chief economist Bill Evans.Household sentiment falls back; survey period did not cover Sydney cluster announcement;index sensitive to local news regarding COVID-19.

Local Treasury bond yields fell at the long end. By the end of the day, the 3-year ACGB yield was unchanged at 0.31% while the 10-year yield had lost 4bps to 0.89% and the 20-year finished 3bps lower at 1.53%.

In the cash futures market, expectations of a change in the actual cash rate remained fairly stable. By the end of the day, contracts implied the cash rate would remain in a range of 0.13% to 0.14% through to the latter part of 2021.

Any reading below 100 indicates the number of consumers who are pessimistic is greater than the number of consumers who are optimistic. The latest figure is again below the low end of the normal range and it is noticeably below the long-term average reading of just over 101.

Westpac’s Evans noted sensitivity to local news regarding COVID-19. “Victoria’s sentiment index plunged 10.4% in July but sentiment across the rest of the nation showed much milder declines…While milder, the weakness in other states is also likely to be linked to the outbreak in Victoria, reflecting concerns about the virus spreading interstate and spill-over effects on the wider economy.”

US CPI back above zero on fuel, meats; rents increases slow substantially

14 July 2020

Summary:  June CPI increases in line with expectations; both headline and core figures back above zero for month; fuel prices, car insurance premiums up; food, especially meats, up; small rent increases suggest core inflation likely weak “for some time”.


The annual rate of US inflation as measured by changes in the consumer price index (CPI) halved from nearly 3% in the period from July 2018 to February 2019. It then fluctuated in a range from 1.5% to 2.0% through 2019 before rising above 2.0% in the final months of that year. “Headline” inflation is known to be volatile and so references are often made to “core” inflation for analytical purposes. Substantially lower rates for both measures have been reported since March.

The latest CPI figures released by the Bureau of Labor Statistics indicated seasonally-adjusted consumer prices increased by 0.6% on average in June. The rise was in line with expectations and in contrast with the 0.1% decline recorded in May. On a 12-month basis, the inflation rate accelerated from May’s rate of 0.2% to 0.7%.June CPI increases; fuel prices, car insurance premiums up; food, especially meats, up; small rent increase suggest core inflation

Core inflation, a measure of inflation which strips out the volatile food and energy components of the index, increased on a seasonally-adjusted basis by 0.2% for the month. The increase was more than the 0.1% rise which had been expected and a reversal of May’s -0.1%. However, the seasonally adjusted annual rate remained at 1.2%,

ANZ senior economist Cherelle Murphy said, “These data provided some hope to markets that disinflationary pressures are starting to abate.”

Short-term US Treasury bond yields increased while longer-term yields remained steady. The 2-year yield increased by 4bps to 0.17% while 10-year and 30-year yields finished the day unchanged at 0.62% and 1.31% respectively.

In terms of likely US monetary policy, expectations of any change in the federal funds rate over the next 12 months remained negligible. OIS contracts for July implied an effective federal funds rate of 0.078%, a little under the current spot rate.

The largest influence on headline results is often the change in fuel prices. In June they increased by 11.7% on a seasonally adjusted basis, contributing around +0.25% to the total change for the month. The next largest source of inflationary pressure came from a 5.1% rise in vehicle insurance premiums, partially reversing a sizable fall in May. Inflation in food, especially meats continued.

Germany’s economy lags as euro-zone production bounces

14 July 2020

Summary: euro-zone industrial production bounces after huge falls in March, April; monthly figure better than consensus estimate; annual rate still very negative; German production rises less than the overall rate.


 Following a recession in 2009/2010 and the debt-crisis of 2010-2012 which flowed from it, euro-zone industrial production recovered and then reached a peak four years later in early-2016. Growth rates then fell and recovered through 2016/2017 before beginning a steady and persistent slowdown from the start of 2018. That decline was transformed into a plunge beginning in March 2020.

According to the latest figures released by Eurostat, euro-zone industrial production expanded by a seasonally-adjusted 12.4% in May. The increase was considerably more than the 8.1% median expectation and a partial reversal of April’s 18.2% plunge after revisions. On an annual basis, the seasonally-adjusted growth rate increased from April’s revised rate of -28.8% to -20.6%*.euro-zone industrial production bounces after huge falls in March, April; annual rate still very negative; German production rises

French and German 10-year bond yields moved uniformly lower on the day. By the close of business, yields on German and French 10-year bonds had both shed 3ps to -0.45% and -0.13% respectively.

Industrial production rebounded across all four of the largest euro-zone economies. Germany’s production increased by 9.7%, less than the euro-zone overall increase. Comparable figures for France, Spain and Italy were 20.0%, 42.1% and 15.1% respectively.

As with other countries’ measures of industrial production, Eurostat’s industrial production index measures the output and activity of industrial sectors in euro-zone countries on aggregate.

* Eurostat’s published annual growth figures are calculated using index figures which are “calendar-adjusted”, not “seasonally adjusted”. The published Eurostat figure was -20.9%.

Business conditions, confidence up; still “well below average”

14 July 2020

Summary: Business conditions up; business confidence improve for third consecutive month; capacity usage continues recovery but still at low level; second Victorian lockdown to put “brakes on the recovery”.


NAB’s business survey indicated Australian business conditions were robust in the first half of 2018, with a cyclical-peak reached in April of that year. Readings from NAB’s conditions index then began to slip, declining to below-average levels by the end of 2018. Forecasts of a slowdown in the domestic economy began to emerge in the first half of 2019 and NAB’s business confidence index continued trending lower, with the conditions index following. In March 2020, vastly lower readings began to reflect coronavirus containment measures.

According to NAB’s latest monthly business survey of 400 firms conducted in the last week of June, business conditions improved for a second consecutive month. NAB’s conditions index registered -7, up from May’s reading of -24.

“Nonetheless, while the rebound has been significant, conditions remain deeply negative and well below average, reflecting the fact that activity still has some way to go before a full recovery can be declared,” said NAB chief economist Alan Oster.

Business confidence moved higher for a third consecutive month. NAB’s confidence index rose from May’s reading of -20 to +1. Typically, NAB’s confidence index leads the conditions index by approximately one month, although some divergences appear from time to time.Business conditions up; business confidence improve for third consecutive month; capacity usage continues recovery; second Victorian lockdown

The figures came out on the same day as ABS Weekly payroll figures and Commonwealth bond yields moved a little higher at the long end, ignoring lower US Treasury bond yields in overnight trading. By the end of the day, the 3-year ACGB yield remained steady at 0.31% while the 10-year yield had ticked up 1bp to 0.93% and the 20-year yield had gained 2bps to 1.56%.

In the cash futures market, expectations of a change in the actual cash rate remained fairly stable. By the end of the day, contracts implied the cash rate would remain in a range of 0.13% to 0.145% through to the latter part of 2021.

PPI falls in June; “disinflation” until capacity utilised

10 July 2020

Summary: Prices received by producers fall on average; decrease more than expected; driven by lower services prices; core PPI near zero; excess capacity behind “disinflation”.


Around the end of 2018, the annual inflation rate of the US producer price index (PPI) began a downtrend which then continued through 2019. Months in which prices received by producers increased suggested the trend may have been coming to an end, only for it to continue. The downtrend turned into a plunge in April.

The latest figures published by the Bureau of Labor Statistics indicate producer prices fell by 0.2% after seasonal adjustments in June. The decrease was in contrast to the 0.4% rise which had been generally expected and May’s +0.4%. On a 12-month basis, the rate of producer price inflation after seasonal adjustments remained negative at -0.8%, the same rate as in May but higher than April’s -1.0%.Prices received by producers fall on average; driven by lower services prices; core PPI near zero; excess capacity behind “disinflation”.

“Core” PPI inflation fell by 0.3%, a larger decline than May’s -0.1%. The annual rate fell again, this time from 0.3% to 0.1%.

Westpac’s Finance AM team said, “There obviously are no upside pressures building…” They also noted FOMC member Robert Kaplan had recently said the US would experience “disinflation for some period of time until we get rid of this excess capacity”.

Despite the lower-than expected figures, US Treasury bond yields finished moderately higher at the long end. By the end of the day, the US 2-year yield remained unchanged at 0.16% while the 10-year yield had gained 3bps to 0.64% and the 30-year yield had increased by 2bps to 1.34%.

The BLS stated lower prices for final demand services were the main drivers of the month’s decline after they decreased by 0.3% on average. Prices of goods increased by 0.2% on average.

New home loans finally reflect pandemic’s full impact

09 July 2020

Summary: Home loan approvals fall in number and value over May; fall larger than expected; May figures reflect full impact of pandemic; owner-occupier, investor loans both fall in dollar terms; pandemic’s effect expected to “linger”.


A very clear downtrend was evident in the monthly figures of both the number and value of home loan commitments through late-2017 to mid-2019. Then the RBA reduced its cash rate target in a series of cuts and both the number and value of mortgage approvals began to noticeably increase. Figures from February provided an indication the trend may have finished but the confirmation only really came through with the latest figures.

May’s housing finance figures have now been released and the total number of loan commitments (excluding refinancing loans) to owner-occupiers fell by 7.6%. The drop came after a 4.4% decrease in April and, on an annual basis, the rate of contraction accelerated from April’s figure of -1.2% to -8.0%.

“The COVID shock finally had its full impact on housing finance data,” said Westpac senior economist Matthew Hassan.Home loan approvals fall in number and value over May; May figures reflect full impact of pandemic; owner-occupier, investor loans both falll

Despite the report, local Treasury bond yields increased moderately on the day, broadly following overnight movements in their US Treasury counterparts. By the end of the day, the 3-year ACGB yield had increased by 2bps to 0.30% while 10-year and 20-year yields had each gained 3bps to 0.92% and 1.53% respectively.

In dollar terms, total loan approvals excluding refinancing dropped by 11.6% over the month. The fall was greater than the expected 7% decline and a larger fall than April’s revised figure of -4.8%. On a year-on-year basis, total approvals excluding refinancing were still 1.8% higher, a much slower growth rate than the previous month’s comparable figure of +11.2%.

The total value of owner-occupier loan commitments excluding refinancing decreased by 10.2%, almost twice the size of April’s revised figure of -5.2%. On an annual basis, owner-occupier loan commitments were 7.3% higher than in May 2019, whereas April’s annual growth figure was 14.8%.

“Encouraging” May JOLTS report still leaves long road ahead

07 July 2020

Summary: US quit rate reverses course, rises; job openings up as well; total separations down; accommodation & food sales sector bounces back; openings-to-jobless ratio indicates “some time” for jobless rate to fall meaningfully.


The number of US employees who quit their jobs as a percentage of total employment increased slowly but steadily after the GFC. It peaked in March 2019 and then tracked sideways until virus containment measures were introduced in March. Quit rates plummeted as employment opportunities rapidly dried up.

Figures released as part of the most recent JOLTS report show the quit rate has staged a modest recovery. 1.6% of the non-farm workforce left their jobs voluntarily in May, a rise from April’s comparable figure of 1.4%. The largest source of additional quits arose from the “Accommodation & food services” and “Professional and business services” sectors while the “State and local government” and “Health care and social assistance” sectors experienced the largest monthly falls. Overall, the total number of quits for the month increased from April’s revised figure of 1.877 million to 2.067 million in May.US quit rate reverse course; job openings up as well; accommodation & food sales sector bounces back; openings-to-jobless ratio indicates

April’s non-farm payroll report indicated average hourly pay had jumped, possibly the result of fewer lower-paid jobs relative to higher paying ones. Figures from May and June then saw a fall in average hourly pay, with a corresponding fall in the annual growth rate from 8.0% in April to 5.0% in June.

Total vacancies at the end of May increased by 401,000, or 8.0%, from April’s revised figure of 4.996 million to 5.397 million, driven by large increases in the “Accommodation and food services”, “Retail trade” and construction sectors. Reduced openings in the “Information” and federal government sectors provided the largest drags. Overall, 10 out of 18 sectors experienced more job openings than in the previous month.

Total separations during the same period decreased by 5.83 million from April’s revised figure of 9.975 million to 4.145 million. The fall was once again overwhelmingly led by the “Accommodation and food services” sector, where there were 1.159 million fewer separations than in April. Separations decreased in 17 of the 18 sectors, the US Federal Government the only exception.

Click for more news