News

Job ads leap in June; recovery to be “lot slower”

06 July 2020

Summary:  Job ads leap in June; numbers improved steadily over month, as in May; ad numbers still 41% lower than in February; recovery will be “a lot slower”.

From mid-2017 onwards, year-on-year growth rates in the total number of Australian job advertisements consistently exceeded 10%. That was until mid-2018 when the annual growth rate fell back markedly. 2019 was notable for its reduced employment advertising and this trend continued into the first quarter of 2020. April’s numbers set a record of the worst type but subsequent reports have produced a recovery, at least partially.

According to the latest ANZ figures, total advertisements increased by 42.0% in June on a seasonally-adjusted basis. The jump followed a 0.3% decline in May and a 53.7% plunge in April after revisions. On a 12-month basis, total job advertisements were 44.6% lower than in June of last year, a significant improvement from May’s comparable figure of -59.9%.

“Week-to-week movements were positive as well, showing consistent improvement throughout the month. This is not overly surprising, given that COVID-19 restrictions continued to ease across most of Australia during June,” said ANZ senior economist Catherine Birch.Job ads leap in June; numbers improved steadily over month, as in May; ad numbers still 41% lower than in February, recovery

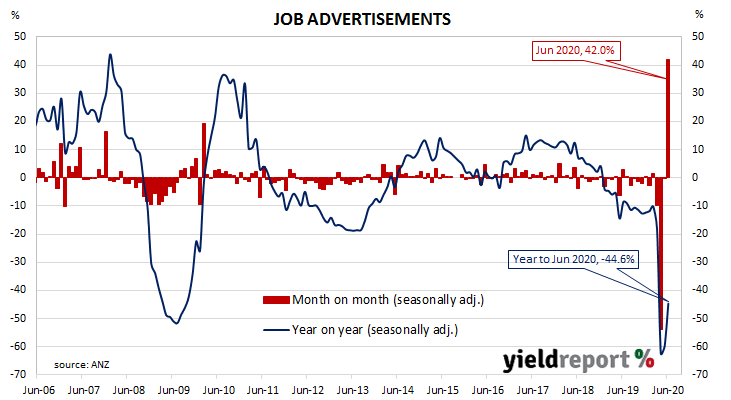
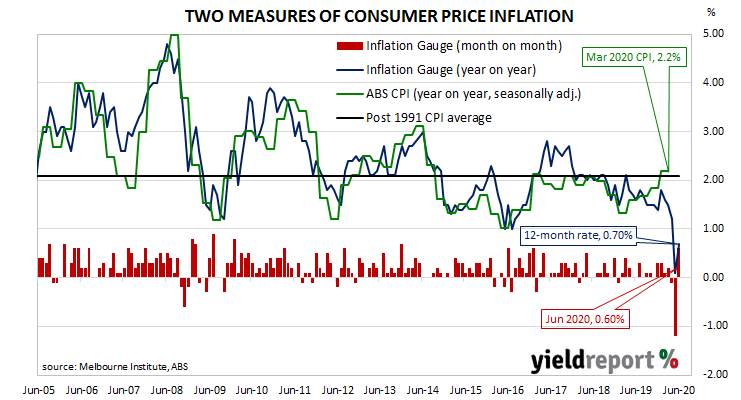
The ANZ report came out on the same day as the Melbourne Institute’s June Inflation Gauge report and long-term Commonwealth bond yields moved modestly higher, ignoring lower US Treasury yields in overnight trading. By the end of the day, the 3-year ACGB yield remained unchanged at 0.30% while 10-year and 20-year yields both finished 2bps higher at 0.94% and 1.58% respectively.

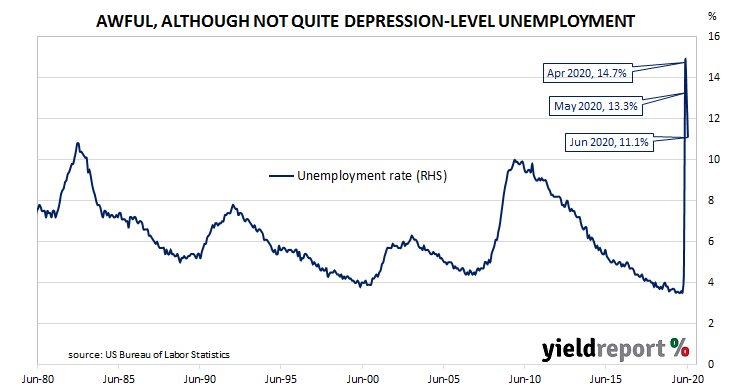
The inverse relationship between job advertisements and the unemployment rate has been quite strong (see below chart), although ANZ themselves called the relationship between the two series into question in early 2019.  A rising number of job advertisements as a proportion of the labour force is suggestive of lower unemployment rates in the near future. A falling ratio suggests higher unemployment rates will follow.

June inflation index up but still below 1%

06 July 2020

Summary: Melbourne Institute inflation index bounces after May plunge; annual rate increases but still below 1%; June quarter CPI may approach -1%.


Despite the RBA’s desire for a higher inflation rate, ostensibly to combat recessions, attempts to accelerate inflation through record-low interest rates have failed to date. The RBA’s stated objective is to achieve an inflation rate of between 2% and 3%, “on average, over time.” Since the GFC, Australia’s inflation rate has been trending lower and lower and it has been below the RBA’s target band for some years now.

The Melbourne Institute’s latest Inflation Gauge index jumped by 0.7% through June. The increase follows a 1.2% drop in May and a 0.1% decline in April. On an annual basis, the index increased by 0.7%, a sizable rebound from May’s comparable rate of just 0.1%.Melbourne Institute inflation index bounces after May plunge; annual rate increases but still below 1%; June quarter CPI may approach -1%.

The latest value of the index coincided with ANZ’s June Job Ads report and long-term Commonwealth bond yields moved modestly higher, ignoring lower US Treasury yields in overnight trading. By the end of the day, the 3-year ACGB yield remained unchanged at 0.30% while 10-year and 20-year yields both finished 2bps higher at 0.94% and 1.58% respectively.

The Melbourne Institute’s Inflation Gauge is an attempt to replicate the ABS consumer price index (CPI) on a monthly basis. It has turned out to be a reliable leading indicator of the CPI, although there are periods in which the Inflation Gauge and the CPI have diverged for as long as twelve months. On average, the Inflation Gauge’s annual rate tends to overestimate the ABS headline rate by an average of a little under 0.1%.

Given the Inflation Gauge’s tendency to overestimate, the latest figures imply an official headline CPI reading of 0.6% in annual terms or -0.9% for the June quarter. Regression analysis provides a slightly higher annual result of 0.8%. However, it is worth noting the annual CPI rate to the end of March was 2.2% while the inflation Gauge had implied a 1.4%-1.5% annual rate at the time.

Non-farm payrolls rise; rising infections may stall recovery

02 July 2020

Summary: June non-farm payrolls increase exceed gains in May; jobless rate down, participation rate up; US economy “getting back to work”; stalled openings, renewed restrictions may slow future recovery; underemployment rate lower but still high.


The US economy ceased producing jobs in net terms as infection controls began to be implemented in March. The unemployment rate had been around 3.5% but that changed as job losses began to surge through March and April. May’s non-farm employment report represented a turning point and economists expected something similar in June.

According to the US Bureau of Labor Statistics, the US economy created an additional 4.8 million jobs in the non-farm sector in June. The gain was above the 3.0 million which had been expected and more than the 2.699 million jobs which had been added in May after revisions. Employment figures for April and May were revised up by a total of 90,000.

June’s unemployment rate dropped from May’s revised rate of 13.3% to 11.1%. The total number of unemployed decreased by 3.235 million to 17.75 million while the total number of people who are either employed or looking for work increased by 1.705 million to 159.932 million. The increase in the number of people in the labour force raised the participation rate from May’s rate of 60.8% to 61.5%.

“The US labour market followed the lead of other data in June, showing the economy is getting back to work,” said ANZ economist Adelaide Timbrell.June non-farm payrolls increase exceed gains in May; jobless rate down; US economy “getting back to work”; underemployment rate lower

Most US Treasury yields fell but they increased at the ultra-long end on the day. By the close of business, the US Treasury 2-year bond yield had lost 2bps to 0.15%, the 10-year yield had slipped 1bp to 0.67% while the 30-year yield finished 1bp higher at 1.43%.

Economists have been noting rising US infection rates in recent weeks after some restrictions had been eased. Timbrell noted “…July could see the recovery in jobs slow, given the recent rise in COVID19 cases, stalled re-openings and renewed restrictions in some states…There is still a long way to go.”

One figure which is indicative of the “spare capacity” of the US employment market is the employment-to-population ratio. This ratio is simply the number of people in work divided by the total US population. It hit a cyclical-low of 58.2 in October 2010 before slowly recovering to just above 61% in late-2019. June’s reading increased for a second consecutive month from 52.8% in May to 54.6%.

ISM report suggests US economy “rapidly recovering”; doubts linger

01 July 2020

Summary: ISM purchasing managers index jumps above 50; manufacturing back into expansionary territory; implies US economy growing at solid rate; recent US infection rates may prompt “set-backs” in coming months.


 US purchasing managers’ indices (PMIs) have been sliding since August 2018, albeit from elevated levels. After reaching a cyclical peak in September 2017, manufacturing PMI readings went sideways for a year before they started a downtrend. Readings stabilised in late 2019 after a truce of sorts was made with the Chinese regarding trade. March’s report signalled a contraction in US manufacturing activity had begun which deepened through April and May.

According to the latest Institute of Supply Management (ISM) survey, its Purchasing Managers Index recorded a reading of 52.6% in June. The result was above the expected figure of 49.0% and considerably higher than May’s final reading of 43.1%. The average reading since 1948 is 52.9% and any reading above 50% implies an expansion in the manufacturing sector. A reading “above 42.8%, over a period of time, generally indicates an expansion of the overall economy,” according to the ISM.

“A reading of 52.6 for the ISM Manufacturing Index indicates the US economy is rapidly recovering,” said ANZ economist Daniel Been.SM purchasing managers index jumps; manufacturing back into expansionary territory; US economy growing at solid rate; US infection rates

The report was released on the same day as the ADP June report and US Treasury yields rose modestly. By the close of business, the 2-year Treasury bond yield had gained 4bps to 0.17%, the 10-year yield had increased by 3bps to 0.68% while the 30-year yield finished 1bp higher at 1.42%.

NAB head of FX Strategy (FICC division) Ray Attrill said, “As always, being a diffusion indices ISM/PMI surveys need to be interpreted with caution being a ‘rate of change’ metric that says nothing directly about levels of activity.” He also noted many US states had either stalled or reversed easings of restrictions which could prompt “set-backs in some of these readings in coming months…”

Purchasing Managers’ Indices (PMIs) are economic indicators derived from monthly surveys of executives in private-sector companies. They are diffusion indices, which means a reading of 50% represents no change from the previous period, while a reading under 50% implies respondents reported a deterioration on average. They are particularly useful as a leading indicator.

US unofficial payrolls jump, data revisions substantial

01 July 2020

Summary: Private sector adds jobs in June; less than expected but May numbers revised up by staggering amount; employment numbers up in firms of all sizes; services sector accounts for 85% of gains; official payroll report expected to provide similar rise.


The ADP National Employment Report is a monthly report which provides an estimate of US non-farm employment in the private sector. Since the report began to be published in 2006, its employment figures have exhibited a high correlation with official non-farm payroll figures, although a large difference can arise in any individual month.

The ADP June report indicated private sector employment increased by 2.369 million, less than the 3.0 million which had been expected. However, May’s change was transformed from a 2.76 million fall to a 3.065 million rise after revisions.

NAB Head of FX Strategy (FICC) Ray Attrill said the report was “largely ignored given last month’s report underestimated US non-farm payrolls by 5.6 million…”

Private sector adds jobs in June; employment numbers up in firms of all sizes; services sector accounts for 85% of gains; official payroll ..

The report was released on the same day as the ISM’s June PMI report and US Treasury yields rose modestly. By the close of business, the 2-year Treasury bond yield had gained 4bps to 0.17%, the 10-year yield had increased by 3bps to 0.68% while the 30-year yield finished 1bp higher at 1.42%.

Employment numbers were up across businesses of all sizes. Firms with less than 50 employees filled a net 0.937 million positions, mid-sized firms (50-499 employees) filled 0.559 million positions while large businesses (500 or more employees) accounted for 0.873 million additional employees.

Employment at service providers accounted for just over 80% of the total net increase. In the services sector, 1.912 million positions filled in net terms. The “Leisure & Hospitality” sector was the largest single source of gains, with 0.961 million additional positions filled. Total jobs among goods producers increased by a net 0.457 million, with construction firm gains accounting for over 85% of the sector’s expansion.

Approvals numbers dive, “further downside ahead”

01 July 2020

Summary: Home approval numbers dive; fall worse than expected; house approvals down moderately while apartment approvals plummet; non-residential approvals down for fourth consecutive month; recent figures down only modestly in absolute terms.


Approvals for dwellings, that is apartments and houses, had been heading south since mid-2018. As an indicator of investor confidence, falling approvals had presented a worrying signal, not just for the building sector but for the overall economy. However, approval figures from late-2019 and the early months of 2020 painted a picture of a recovery taking place, even as late as April.

The Australian Bureau of Statistics has released the latest figures from May and total residential approvals dropped by 16.4% on a seasonally-adjusted basis. The fall over the month was much worse than the -6% which had been generally expected and it was a much larger fall than April’s 2.1% decline. Total approvals decreased by 11.6% on an annual basis, a marked deterioration from April’s comparable figure of +6.1% after it was revised up from +5.7%.

“Importantly, the detail points to further downside ahead,” said Westpac senior economist Andrew Hanlan.

Home approval numbers dive; fall worse than expected; house approvals down moderately while apartment approvals plummet; non-residential approvals downThe figures came out on the same day as the AiG’s June PMI report and Commonwealth bond yields increased noticeably at the long end, more than their US Treasury counterparts had in overnight trading. By the end of the day, the 10-year Treasury yield had gained 6bps to 0.95% while the 20-year yield finished 7bps higher at 1.57%.

Prices of cash futures contracts moved to reflect a slight softening of rate-cut expectations. By the end of the day, July contracts implied a rate cut down to zero as a 59% chance, down from the previous day’s 62%. August contracts implied a 53% chance of such a move in that month, unchanged from the previous day. Contract prices of months later in 2020 and through to the latter part of 2021 implied similar probabilities, ranging between 41% and 57%.

Westpac economists are not the only ones to expect further falls this year. “We expect continued weakness in building approvals this year. Lower population growth in the near term, combined with job and income losses in industries with high shares of renters are key factors in the weak outlook for housing demand,” said ANZ economist Adelaide Timbrell.

First fall in credit growth since 2011

30 June 2020

Summary: Private sector credit shrank in May; business lending drops while owner-occupier lending maintained; investor lending goes backwards faster; “further falls” expected.


The pace of lending to the non-bank private sector by financial institutions in Australia has been trending down since October 2015. Private sector credit growth appeared to have stabilised in the September quarter of 2018 but the annual growth rate then continued to deteriorate through to the end of 2019. The early months of 2020 provided some positive signs but data from the most recent months are starting to look bleak.

According to the latest RBA figures, private sector credit contracted by 0.1% in May. The result was below 0.0% which had been expected and less than April’s result which was also a flat one. The annual growth rate slowed to 3.1% from April’s comparable rate of 3.6%.

Westpac senior economist Andrew Hanlan said he expected “further falls…”

The result was largely driven by a reduction in business loans, with personal debt and investor housing loans also contracting. Owner-occupier loans continued to grow steadily.Private sector credit shrank in May; business lending drops while owner-occupier lending maintained; investor lending goes backwards Local Treasury bonds yields moved a little lower, largely in line with movements in US Treasury yields in overnight trading. By the end of the Australian trading day, the 3-year Treasury bond yield remained unchanged at 0.28%, the 10-year yield had slipped 1bp to 0.89% while the 20-year yield finished 2bps lower at 1.50%.

In the cash futures market, expectations of a rate cut firmed a touch. At the close of business, July contracts implied a rate cut down to zero as a 62% chance, up from the previous day’s 59%. August contracts implied a 53% chance of such a move, unchanged. Contract prices of months in the remainder of 2020 and through to late-2021 implied similar probabilities, ranging between 33% and 55%.

The traditional driver of loan growth rates, the owner-occupier segment, grew by 0.5% over the month, the same rate as in March and April. The sector’s 12-month growth rate ticked up to 5.4% from April’s rate of 5.3%.

However, ANZ economist Hayden Dimes thinks this will not last. “With a weak labour market and subdued wage growth, we anticipate owner-occupier credit growth will slow and then turn negative over the coming 12 months.”

Growth rates in the business sector had been slowing until they picked up in the first quarter, with an especially large increase in March. In May, business credit contracted by 0.6%, a noticeable fall from April’s revised growth rate of 0.2%. The segment’s annual growth rate slowed from April’s revised rate of 6.7% to 5.9%.

Consumer confidence up in US; survey prior to infection surge

29 June 2020

Summary: US consumer confidence back to long term average; views of present, future conditions improve significantly; recent surge in new coronavirus cases not within survey period.


US consumer confidence collapsed in late 2007 as the US housing bubble burst and the US economy went into recession. By 2016, it had clawed its way back to neutral and then went from strength to strength until late 2018. Measures of consumer confidence then oscillated within a fairly narrow band at historically high levels until they fell noticeably in March and then collapsed in April.

The latest Conference Board survey held during the first half of June indicated US consumer confidence has recovered back to the long-term average after a relatively short-lived plunge in April and May. June’s Consumer Confidence Index registered 98.1, well above the median consensus figure of 91.5 and significantly above May’s final figure of 85.9. Consumers’ views of present and future conditions improved considerably from those held at the time of the May survey.

“The re-opening of the economy and relative improvement in unemployment claims helped improve consumers’ assessment of current conditions but the Present Situation Index suggests that economic conditions remain weak,” said Lynn Franco, a senior director at the Conference Board.US consumer confidence back to long term average; views of present, future conditions improve significantly; recent surge in new coronavirus cases not within survey period.

Longer-term US Treasury bond yields increased while yields at the short end eased. By the end of the day, the yield on 2-year Treasury bonds had lost 2bps to 0.14% while 10-year and 20-year yields had each gained 3bps to 0.65% and 1.41% respectively.

However, some economists were quick to point out a reversal may be in store. “The cut-off date for the survey was 18 June, so it didn’t capture the recent surge in new coronavirus cases. Retracement is clearly possible,” said ANZ senior economist Catherine Birch.

Euro-zone sentiment improves; still in contraction zone

29 June 2020

Summary: Euro-zone composite sentiment index improves for second consecutive month; under expectations; all major economies’ indices improve; sovereign bond yields unresponsive; implies GDP smaller contraction.


 The European Commission’s Economic Sentiment Indicator (ESI) is a composite index comprised of five differently-weighted sectoral confidence indicators.  It is heavily weighted towards confidence surveys from the business sector; the consumer confidence sub-index only accounts for 20% of the ESI. However, it has a good relationship with euro-zone GDP, although not as a leading indicator.

The ESI recorded a reading of 75.7 in June, well below the market’s expected figure of 82.5 but up against May’s reading of 67.5. The average reading since 1985 has been just under 100.Euro-zone composite sentiment index improves for second consecutive month; all major economies’ indices improve; sovereign bond yields unresponsive; implies GDP smaller contraction.

Overall sentiment in the euro-zone improved as all five confidence sub-indices showed gains. On a geographical basis, the ESI rose in most euro-zone economies, including the larger ones of Germany, France, Italy and Spain.

German and French bond yields barely moved. By the end of the day, the German 10-year bund yield had ticked up 1bp to -0.47% while the French 10-year OAT yield had slipped 1bp to -0.13%.

End-of-quarter ESI and euro-zone GDP growth rates are strongly correlated. This latest reading corresponds to a year-to-June growth rate of -2.60%, up from May’s implied growth rate of -3.90%.

Core PCE inflation stabilises at 1.0%

26 June 2020

Summary: US Fed’s favoured inflation measure rises 0.1%; more than market expectations; previous month recorded 0.4% fall; Treasury bond yields fall as coronavirus infection rate rises.


One of the US Fed’s favoured measures of inflation is the change in the core personal consumption expenditures (PCE) price index. After hitting the Fed’s target at 2.0% in mid-2018, the annual rate then hovered in a range between 1.8% and 2.0% before it eased back to a range between 1.5% and 1.8% through 2019. It then plummeted in April 2020.

 The latest figures have now been published by the Bureau of Economic Analysis as part of the May personal income and expenditures report. Core PCE prices increased by 0.1% for the month, above the flat result which had been expected and more than April’s 0.4% decrease. On a 12-month basis, the core PCE inflation rate remained unchanged at 1.0%.

NAB economist Tapas Strickland said the figures indicated there is “little in the way of inflationary pressure.”US Fed’s favoured inflation measure rises 0.1%; more than market expectations; Treasury bond yields fall as coronavirus infection rate rises.

Despite the higher-than-expected result, US Treasury yields finished lower as the daily rate of new coronavirus infections in the US climbed. By the end of the day, the 2-year yield had slipped 1bp to 0.17%, the 10-year yield had lost 3bps to 0.65% and the 30-year yield finished 6bps lower at 1.37%.

In terms of US Fed policy, a rate change of any sort remained unlikely given the federal funds rate has been at the effective lower bound since the US Fed reduced it on Sunday 15 March. However, the July OIS contract price implies traders think there is about a 25% chance of a 25bps decrease in the federal funds rate target at the next meeting of the FOMC.

Click for more news