24 June 2020
Summary: ifo business climate index extends May bounce; expectations index back to February level; “light at the end of the tunnel”; bond yields fall as US infection rates renew doubts.
The ifo Institute’s business climate index is a composite index which combines German companies’ views of current conditions with their outlook for the next six months. It has similarities to consumer sentiment indices in the US such as the ones produced by The Conference Board and the University of Michigan.
According to the latest figures released by the Institute, its business climate index bounced to 86.2 in June. The reading was above the expected reading of 84.8 and 6.5 points above May’s final reading of 79.7. The average reading since January 2005 is just above 97.
Its expectations index also jumped, registering a result just short of February’s reading. It increased from May’s final figure of 80.5 to 91.4 in June, above the expected figure of 87.0.
“This is the strongest increase ever recorded,” said Clemens Fuest, President of the ifo Institute. “German business sees light at the end of the tunnel.”
Following a recession in 2009/2010, the indices largely ignored the European debt-crisis of 2010-2012 which flowed from it, remaining at average-to-elevated levels through to early-2020. Their relationship with each other and to euro-zone GDP growth is shown below.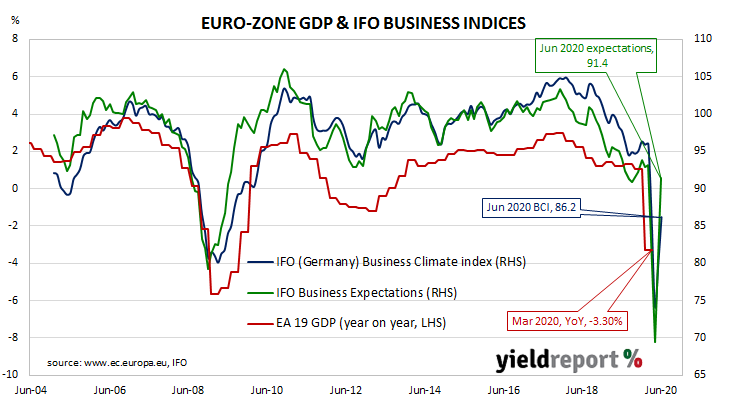
French and German 10-year bond yields fell modestly on the day as US infection rates increased doubts about the speed of economic recovery there and, by extension, elsewhere. By the close of business, the 10-year German bund yield had lost 4bps to -0.48% and the French OAT yield had shed 3bps to -0.11%.
18 June 2020
Summary: US leading index bounces; increase greater than expected; US in recession; “weak economic conditions” to persist.
The Conference Board Leading Economic Index (LEI) is a composite index composed of ten sub-indices which are thought to be sensitive to changes in the US economy. The Conference Board describes it as an index which attempts to signal growth peaks and troughs; turning points in the index have historically occurred prior to changes in aggregate economic activity. Readings from March and April signalled “a deep US recession”.
The latest reading of the LEI indicates it rose by 2.8% in May. The result was better than the 2.2% increase which had been generally expected and it was a marked turnaround from April’s figure of -6.1% after it was revised down from -4.4%. On an annual basis, the LEI growth rate increased from April’s revised figure of -13.4% to -10.9%.
“The breadth and depth of the decline in the LEI between February and April suggest the economy at large will remain in recession territory in the near term,” said Ataman Ozyildirim, Senior Director of Economic Research at The Conference Board. While a “relative improvement” in unemployment claims was the main force behind the improvement, other factors such as new orders in manufacturing, consumers’ outlook and The Conference Board’s Leading Credit Index “still point to weak economic conditions.”
Changes over time can be large but once they are standardised, a clearer relationship with GDP emerges. The latest reading implies a year-on-year growth rate of around -2.0% in the December quarter.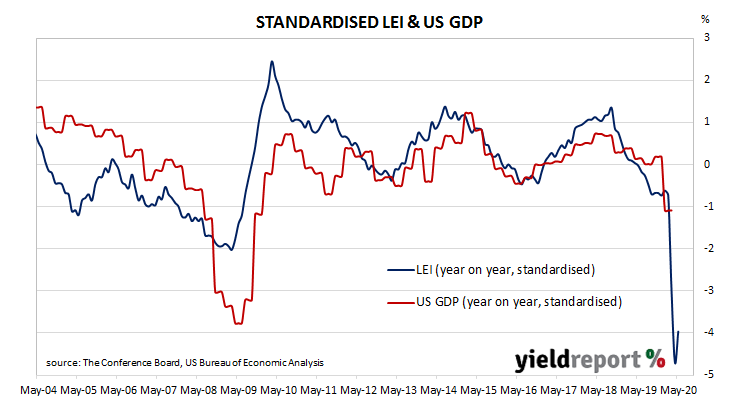
US Treasury bond yields at the long end finished lower. By the end of the day, the 2-year bond yield remained unchanged at 0.19%, the 10-year yield had lost 2bps to 0.71% while the 30-year yield finished 5bps lower at 1.48%.
17 June 2020
Summary: leading index hits floor, bounces slightly in May; implies annual GDP growth to fall to ~-2.0% later this year; Westpac trims June quarter contraction to 7%; “deep recession is still forecast”.
Westpac and the Melbourne Institute describe their Leading Index as a composite measure which attempts to estimate the likely pace of Australian economic activity over the next three to six months. After reaching a peak in early 2018, the index trended lower through 2018, 2019 and the early months of 2020. A sharp drop came as expected in March and an even sharper fall followed in April.
The latest reading of the six months annualised growth rate of the indicator has increased from April’s revised figure of –5.08% to -4.79% in May.
“Despite the slight improvement, the Index growth rate remains in deep negative territory consistent with an economic recession,” said Westpac chief economist Bill Evans.
Index figures represent rates relative to trend-GDP growth, which is generally thought to be around 2.75% per annum. The index is said to lead GDP by three to six months, so theoretically the current reading represents an annualised GDP growth rate of around -2.0% sometime in the third or fourth quarters of 2020.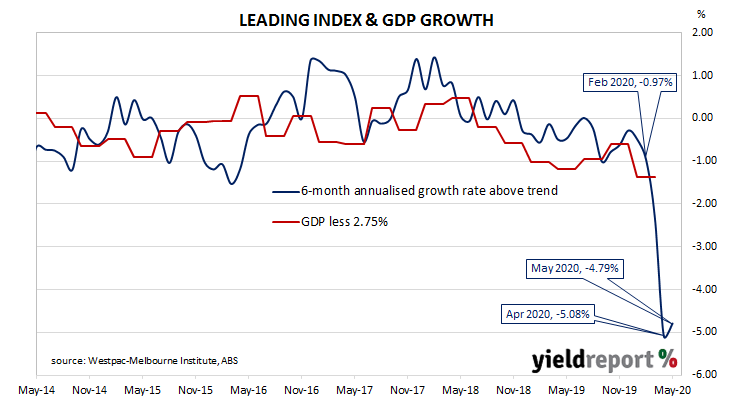
Commonwealth Government bond yields hardly moved, ignoring increases in US Treasury bond markets overnight. By the end of the day, 3-year and 10-year ACGB yields both remained unchanged at 0.28% and 0.94% respectively while the 20-year yield finished 1bp higher at 1.56%.
Prices of cash futures contracts moved to reflect a tiny hardening of rate-cut expectations. By the end of the day, July contracts implied a rate cut down to zero as a 59% chance, up from the previous day’s 57%. August contracts implied a 51% chance of such a move, up from 48%. Contract prices of months later in 2020 and through to mid-2021 implied similar probabilities, ranging between 39% and 55%.
16 June 2020
Summary: US output recovers a little; gain less than expected; figures just under April numbers before revisions; capacity usage increases modestly.
The Federal Reserve’s industrial production (IP) index measures real output from manufacturing, mining, electricity and gas company facilities located in the United States. These sectors are thought to be sensitive to consumer demand and so some leading indicators of GDP use industrial production figures as a component. Figures from early-2020 had been suggestive of a possible end to a downtrend which began in late-2018, only to collapse through March and April.
According to May’s figures, US industrial production expanded by 1.4%. The result was lower than the 3.0% increase which had been expected but it was a vast improvement on April’s revised figure of -12.5%. On an annual basis, the growth rate increased ever so slightly from April’s revised figure of -16.2% to -15.3%.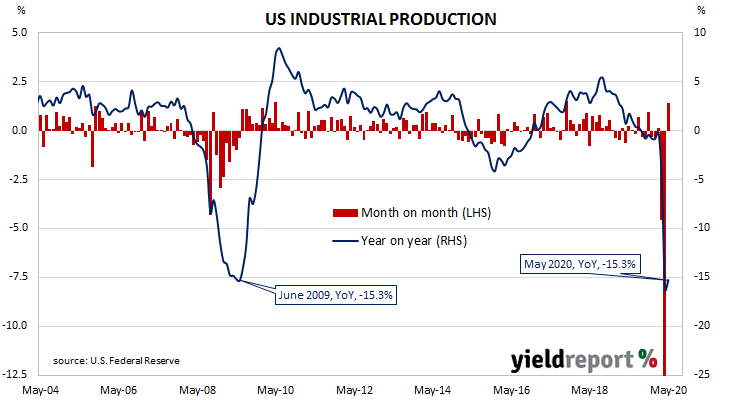
The report came out on the same day as May’s retail sales report. US Treasury bond yields finished higher, especially at the ultra-long end. By the end of the day, the US 2-year Treasury yield remained unchanged at 0.20% while the 10-year yield had gained 2bps to 0.75% and the 30-year yield had jumped 9bps higher to 1.55%.
In terms of US Fed policy, expectations of any change in the federal funds rate over the next 12 months retained an easing bias. OIS contracts from July onwards continued to imply some chance of a move to a zero effective federal funds rate.
The same report includes US capacity utilisation figures which are generally accepted as an indicator of future investment expenditure and/or inflationary pressures. Capacity usage had hit a high for this business cycle in early 2019 before it began a downtrend. April’s figure hit a multi-decade low at 64.0% after revisions but May’s reading recovered to 64.8%, a fraction under April’s preliminary figure of 64.9%.
16 June 2020
Summary: retail sales stage large bounce in May; however, still negative on annual basis; all segments make gains; June quarter GDP forecasts may be revised.
US retail sales had been trending up since late 2015 but, commencing in late 2018, a series of weak or negative monthly results led to a drop-off in the annual growth rate which brought the annual rate below 2.0% by the end of that year. Growth rates then increased in trend terms through 2019 and into early 2020, until restrictions on American households began to take effect in March.
According to the latest “advance” sales numbers released by the US Census Bureau, total retail sales leaped by 17.7% in May. The gain was a much greater one than the 7.4% which had been expected and it was an incredible turnaround from April’s revised figure of -14.7%. On an annual basis, the growth rate recovered to -6.1% from April’s revised rate of -19.9%.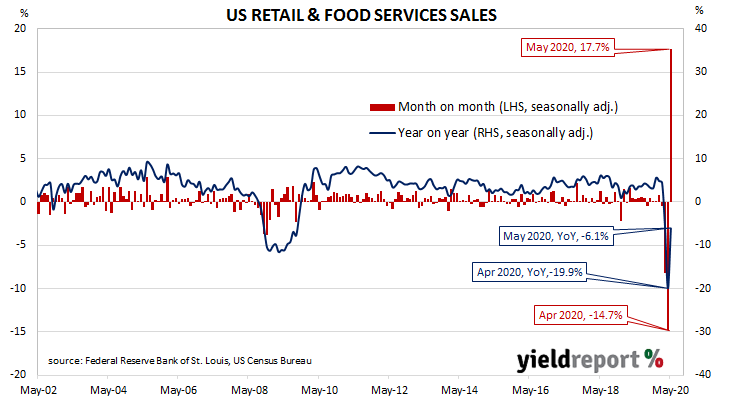
The report came out on the same day as May’s industrial production and capacity utilisation report. US Treasury bond yields finished higher, especially at the ultra-long end. By the end of the day, the US 2-year Treasury yield remained unchanged at 0.20% while the 10-year yield had gained 2bps to 0.75% and the 30-year yield had jumped 9bps higher to 1.55%
In terms of US Fed policy, expectations of any change in the federal funds rate over the next 12 months retained an easing bias. OIS contracts from July onwards continued to imply some chance of a move to a zero effective federal funds rate.
“The bounce in retail sales is remarkable and confirms the narrative seen in high-frequency data of activity having troughed in mid-April and recovering ever since,” said NAB economist Tapas Strickland. He also said the figures implied US June quarter GDP “may not be as weak as first thought given the strong bounce in May and a likely repeat in June…” and “advanced economies consumption might recover faster than the industrial side due to government payments offsetting lost income…”
16 June 2020
Summary: payrolls and wages both increased in the week to 30 May; payrolls increased in each week in May; wages fell in the three weeks prior to the latest one; payrolls and wages both down considerably in relation to start of pandemic restrictions; May employment numbers still expected to be lower.
The ABS has released its latest payroll report containing new statistics on jobs and wages based on Single Touch Payroll data provided by the ATO. Job losses do not directly translate into additional unemployment; some people hold more than one job and the report’s figures are not seasonally adjusted.
The rate of weekly job gains has remained at roughly the same pace through May. Total jobs increased by 0.4%, higher than the previous week’s flat result and a little above the 0.3% gains in the two weeks prior to that.
The total for wages provided a similar result for the week and it increased by 0.7%. However, the gain followed a 0.7% fall in the previous week and falls of 2.0% and 1.3% in the two weeks prior to that.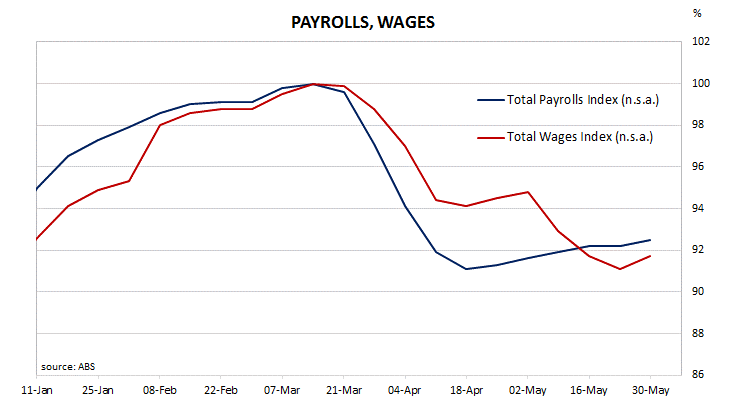
Between the week ending 14 March 2020 and the week ending 30 May 2020, the total number of work positions in Australia contracted by 7.5%. Total wages fell by 8.3% over the same eleven-week period.
12 out of the 19 sectors experienced gains for the week, with the hard-hit “Accommodation & food services” faring the best in percentage terms. Another sector greatly affected by the pandemic restrictions, the “Arts & recreation services” sector, had no change for the week.
12 June 2020
Summary: US consumer confidence improved again in June; now back within “normal” range, albeit at the lower end; “bad times” still anticipated for rest of year; coronavirus resurgence, high jobless rate cited as major concerns.
US consumer confidence started 2020 at an elevated level. However, by March, surveys had begun to reflect a growing uneasiness with the global spread of COVID-19 and its reach into the US. After a plunge in April, US household confidence began to recover.
The latest survey conducted by the University of Michigan indicates the average confidence level of US households improved for a second consecutive month, albeit at a low level. The University’s preliminary reading from its Index of Consumer Sentiment registered 78.9 in June, better than the expected figure of 76 and a moderate improvement from May’s final figure of 72.9.
“The turnaround is largely due to renewed gains in employment, with more consumers expecting declines in the jobless rate than at any other time in the long history of the Michigan surveys,” said the University’s Surveys of Consumers chief economist, Richard Curtin.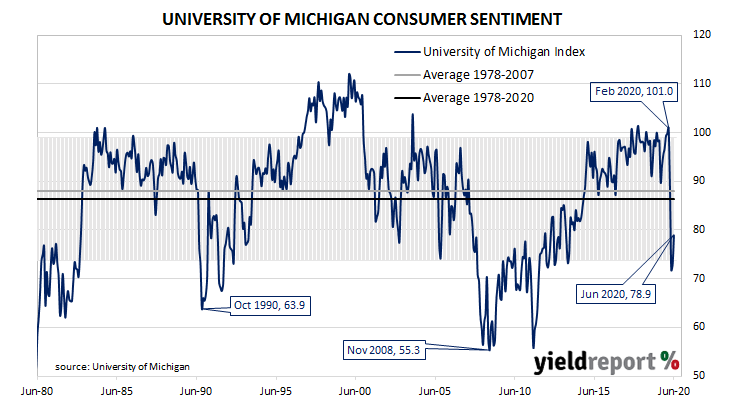
US Treasury bond yields generally moved higher. By the end of the day; the US 2-year Treasury yield was unchanged at 0.20% but the 10-year yield had gained 3bps to 0.70% and the 30-year yield finished 6bps higher at 1.46%.
According to Curtin, the overall improvement in the index had occurred as price discounting and low interest rates had offset general pessimism. “Bad times financially in the economy as a whole during the year ahead were still expected by two-thirds of all consumers, and a renewed downturn was anticipated by nearly half over the longer term. The most often cited cause of a renewed downturn is a resurgence in the spread of the coronavirus, and the most often cited cause of a slow economic recovery is the financial damage from persistently high unemployment.”
12 June 2020
Summary: eurozone industrial production suffers another huge contraction in April; monthly figure better than consensus estimate, worse than March; contraction worse in large economies.
As with other countries’ measures of industrial production, Eurostat’s industrial production index measures the output and activity of industrial sectors in euro-zone countries in aggregate. Following a recession in 2009/2010 and the debt-crisis of 2010-2012 which flowed from it, euro-zone industrial production recovered and then reached a peak four years later in early-2016. Growth rates then fell and recovered through 2016/2017 before beginning a steady and persistent slowdown from the start of 2018. That decline was transformed into a plunge in March 2020.
According to the latest figures released by Eurostat, euro-zone industrial production contracted by a seasonally-adjusted 17.1% in April. The fall was not as much as the -20% which had been expected but it was a larger one than March’s 11.9% drop after revisions. On an annual basis, seasonally-adjusted growth in industrial production went further into reverse, from March’s revised rate of -13.4% to -27.9%*.
NAB currency strategist Rodrigo Catril said, “The hope is that April should represent the nadir inactivity, given the easing of lockdown restrictions.”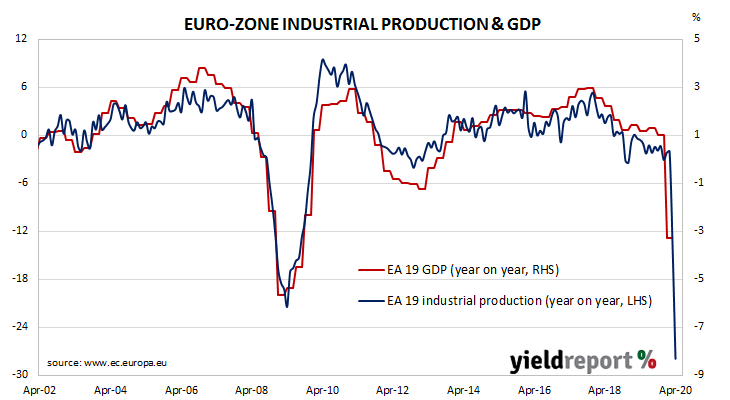
French and German 10-year bond yields moved in opposite directions on the day. By the close of business, the yield on German 10-year bunds had shed 3bps to -0.44% while the French 10-year OAT yield had gained 4bps to -0.04%.
Industrial production plunged across all four of the largest euro-zone economies. Germany’s industrial production dropped by 21.0% while comparable figures for France, Spain and Italy were -20.3%, -22.4% and -19.1% respectively.
11 June 2020
Summary: Prices received by US producers increase; change more than expected; driven by higher goods prices, services prices fall.
Around the end of 2018, the annual inflation rate of the US producer price index (PPI) began a downtrend which then continued through 2019. Months in which prices received by producers increased suggested the trend may have been coming to an end, only for it to continue. April’s report changed that.
The latest figures published by the Bureau of Labor Statistics indicate producer prices increased by 0.4% after seasonal adjustments in May. The increase was greater than the 0.1% rise which had been generally expected and a turnaround from April’s -1.3%. On a 12-month basis, the rate of producer price inflation after seasonal adjustments remained negative at -0.8% after recording -1.0% in April and +0.7% in March.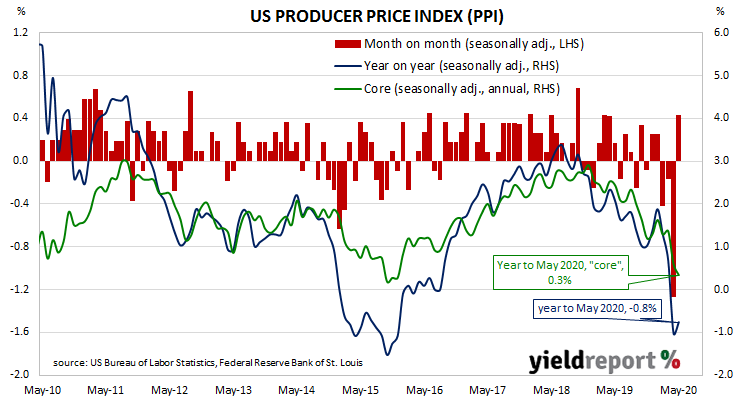
“Core” PPI inflation slipped by 0.1%, a smaller decline than April’s -0.3%. The annual rate halved from 0.6% to 0.3%.
US Treasury bond yields finished considerably lower at the long end as US equity markets tumbled amid demand for safe assets. By the end of the day, the US 2-year yield had gained 2bps to 0.20%, the 10-year yield had lost 5bps to 0.67% and the 30-year yield had shed 10bps to 1.40%.
The BLS stated prices for final demand goods were behind the month’s increase as they increased by 1.6%. Prices of services fell by 0.2%.
The producer price index (PPI) is a measure of prices received by producers for domestically produced goods, services and construction. It is put together in a fashion similar to the consumer price index (CPI) except it measures prices received from the producer’s perspective rather than from the perspective of a retailer or a consumer. It is another one of the various measures of inflation tracked by the US Fed, along with core personal consumption expenditure (PCE) data.
10 June 2020
Summary: May US CPI falls a little more than expected; both headline and core figures just under zero for month; fuel prices, car insurance premiums down; food, rents up; weak inflation “an enduring theme”.
The annual rate of US inflation as measured by changes in the consumer price index (CPI) halved from nearly 3% in the period from July 2018 to February 2019. It then fluctuated in a range from 1.5% to 2.0% through 2019 before rising above 2.0% in the final months of that year. “Headline” inflation is known to be volatile and so references are often made to “core” inflation for analytical purposes. Substantially lower rates for both measures have been reported since March.
The latest CPI figures released by the Bureau of Labor Statistics indicated seasonally-adjusted consumer prices decreased by 0.1% on average in May. The fall was just under the flat result which had been expected and a smaller fall than the 0.8% drop recorded in April. On a 12-month basis, the inflation rate slowed from April’s annual rate of 0.4% to 0.2%.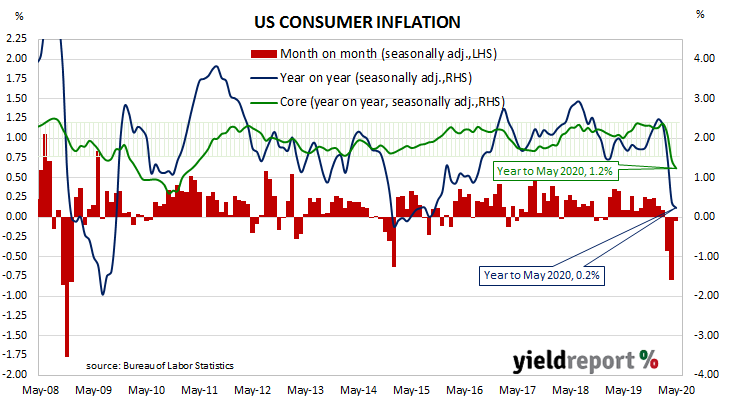
Core inflation, a measure of inflation which strips out the volatile food and energy components of the index, also decreased on a seasonally-adjusted basis by 0.1% for the month. This too was just under the flat result which had been expected but higher than April’s comparable rate of -0.4%. The annual rate slowed from 1.4% in April to 1.2%, seasonally adjusted.
NAB Head of FX Strategy (FICC division) Ray Attrill said, “The deflationary pulse should ease from here, as activity levels pick up, but a large negative output gap should ensure that weak inflation remains an enduring theme.” ANZ economist Daniel Been was a little harder in his view. “Deflationary risks are clear.”
US Treasury bond yields fell noticeably. The 2-year yield shed 3bps to 0.18%, the 10-year yield lost 11bps to 0.72% and the 30-year yield finished 8bps lower at 1.50%.

