News

Household sentiment up; “better times ahead” (eventually)

10 June 2020

Summary: Household sentiment rises for a second consecutive month; back around pre-pandemic levels but pessimists still outnumber optimists; households anticipate better times ahead.


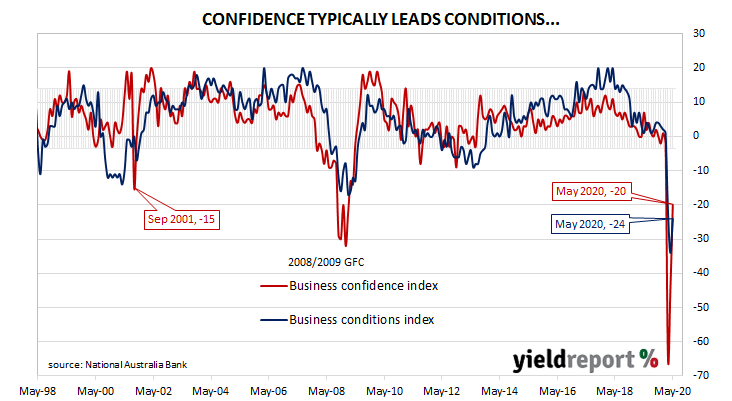
After a lengthy divergence between measures of consumer sentiment and business confidence in Australia which began in 2014, confidence readings of the two sectors converged again around July 2018. Both readings then deteriorated gradually in trend terms, with consumer confidence leading the way. Household sentiment fell off a cliff in April but it then bounced in May.

According to the latest Westpac-Melbourne Institute survey conducted in the first week of June, average household sentiment has continued to recover from the staggering dive which took place in April. The Consumer Sentiment Index rose from 88.1 to 93.7, taking it back to pre-pandemic levels.Household sentiment rises for a second consecutive month; back around pre-COVID levels but pessimists still outnumber optimists; households - Australian consumer sentiment, Westpac-Melbourne Institute survey
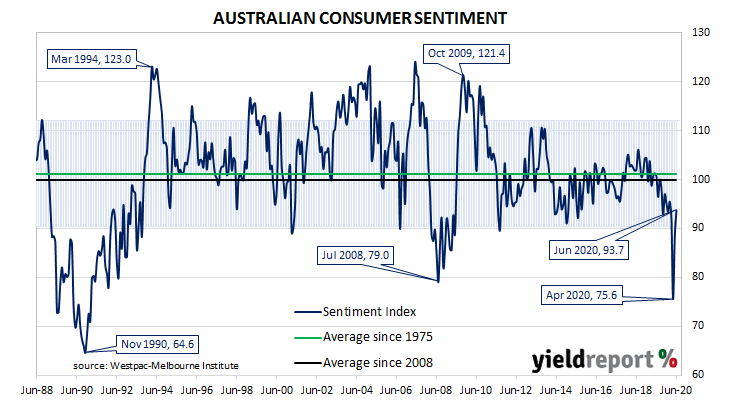
UBS economist George Tharenou said, “With sentiment only moderately below average, it’s historically consistent with modestly positive real consumption growth.”

Any reading below 100 indicates the number of consumers who are pessimistic is greater than the number of consumers who are optimistic. The latest figure is back to the low end of the normal range but it is still noticeably below the long-term average reading of just over 101.

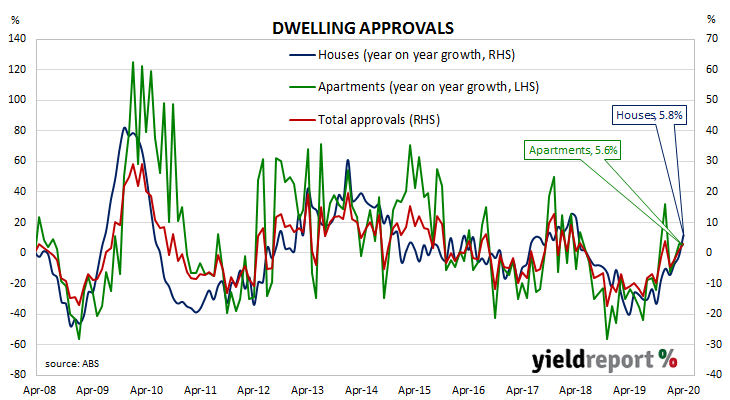
The report came out on the same day as the latest housing finance report. Local Treasury bond yields fell at the long end, broadly following movements in their US Treasury counterparts overnight. By the end of the day, the 3-year ACGB yield was unchanged at 0.28% while the 10-year yield had lost 3bps to 1.01% and the 20-year finished 4bps lower at 1.65%.

In the cash futures market, expectations of a rate cut softened a little for months in the latter part of 2020 and through to late 2021. By the end of the day, July and August contracts implied a rate cut down to zero as 54% and 46% chances respectively, both unchanged from the previous day. September contracts implied a 39% chance of such a move in that month, down from 41%. Contract prices of months in the remainder of 2020 and through to late-2021 implied probabilities ranging between 32% and 45%.

Home loan figures beat expectations; borrowers “unable to transact”

10 June 2020

Summary: Home loan approvals fall in number and value over April; fall not as large as expected; owner-occupier, investor loans both fall in dollar terms; further softness anticipated.


A very clear downtrend was evident in the monthly figures of both the number and value of home loan commitments through late-2017 to mid-2019. Then the RBA reduced its cash rate target in a series of cuts and both the number and value of mortgage approvals began to noticeably increase. Figures from February provided an indication the trend may have finished but the latest figures still do not provide some sort of confirmation.

April’s housing finance figures have been released and the total number of loan commitments (excluding refinancing loans) to owner-occupiers fell by 4.4%. The fall came after a 1.0% decrease in March after revisions. On an annual basis, the growth rate slowed from March’s revised growth rate of +2.5% to -1.2%.

“While this was a smaller drop than expected by us and the market, we expect housing lending to be soft for some time as income pandemic-related disruptions reduce both the borrowing capacity and the risk appetite of households,” said ANZ economist Adelaide Timbrell.

Westpac senior economist Matthew Hassan generally agreed. “Housing finance approvals came in better than expected for April but [they] are showing clearer signs of a turn lower.”Home loan approvals fall in number and value over April; fall not as large as expected; owner-occupier, investor loans both fall in dollar termsThe report came out on the same day as Westpac’s latest Consumer Sentiment Index. Local Treasury bond yields fell at the long end, broadly following movements in their US Treasury counterparts overnight. By the end of the day, the 3-year ACGB yield was unchanged at 0.28% while the 10-year yield had lost 3bps to 1.01% and the 20-year finished 4bps lower at 1.65%.

In the cash futures market, expectations of a rate cut softened a little for months in the latter part of 2020 and through to late 2021. By the end of the day, July and August contracts implied a rate cut down to zero as 54% and 46% chances respectively, both unchanged from the previous day. September contracts implied a 39% chance of such a move in that month, down from 41%. Contract prices of months in the remainder of 2020 and through to late-2021 implied probabilities ranging between 32% and 45%.

US job openings, quits, separations all down in April

09 June 2020

Summary: US quit rate continued to fall; job openings down again; total separations also down; accommodation & food sales continued to be hit hardest; NAB economist says numbers “pre-date” latest job market improvement.


The number of US employees who quit their jobs as a percentage of total employment increased slowly but steadily after the GFC. It peaked in August 2018, stabilised and then remained largely unchanged through the remainder of 2018 before it hit a new peak in July 2019. It then tracked sideways until virus containment measures were introduced in March.

Figures released as part of the most recent JOLTS report show the quit rate has continued to fall. 1.4% of the non-farm workforce left their jobs voluntarily in April, a substantially lower rate than March’s revised figure of 1.8%.US quit rate continued to fall; job openings down again; total separations also down; accommodation & food sales continued to be hit hardest; NAB economist says numbers “pre-date” latest job market improvement.

In a near-repeat of the March report, quit numbers increased in the “Mining & logging” sector but all other sectors experienced declines, with the largest monthly falls coming from the “Accommodation & food services”, Professional and business services” and “Retail trade” sectors. Overall, the total number of quits for the month decreased from March’s revised figure of 2.789 million to 1.786 million.

April’s non-farm payroll report indicated average hourly pay had jumped, possibly the result of fewer lower-paid jobs relative to higher paying ones. The May report saw a fall in average hourly pay from April’s revised figure of USD$30.04 to USD$29.75, with a corresponding fall in the annual growth rate from 8.0% to 6.7%.

Total vacancies at the end of April fell by 965,000, or 16.1%, from March’s revised figure of 6.011 million to 5.046 million, driven by decreases in the “Professional and business services” and “Health care and social assistance” sectors. Reduced openings in the “Retail trade”, “Accommodation and food services” and “Arts, entertainment and recreation” sectors also played significant roles. Overall, 15 out of 19 sectors experienced fewer job openings than in the previous month

Total separations during the same period decreased by 4.755 million from March’s revised figure of 14.643 million to 9.888 million. The fall was overwhelmingly led by the “Accommodation and food services” sector, where there were 3.001 million fewer separations than in March.  However, separations still increased in 7 of the 19 sectors.

Business conditions, confidence improve; still at recession level

09 June 2020

Summary: Business confidence improved for the second consecutive month; conditions up, back to March’s level; capacity usage recovers; capex responses imply expansion plans restrained; confidence currently on par with 1990s recession.


NAB’s business survey indicated Australian business conditions were robust in the first half of 2018, with a cyclical-peak reached in April of that year. Readings from NAB’s conditions index then began to slip and, by the end of 2018, they had dropped to below-average levels. Forecasts of a slowdown in the domestic economy began to emerge in the first half of 2019 and NAB’s business confidence index began trending lower, with the conditions index following. In March 2020, vastly lower readings began to reflect coronavirus containment measures.

 According to NAB’s latest monthly business survey of 400 firms conducted in the latter part of May, business conditions recovered from most of April’s deterioration. NAB’s conditions index registered -24, up from April’s reading of -34.

NAB chief economist Alan Oster said, “Business conditions saw a broad-based improvement in the month but remain deeply negative, at a level last seen coming out of the GFC.” However, he also noted “all industries continue to expect a deterioration in conditions.” Westpac senior economist Andrew Hanlan appeared more optimistic. “Clearly the situation remains fluid and fast moving. The continued easing of restrictions in June will see a further bounce in business conditions.”

Business confidence moved higher for a second consecutive month. NAB’s confidence index rose from April’s revised reading of -45 to -20. Typically, NAB’s confidence index leads the conditions index by approximately one month, although some divergences appear from time to time. NAB’s Oster said confidence “increased further from its low point in March, but remains weak with a current reading last seen around the trough in the 1990s recession.”Business confidence improved for second consecutive month; conditions up, back to March’s level; capacity usage recovers; capex responses imply expansion plans restrained; confidence currently on par with 1990s recession.The figures came out on the same day as ANZ’s latest Job Ads series and Commonwealth bond yields moved lower, although they may have only followed US Treasury movements to some degree. By the end of the day, the 3-year ACGB yield had slipped 1bp to 0.28%, the 10-year yield had lost 7bps to 1.09% while the 20-year yield finished 4bps lower at 1.69%.

In the cash futures market, expectations of a rate cut barely changed. By the end of the day, July contracts implied a rate cut down to zero as a 54% chance, unchanged from the previous day. August contracts implied a 46% chance of such a move in that month, also unchanged. Contract prices of months in the remainder of 2020 and through to late-2021 implied similar probabilities, ranging between 33% and 47%.

May job ads stabilise, rebound expected

09 June 2020

Summary:  Job ads stabilises in May; numbers improved steadily over month; more job losses expected in next Labour Force report; rebound “likely from midyear”.


From mid-2017 onwards, year-on-year growth rates in the total number of Australian job advertisements consistently exceeded 10%. That was until mid-2018 when the annual growth rate fell back markedly. 2019 was notable for its reduced employment advertising, along with a reversal of the gains in 2017 and 2018. Figures from the first quarter of 2020 continued the trend and then April’s numbers set a record of the worst type.

 According to the latest ANZ figures, total advertisements increased by 0.5% in May on a seasonally-adjusted basis. The small gain followed a 53.4% plunge in April and a 10.2% fall in March after revisions. On a 12-month basis, total job advertisements were 59.8% lower than in May of last year, representing a modest improvement from April’s comparable figure of -62.3%.The ANZ report came out on the same day as NAB’s May Business Survey and Commonwealth bond yields moved lower, although they may have only followed US Treasury movements to some degree. By the end of the day, the 3-year ACGB yield had slipped 1bp to 0.28%, the 10-year yield had lost 7bps to 1.09% while the 20-year yield finished 4bps lower at 1.69%.

In the cash futures market, expectations of a rate cut barely changed. By the end of the day, July contracts implied a rate cut down to zero as a 54% chance, unchanged from the previous day. August contracts implied a 46% chance of such a move in that month, also unchanged. Contract prices of months in the remainder of 2020 and through to late-2021 implied similar probabilities, ranging between 33% and 47%.

“Shock” non-farm payrolls report; “permanent unemployment rising”

05 June 2020

Summary: May non-farm payrolls jump; increase confounds expectations; survey responses lower than normal; major bank chief economist says permanent unemployment is rising; large revisions to March, April numbers.


The US economy ceased producing jobs in net terms as infection controls began to be implemented in March. The unemployment rate had been around 3.5% but that changed in March 2020 when job losses began to surge. The latest employment report was expected to indicate further job losses but it has provided a surprise which had analysts questioning the sampling process.

According to the US Bureau of Labor Statistics, the US economy created 2.5 million jobs in the non-farm sector in May. The gain in employment was completely different from the 7.5 million fall which had been expected. Employment figures for March and April were revised down by a total of 642,000.

May’s unemployment rate eased from April’s rate of 14.7% to 13.3%. The total number of unemployed decreased by 2.093 million to 20.985 million while the total number of people who are either employed or looking for work increased by 1.746 million to 158.227 million. The increase in the number of people in the labour force raised the participation rate from April’s revised rate of 60.2% to 60.8%.

Westpac’s Finance AM team said the result “shocked” markets and it “aroused suspicions of large distortions related to COVID, the BLS pointing to those on COVID temporary unemployment not being captured and lower than normal survey responses.”

US Treasury yields increased on the day. By the close of business, the US Treasury 2-year bond yield had crept up 1bp to 0.21%, the 10-year yield had increased by 8bps to 0.90% while the 30-year yield finished 4bps higher at 1.67%.

ANZ Chief Economist Sharon Zollner said, “While it is encouraging that temporary job losses can be reversed so quickly, the data still shows 19.5 million fewer jobs in May than in February and permanent unemployment is rising.”

One figure which is indicative of the “spare capacity” of the US employment market is the employment-to-population ratio. This ratio is simply the number of people in work divided by the total US population. It hit a cyclical-low of 58.2 in October 2010 before slowly recovering to just above 61% in late-2019. May’s reading recovered a little from April’s series low of 51.3% to 52.8%.


April retail numbers dive; reverses all March gain plus more

04 June 2020

Summary: Retail sales slump in April, reversing March’s spike; spending on food drops back below pre-stockpiling level; economists expect better May.


Growth figures of domestic retail sales have been declining since 2014 and they reached a low-point in September 2017 when they registered an annual growth rate of just 1.5%. They then began increasing for about a year, only to stabilise at around 3.0% to 3.5% through late 2018 before trending lower through 2019 and early 2020. March’s figures bucked the trend as households stocked up; April’s numbers totally reversed that.

According to the latest ABS figures, total retail sales dropped by 17.7% in April on a seasonally-adjusted basis. The fall was basically in line with the 18% decrease which had been expected after “flash” figures were released on 20 May but it also more than reversed March’s +8.5%. On an annual basis, retail sales decreased by 9.2%, as compared to March’s comparable figure of 10.1%.

Retail sales have only fallen by more than 2.4% twice since records began in 1982; first in July 2000 due to the introduction of GST and then in April 2020 due to COVID-19 lockdowns,” noted ANZ economist Adelaide Timbrell.

Retail sales slump in April, reversing March’s spike; spending on food drops back below pre-stockpiling level; economists expect better May.

Longer-term Commonwealth bond yields moved higher, largely in line with US Treasury bond movements. By the end of the day, the 3-year ACGB yield remained unchanged at 0.28% while the 10-year yield had gained 6bps to 1.01% and the 20-year yield had increased by 5bps to 1.66%.

In the cash futures market, expectations of a rate cut were largely unchanged. By the end of the day, July contracts implied a rate cut down to zero as a 54% chance, unchanged from the previous day. August contracts implied a 46% chance of such a move in that month, down from 48%. Contract prices of months in the remainder of 2020 and through to the latter part of 2021 implied similar probabilities, ranging between 35% and 47%.

“April undoubtedly marks the worst of the direct impacts from the Coronavirus lockdown, presuming we do not see another flare up in the virus locally,” said Westpac senior economist Matthew Hassan.

Job losses slow in US: ADP

03 June 2020

Summary: Private sector job losses slow in May; still awful but much less than expected; employment numbers hit hardest at large firms; services sector accounts for 70% of losses; official ADP payroll report likely to follow suit at end of week.


The ADP National Employment Report is a monthly report which provides an estimate of US non-farm employment in the private sector. Since the report began to be published in 2006, its employment figures have exhibited a high correlation with official non-farm payroll figures, although a large difference can arise in any individual month. As with April’s report, this latest report highlights the extent to which the US economy is suffering.

The ADP May report indicated private sector employment fell by 2.76 million, much less than the 8 million which had been expected. April’s loss was marginally revised down from 20.2 million to 19.557 million.

“This could point to a shallower-than-anticipated downturn in the labour market, but it is quite another challenge for employment to recover from here,” said ANZ economist John Bromhead.Private sector job losses slow in May; employment numbers hit hardest; services sector accounts for 70% of losses; official ADP payroll report likely to follow suit at end of week.

US Treasury yields rose across the curve, although the increases could be viewed as part of a broader “risk-on” theme taking place in US financial markets. By the close of business, the 2-year Treasury bond yield had gained 4bps to 0.20%, the 10-year yield had increased by 6bps to 0.74% while the 30-year yield finished 4bps higher at 1.53%.

Employment numbers were down across businesses of all sizes but employment at large firms suffered most. Firms with less than 50 employees lost a net 0.435 million positions, mid-sized firms (50-499 employees) shed 0.722 million positions while large businesses (500 or more employees) accounted for 1.604 million fewer jobs.

Approvals numbers beat estimates again, provides “false sense of security”

03 June 2020

Summary: Home approval numbers fall; again, better than expected; house approvals up, apartment approvals down; non-residential approvals down for the third month running.


Approvals for dwellings, that is apartments and houses, had been heading south since mid-2018. As an indicator of investor confidence, falling approvals had presented a worrying signal, not just for the building sector but for the overall economy. However, approval figures from late-2019 and even from recent months have painted a picture of a recovery taking place despite forecasts of a coming slowdown.

 The Australian Bureau of Statistics has released the latest figures from April and total residential approvals decreased by 1.80% on a seasonally-adjusted basis. The fall over the month was nowhere near as bad as the -11% which had been generally expected and it was a smaller fall than March’s 2.6% decline. Total approvals still increased by 5.7% on an annual basis, an improvement from March’s comparable figure of +1.9% after it was revised up from +0.2%.

“Overall, while dwelling approvals have again held up better than expected, they are giving a false sense of security,” said Westpac senior economist Matthew Hassan.Home approval numbers fall; again, better than expected; house approvals up, apartment approvals down; non-residential approvals down for the third month running. The report came out on the same day as the March quarter’s GDP figures and Commonwealth bond yields increased by more than their US Treasury counterparts had in overnight trading. By the end of the day, the 3-year Treasury bond yield had crept up 1bp to 0.28%, 3bps above the RBA’s target rate, while 10-year and 20-year yields had each gained 6bps to 0.95% and 1.61% respectively.

In the cash futures market, expectations of a rate cut hardened a little for contracts through to the end of 2020 but softened for months in 2021. By the end of the day, July contracts implied a rate cut down to zero as a 54% chance, unchanged from the previous day. August contracts implied a 48% chance of such a move in that month, also unchanged. December contracts implied a 42% chance, up from 40%. Prices of contracts during 2021 implied probabilities ranging between 33% and 42%.

Approvals for new houses increased by 3.0% over the month, up from March’s revised figure of -0.2%. On a 12-month basis, house approvals were 5.8% higher than they were in April 2019.

ISM index recovers; supply chain gremlins still at work

01 June 2020

Summary: ISM PMI recovers a little; manufacturing still deep in contraction territory; overall economy barely growing; supply times “flatter” index.

US purchasing managers’ indices (PMIs) have been sliding since August 2018, albeit from elevated levels. After reaching a cyclical peak in September 2017, manufacturing PMI readings went sideways for a year before they started a downtrend. Readings stabilised in late 2019 after a truce of sorts was made with the Chinese regarding trade. However, the March 2020 report implied US manufacturing activity had begun contracting and then April’s report confirmed it.

According to the latest Institute of Supply Management (ISM) survey, its Purchasing Managers Index recorded a reading of 43.1% in May. The result was a little under the expected figure of 43.8% but also a little higher than April’s final reading of 41.5%. The average reading since 1948 is 52.8% and any reading below 50% implies a contraction in the manufacturing sector. However, a reading “above 42.8%, over a period of time, generally indicates an expansion of the overall economy,” according to the ISM.

The ISM’s Tim Fiore said the path of the manufacturing sector’s contraction had “improved”, implying its rate of contraction had lessened. However, he noted it was still at April 2009 levels.ISM PMI recovers a little; manufacturing still deep in contraction territory; overall economy barely growing; supply times “flatter” indexUS Treasury yields increased at the ultra-long end of the curve but barely moved elsewhere. By the end of the day, the 2-year Treasury bond yield had slipped 1bp to 0.15% while the 10-year yield had ticked up 1bp to 0.66% and the 30-year yield finished 4bps higher at 1.45%.

After April’s reading was released, NAB head of FX Strategy within its FICC division Ray Attrill had said the index had been “held up” by a lengthier-than-usual supplier delivery times which he analysed as a product of “disrupted supply chains…” rather than a sign of demand outstripping supply. He noted this influence on the index again, saying the index reading “was once again flattered by the strength of the supplier deliveries sub-index…”

Click for more news