30 April 2020
The pace of lending to the non-bank private sector by financial institutions in Australia has been trending down since October 2015. Private sector credit growth appeared to have stabilised in the September quarter of 2018 but the annual growth rate then continued to deteriorate through 2019.
While senior RBA officials would like business lending to increase, those same officials would also like households to reduce debt. In early 2020, RBA Governor Philip Lowe publicly stated the cash rate had been reduced in part to assist households in this objective. However, the likelihood of either has been greatly reduced by recent events.
According to the latest RBA figures, private sector credit grew by +1.1% in March, well above the +0.3% increase which had been expected and well above February’s +0.4% increase. The annual growth rate moved higher, from February’s revised annual rate of 2.7% to 3.6%.
The increase over the month was overwhelmingly driven by business lending. Lending to owner-occupiers rose modestly while lending to real estate investors and for personal purposes declined.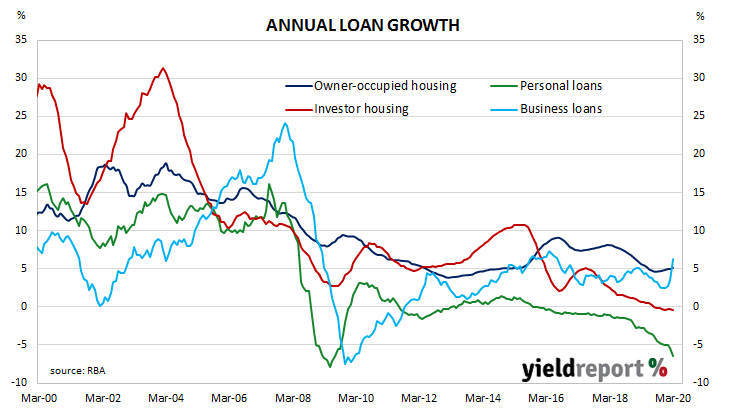 ANZ economist Hayden Dimes said, “The strong growth was driven by business credit, which rose 2.9%. You have to go back over 30 years to 1988 to see a stronger monthly figure for business credit.”
Local Treasury bonds yields remained stable to a certain degree. By the end of the Australian trading day, the 3-year Treasury bond yield remained unchanged at 0.25%, the 10-year yield had lost 3bps to 0.89% and the 20-year yield finished unchanged at 1.51%.
In the cash futures market, expectations of a rate cut continued to harden. At the close of business, May contracts implied a rate cut down to zero as a 64% chance, up a little from the previous day. June contracts implied a 58% chance of such a move, unchanged, while July contracts implied a 70% chance, up from 67%. Contract prices of months in the remainder of 2020 and through to mid-2021 implied similar probabilities, ranging between 50% and 65%.
29 April 2020
US GDP growth slowed in the second quarter of 2019 before stabilising at about 0.5% per quarter. At the same time, US bond yields suggested future growth rates would be below trend. The US Fed agreed and it reduced its federal funds range three times in the second half of 2019 as a form of insurance against a softening economy. However, the Fed’s actions at the time did not take into account the restrictions which would be placed on US residents in response to the COVID-19 pandemic. These restrictions began to bite in March 2020 and US economic activity consequently seized up.
The US Commerce Department has just released March quarter “advance” GDP estimates and they indicate the US economy contracted by 1.2% for the quarter or at an annualised growth rate of 4.8%. The figure was lower than the -1.0% (-4.0% annualised) which had been expected and it represented a sharp reversal from the December quarter’s final figure of 0.5%.
NAB economist Tapas Strickland said, “Of course, the worst is yet to come with expectations that Q2 GDP might fall by around 30-40% annualised.”

US GDP numbers are published in a manner which is different to most other countries; quarterly figures are compounded to give an annualised figure. In countries such as Australia and the UK, an annual figure is calculated by taking the latest number and comparing it with the figure from the same period in the previous year. The diagram above shows US GDP once it has been expressed in the normal manner, as well as the annualised figure.
29 April 2020
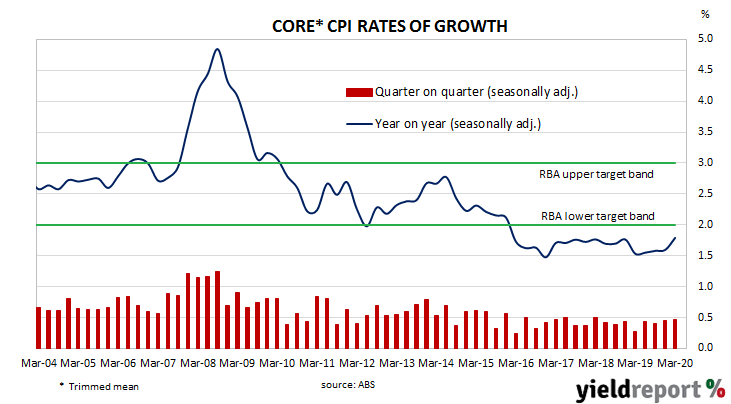
In the early 1990s, entrenched inflation in Australia was broken by the “recession we had to have”, as it became known. Since then, core consumer price inflation has averaged around 2.6% which, coincidentally, is almost the midpoint of the RBA’s target range of 2%-3%. In recent years, various measures of consumer inflation have been in a down-trend despite attempts by the RBA to increase them through historically low cash rates.
Consumer price indices from the March quarter have now been released by the ABS and both the headline and seasonally-adjusted figures exceeded market expectations for a second consecutive quarter. The headline inflation rate came in at +0.3% for the quarter, down from the December quarter’s +0.7% while the seasonally-adjusted inflation rate slowed from +0.6% to +0.4%. On a 12-month basis, both headline and seasonally-adjusted inflation registered 2.2%, both having recorded 1.8% growth rates in the December quarter.
The RBA’s preferred measure of core inflation, the “trimmed mean”, remained unchanged from December’s value on a quarterly basis after revisions, while it increased on an annual basis. The trimmed mean inflation rate for the March quarter was +0.5%, higher than the +0.3% which had been the market’s expected figure. The 12-month growth rate increased from 1.6% to 1.8%.
Commonwealth Government bond yields were largely unchanged, ignoring modestly lower US Treasury yields in overnight trading. By the end of the day, the 3-year ACGB yield had slipped 1bp to 0.25% while 10-year and 20-year yields finished unchanged at 0.92% and 1.51% respectively.
In the cash futures market, expectations of a rate cut firmed slightly. At the close of business, May contracts implied a rate cut down to zero as a 62% chance, unchanged from the previous day. June contracts implied a 58% chance of such a move, up from 56% while July contracts implied a 67% chance, up from 65%. Contract prices of months in the remainder of 2020 and through to mid-2021 implied similar probabilities, ranging between 43% and 65%.
28 April 2020
US consumer confidence collapsed in late 2007 as the US housing bubble burst and the US economy went into recession. By 2016, it had clawed its way back to neutral and then went from strength to strength until late 2018. Measures of consumer confidence then oscillated within a fairly narrow band at historically high levels until March 2020.
The latest Conference Board survey held during the first half of April indicates US consumer confidence has nosedived after deteriorating significantly in March. April’s Consumer Confidence Index registered 86.9, below the median consensus figure of 90 and substantially below March’s final figure of 118.8. Compared to consumers’ views held at the time of the March survey, their views of present conditions collapsed while their views of future conditions actually improved a little.
A month ago, Lynn Franco, a senior director at the Conference Board had said March’s fall was “more in line with a severe contraction, rather than a temporary shock”. This month’s drop prompted her to say the record fall in the Present Situation sub-index “reflects the sharp contraction in economic activity and surge in unemployment claims brought about by the COVID-19 crisis.”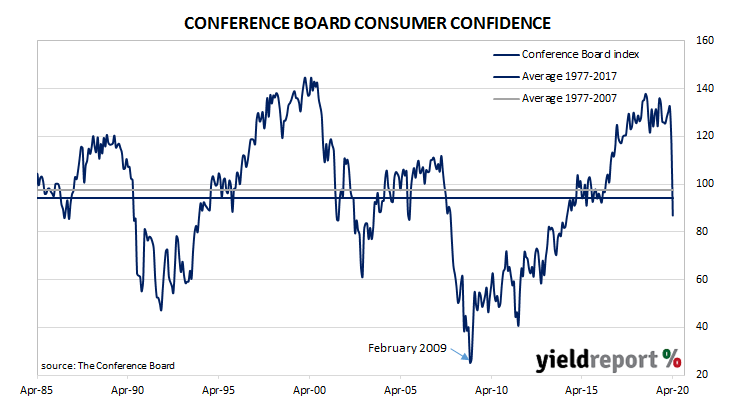
US Treasury markets reacted by sending longer-term yields higher. By the end of the day, the yield on 2-year Treasury bonds had slipped 1bp to 0.22% while the 10-year yield had gained 5bps to 0.66% and the 30-year yield had increased by 8bps to 1.26%.
In terms of US Fed policy, a rate change of any sort remained unlikely given the federal funds rate has been at the effective lower bound since the US Fed reduced it on Sunday 15 March. Contract prices out to March 2021 imply traders expect no change in the federal funds rate over the next 12 months.
24 April 2020
As with other surveys which produce an index, the ifo Institute’s business climate index is a composite index which combines German companies’ views of current conditions with their outlook for the next six months. It has similarities to consumer sentiment indices in the US and the business surveys in the EU.
According to the latest figures released by ifo, its business climate index “crashed” to 74.3 in April, lower than the expected reading of 80 and a severe deterioration from March’s 85.9. The average reading since January 2005 is just above 97 and the latest reading is the lowest on record.
Clemens Fuest, the president of the ifo Institute described sentiment at German companies as “catastrophic”. He went on to say, “This is the lowest value ever recorded and never before has the index fallen so drastically.”
Following a recession in 2009/2010, the index largely ignored the debt-crisis of 2010-2012 which flowed from it, remaining at average to elevated levels through to early-2020. Its relationship with euro-zone GDP growth is shown below.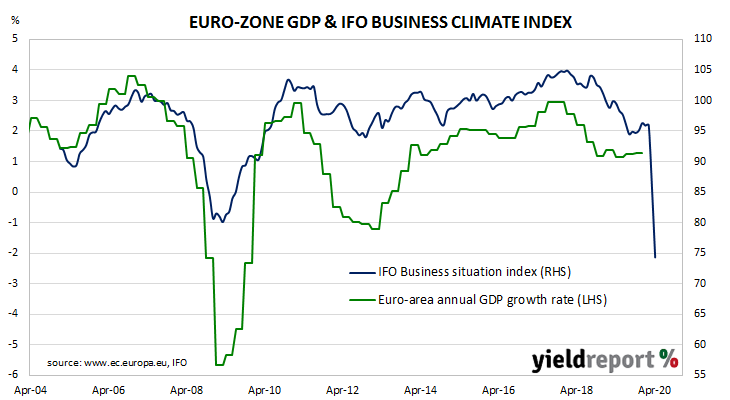
22 April 2020
EU consumer confidence plunged during the GFC and again in 2011/12 during the European debt crisis. Since early 2014, it has been at average or above-average levels, rising to a cyclical peak at the beginning of 2018. Even after it dropped back significantly in late 2018, the index remained at a level which corresponds to significant optimism among households. After a substantial drop in March, the latest reading indicates March’s fall has accelerated in April.
The April survey conducted by the European Commission indicated household confidence collapsed to a level commensurate with readings during the 2011/12 debt crisis. The latest published reading of its Consumer Confidence index recorded a figure of -22.7, below the -17.5 which had been expected and considerably lower than March’s final figure of -11.6. The average reading since the beginning of 1985 has been -11.6.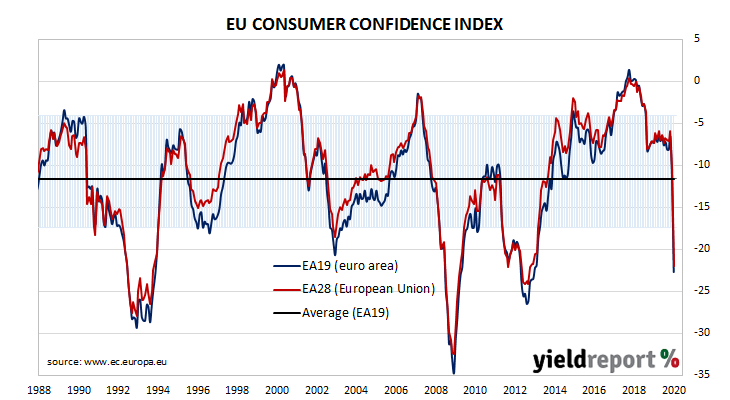
The report came out on the same day as Brent crude pushed back above USD$20 per barrel and confidence of a new EU spending package built. By the end of the day, yields on German 10 year bunds had gained 7bps to -0.41% while French 10-year OATs had increased by 5bps to 0.12%.
22 April 2020
Westpac and the Melbourne Institute describe their Leading Index as a composite measure which attempts to estimate the likely pace of Australian economic activity over the next three to six months. After reaching a peak in early 2018, the index trended lower through 2018, 2019 and the early months of 2020. In light of the mothballing of various sectors of the economy and restrictions on individuals’ movements, a sharp drop was expected in March.
The latest six months annualised growth rate of the indicator has fallen from February’s revised figure of –0.97% to -2.47% in March. After a brief improvement at the end of 2019, the index deteriorated in both January and February before the plunge in March.
Westpac chief economist Bill Evans said, “The sharply weaker signal is consistent with a deepening economic impact from the coronavirus pandemic. The Leading Index growth rate in March is the most negative seen since the Global Financial Crisis.”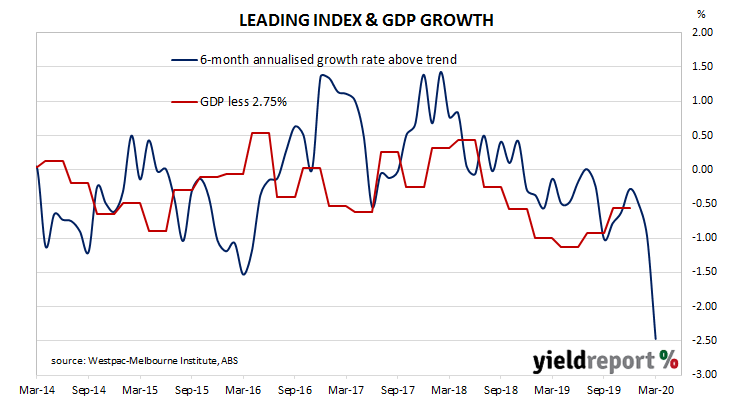
Index figures represent rates relative to trend-GDP growth, which is generally thought to be around 2.75% per annum. The index is said to lead GDP by three to six months, so theoretically the current reading represents an annualised GDP growth rate of around 0.25% in the third quarter of 2020.
Commonwealth Government bond yields finished moderately lower, largely in line with falls in US markets overnight. By the end of the day, the 3-year ACGB yield had slipped 1bp to 0.25%, the 10-year yield had lost 2bps to 0.83% while the 20-year yield finished 4bps lower at 1.46%.
21 April 2020
The Reserve Bank of Australia left the official cash rate target at 0.25% at its April meeting, having made two 25bps cuts during March. The minutes of the special meeting of the RBA Board on 19 March had stated members had agreed “the cash rate was now at its effective lower bound” gave weight to the idea there would be no more rate cuts in this cycle.
The minutes of April’s meeting has now been released and the board’s deliberations again focussed on the coronavirus pandemic, the subsequent responses of central banks and governments, as well as the outcomes these responses achieved.
“Central banks had responded forcefully with a wide range of policy measures. In response to these measures and sizeable responses from fiscal authorities, financial conditions had stabilised but remained fragile.”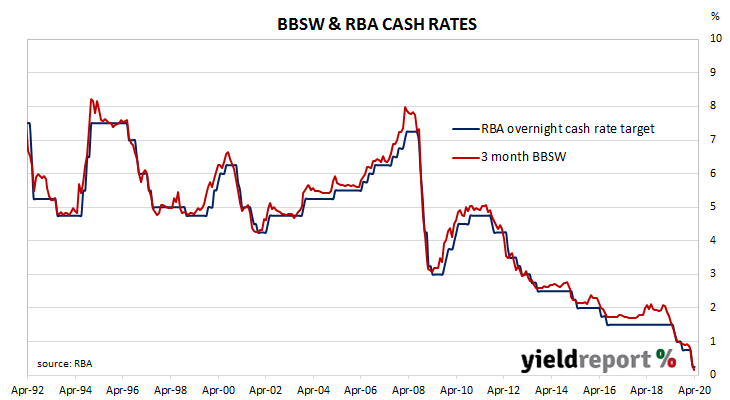 Again, all sections of the minutes referred to the economic impact of the coronavirus.
A considerable amount of the minutes was devoted to discussions regarding the RBA’s recent policy measures and the responses of financial markets to those measures.
Those measures included the latest rate cut, the effective fixing of the yield on 3-year Commonwealth Government bonds at 0.25%, the support of Commonwealth and state government bond prices through purchases by the Bank as well as the provision of a term funding facility for authorised deposit-taking institutions (ADIs) which would offer collateralised funding of at least $90 billion for three years at a 0.25% interest rate. In addition, exchange settlement balances at the RBA would attract a 0.10% interest rate instead of a zero interest rate.
According to the RBA, these efforts “had helped to lower funding costs, “stabilise financial conditions” and “support the expected recovery”. The Bank’s policies had also eased stresses in the secondary markets for Commonwealth Government and state government bonds.
Tellingly, the RBA minutes stated the “Bank would continue to do what was necessary to achieve the three-year yield target, with the target expected to remain in place until progress was being made towards its goals for full employment and inflation.” However, the minutes also stated “if conditions continued to improve, it was likely that smaller and less frequent purchases of government bonds would be required.”
21 April 2020
The ABS has released its inaugural payrolls report containing new statistics on jobs and wages based on Single Touch Payroll data provided by the ATO. According to the ABS, “the estimates provide additional information on the economic impact of COVID-19 and complement monthly Labour Force statistics.”
Between the week ending 14 March and the week ending 4 April, the total number of work positions in Australia decreased by 6.0%. Total wages fell by 6.7% over the same period.
Most of the losses were in the week ending 4 April. Total jobs fell by 5.5% in that week alone, a large fall from the 0.5% fall in the week ending 28 March. Work in accommodation, restaurants, cafes, entertainment and recreation services was particularly hard-hit.
Chris Read, Morgan Stanley Australia’s equity strategist, noted the figures did not directly translate into additional unemployed persons but, if they had, “…a similar decline would imply an employment reduction of 780,000 workers. If all of these people were to stay in the labour force…this would imply the unemployment rate increasing from 5.2% to 10.3%.”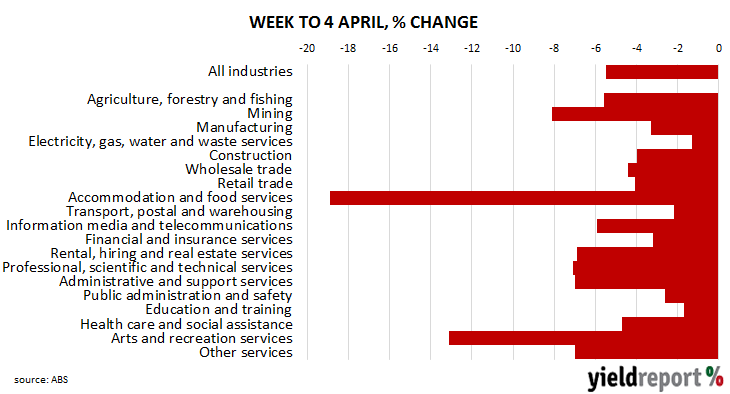
The figures came out on the same day as the release of the RBA’s April minutes and domestic Treasury bond yields moved in a somewhat haphazard fashion, taking little notice of moderate falls in US Treasury bond yields overnight. By the end of the day, 90-day bank bills and the 3-year ACGB yield were both unchanged at 0.13% and 0.26% respectively while the 10-year yield finished 2bps higher at 0.85% and the 20-year yield finished 1bp lower at 1.50%.
17 April 2020
The Conference Board Leading Economic Index (LEI) is a composite index composed of ten sub-indices which are thought to be sensitive to changes in the US economy. The Conference Board describes it as an index which attempts to signal peaks and troughs, as turning points in the index have historically occurred prior to changes in aggregate economic activity. While readings from the first two months of 2020 appeared to have represented a break from the downtrend of the second half of 2019, the latest report confirms those numbers to be merely aberrations.
The LEI dropped by 6.7% in March, slightly above the 7.0% fall which had been expected but a massive change from February’s -0.2% after the previous month’s figure was revised down from +0.1%. On an annual basis, the LEI slowed from February’s revised growth rate of 0.2% to -6.8% in March.
“The sharp drop in the LEI reflects the sudden halting in business activity as a result of the global pandemic and suggests the US economy will be facing a very deep contraction,” said Ataman Ozyildirim, Senior Director of Economic Research at The Conference Board.
Changes over time can be large but once they are standardised, a clearer relationship with GDP emerges. The latest reading implies a year-on-year growth rate of -0.75% at the end of the September 2020 quarter.
US Treasury bond yields at the short end finished a little lower while yields further out along the curve increased. By the end of the day, the 2-year Treasury bond yield had lost 2bps to 0.19%, the 10-year yield had gained 2bps to 0.64% while the 30-year yield finished 5bps higher at 1.27%.

