News

EU industrial production extends decline

16 April 2020

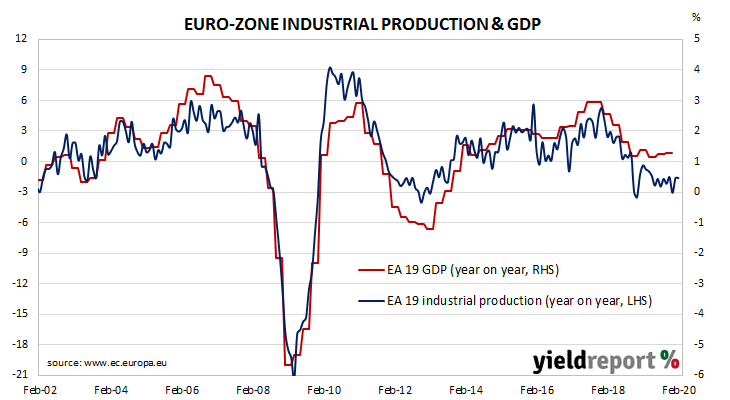
As with other countries’ measures of industrial production, Eurostat’s industrial production index measures the output and activity of industrial sectors in euro-zone countries in aggregate. Following a recession in 2009/2010 and the debt-crisis of 2010-2012 which flowed from it, euro-zone industrial production recovered and then reached a peak four years later in early-2016. Growth rates then fell and recovered through 2016/2017 before beginning a steady and persistent slowdown.

According to the latest figures released by Eurostat, euro-zone industrial production declined by a seasonally-adjusted 0.1% in February, lower than the flat result which had been expected and a significant turnaround from January’s +2.3%. On an annual basis, seasonally-adjusted growth in industrial production remained at January’s revised rate of -1.6%*.

Industrial production increased in the two largest economies of the euro-zone. Germany’s industrial production increased by 0.5% while France’s comparable rate was +0.9%. However, other large economies in the euro-zone, such as Spain and Italy, experienced contractions. Spain’s industrial production shrank by 0.3% and Italy’s shrank by 0.5%.

“Largest fall since 1946”; US production slumps

15 April 2020

The Federal Reserve’s industrial production (IP) index measures real output from manufacturing, mining, electricity and gas company facilities located in the United States. These sectors are thought to be sensitive to consumer demand and so some leading indicators of GDP use industrial production figures as a component. Figures from early-2020 had been suggestive of a possible end to a downtrend which began in late-2018 but such hopes are now fanciful.

According to March figures, US industrial production contracted by 5.4%, worse than the +4.1% decrease which had been expected and a large turnaround from February’s revised figure of +0.5%. On an annual basis, the growth rate slowed from February’s figure of 0.00% to -5.5%.

ANZ economist Daniel Been noted the month’s fall was the “largest fall since 1946…Motor vehicle production slumped 28% due to both supply chain disruptions and reduced demand.”The report came on the same day as March’s retail sales figures were released and bond yields fell significantly at the long end. By the close of trade, the 2-year Treasury yield had added 2bps to 0.23%, the 10-year had lost 11bps to 0.64% and the 30-year yield finished 13bps lower at 1.27%.

Food “only positive” as US retail figures tumble

15 April 2020

US retail sales had been trending up since late 2015 but, beginning in late 2018, a series of weak or negative monthly results led to a drop-off in the annual growth rate which brought the annual rate below 2.0% by the end of that year. Growth rates then increased in trend terms through 2019 and into early 2020, until restrictions on American households began to take effect.

According to the latest “advance” sales numbers released by the US Census Bureau, total retail sales contracted by 8.7% in March, well under the -6.4% which had been expected and a dramatic fall from less than February’s revised figure of -0.4%. On an annual basis, the growth rate fell to -6.2% from February’s revised rate of 4.6%.

National Australia Bank senior markets strategist Gavin Friend said, “The only positive take-out was the control measure of retail sales that feeds into GDP increasing, as panic buying saw a 25% increase in food sales.”The report came on the same day as March’s industrial production numbers were released and bond yields fell significantly at the long end. By the close of trade, the 2-year Treasury yield had added 2bps to 0.23%, the 10-year had lost 11bps to 0.64% and the 30-year yield finished 13bps lower at 1.27%.

In terms of US Fed policy, a rate change of any sort remained unlikely given the federal funds rate has been at the effective lower bound since the US Fed made two emergency cuts in March.

“Single biggest monthly decline” in household sentiment

15 April 2020

After a lengthy divergence between measures of consumer sentiment and business confidence in Australia which began in 2014, confidence readings of the two sectors converged again around July 2018. Since then, both readings have deteriorated gradually, with consumer confidence leading the way. However, their respective paths have both fallen over a cliff in the last month and worse is expected as 2020 unfolds.

According to the latest Westpac-Melbourne Institute survey conducted in the second week of April, average household optimism dived after a modest decline in March. The Consumer Sentiment Index dropped from 91.9 to 75.6, its lowest reading since the 1990/1991 recession.

Any reading below 100 indicates the number of consumers who are pessimistic is greater than the number of consumers who are optimistic. The latest figure is well below the low end of the normal range and well below the long-term average reading of just over 101.

Westpac chief economist Bill Evans said, “This is the single biggest monthly decline in the forty seven year history of the survey, taking the Index beyond GFC lows to levels only seen during the deep recessions of the early 1990s and early 1980s.”

Local Treasury bond yields were largely unchanged, ignoring small falls offshore in overnight trading. By the end of the day, the 3-year ACGB yield had inched up 1bp to 0.28%, the 10-year yield had slipped 1bp to 0.92% while the 20-year yield finished unchanged at 1.63%.

Business conditions plummet, confidence readings in freefall

14 April 2020

NAB’s business survey indicated Australian business conditions were robust in the first half of 2018, with a cyclical-peak reached in April of that year. Readings from NAB’s conditions index then began to slip and, by the end of 2018, they had dropped to below-average levels. Forecasts of a slowdown in the domestic economy began to emerge in the first half of 2019 and NAB’s business confidence index began trending lower, with the conditions index following. In February 2020, readings began to be affected by increased reportage of the newly designated COVID-19.

According to NAB’s latest monthly business survey of 400 firms conducted in the last week of March, business conditions plummeted. The NAB’s conditions index has registered -21, down from February’s revised reading of 0.

Business confidence went into freefall. NAB’s confidence index fell from February’s revised reading of -2 to -66, “its largest decline on record.” Typically, NAB’s confidence index leads the conditions index by approximately one month, although some divergences appear from time to time.

“The impact on the business sector of coronavirus containment measures has been immediately obvious,” said NAB chief economist Alan Oster. Westpac senior economist Andrew Hanlan said the survey “provided further confirmation that the COVID-19 medical crisis is also an economic crisis.”Business conditions

US Treasury bond yields had slipped a little in overnight trading and local Treasury yields had a fairly quiet day. By the end of it, the 3-year ACGB yield had slipped 1bp to 0.27%, the 10-year yield remained unchanged at 0.92% while the 20-year yield finished 3bps higher at 1.63%.

Prices of cash futures contracts barely moved. By the end of the day, May contracts implied a rate cut down to zero as a 48% chance, unchanged from the previous day. June contracts implied a 41% chance of such a move, also unchanged. Another rate reduction was not seen as being any more likely in later months of 2020; December contracts implied a 44% chance of a rate cut down to zero.

ANZ senior economist Catherine Birch noted the conditions index had breached the previous record monthly low of -17 recorded in February 2009. However, she also pointed out “this is not as weak as during the 1990s recession, when quarterly business conditions neared -40” on a quarterly basis.

US CPI figures dive; pandemic a “deflationary economic force”

10 April 2020

The annual rate of US inflation as measured by changes in the consumer price index (CPI) halved from nearly 3% in the period from July 2018 to February 2019. It then fluctuated in a range from 1.5% to 2.0% through 2019 before rising above 2.0% in the final months of that year. “Headline” inflation is known to be volatile and so references are often made to “core” inflation for analytical purposes. This measure has mostly ranged between 1.7% and 2.3% in recent years. Lower figures are now expected from both measures as 2020 unfolds.

 The latest CPI figures released by the Bureau of Labor Statistics indicated seasonally-adjusted consumer prices decreased by 0.4% on average in March, a lower figure than the 0.3% fall which had been expected and a reversal from February’s +0.1%. On a 12-month basis, the inflation rate slowed from February’s annual rate of 2.3% to 1.5%.Core inflation, a measure of inflation which strips out the volatile food and energy components of the index, decreased on a seasonally-adjusted basis by 0.1% for the month, below the +0.1% increase which had been generally expected and less than February’s +0.2% increase. The annual rate slowed from February’s 2.4% to 2.1% in March.

A month ago, ANZ FX strategist John Bromhead had said “a potentially large deflationary shock hangs over us.” After the latest figures were released, NAB Head of FX Strategy Ray Attrill firmed up this view. “Notwithstanding all manner of measurement challenges with inflation data, given some services simply aren’t being produced…the US numbers are telling us that, for now, the pandemic is a disinflationary, if not outright deflationary, economic force.”

 US Treasury bond markets were closed. 2-year, 10-year and 30-year Treasury yields remained unchanged at 0.22%, 0.73% and 1.22% respectively.

US consumer sentiment plunges; “longer, deeper recession” expected

09 April 2020

US consumer confidence started 2019 at well-above-average levels in a longer-term context, although readings were markedly lower than those which had been typical of most of the previous year. During the rest of 2019, US households maintained historically-high levels of confidence except for two short-lived dives. 2020 started reasonably well but the remainder of the year is expected to be quite different.

The latest survey conducted by the University of Michigan indicates the average confidence level of US households has plunged. The University’s preliminary reading from its Index of Consumer Sentiment registered 71.0 in April, a massive 18.1 points lower than March’s final figure of 89.1.

The University’s Surveys of Consumers chief economist, Richard Curtin, had a warning for households. “Consumers need to be prepared for a longer and deeper recession rather than the now-discredited message that pent-up demand will spark a quick, robust and sustained economic recovery.”US consumer sentiment

US Treasury bond yields finished a little lower. By the end of the day, the US 2-year Treasury yield had shed 3bps to 0.22%, the 10-year yield lost 4bps to 0.73% and the 30-year yield finished 4bps lower at 1.35%.

Expectations of any change in the federal funds rate over the next 12 months remained negligible. According to end-of-day prices of federal funds futures, the implied probability of the federal funds range changing from 0%-0.25% remained at 0%.[

US producer figures continue fall

09 April 2020

Around the end of 2018, the annual inflation rate of the US producer price index (PPI) began a downtrend which then continued through 2019. Months in which prices received by producers increased suggested the trend may have been coming to an end, only for it to continue. In the current climate, it is reasonable to expect the downtrend to be maintained.

 The figures from March have been published by the Bureau of Labor Statistics and they indicate producer prices fell by 0.2% after seasonal adjustments, higher than -0.3% which had been generally expected and more than February’s revised 0.6% fall. On a 12-month basis, the rate of producer price inflation after seasonal adjustments slowed to 0.7% after recording 1.3% in February and 2.1% in January.US producer price index

“Core” PPI inflation increased by 0.2%, a turnaround from February’s 0.3% fall. Its annual rate ticked up from 1.3% to 1.4%.

US Treasury bond yields finished a little lower. By the end of the day, the US 2-year Treasury yield had shed 3bps to 0.22%, the 10-year yield lost 4bps to 0.73% and the 30-year yield finished 4bps lower at 1.35%.

Expectations of any change in the federal funds rate over the next 12 months remained negligible. According to end-of-day prices of federal funds futures, the implied probability of the federal funds range changing from 0%-0.25% remained at 0%.

US job openings, quits fall but “whole different story” to come

07 April 2020

The number of US employees who quit their jobs as a percentage of total employment increased slowly but steadily after the GFC. It peaked in August 2018, stabilised and then remained largely unchanged through the remainder of 2018 before it hit a new peak in July 2019 and then tracked sideways.

Figures released as part of the most recent JOLTS report show the quit rate has been maintained at just under the record levels reached in July 2019. 2.3% of the non-farm workforce left their jobs voluntarily in February, the same rate as January’s revised figure of 2.3% and the same rate as in pretty much all of 2019.

Quit numbers were highest in the “Other Services” sector while the “Professional/business services”, “Accommodation & food services” and “Other services” sectors recorded the largest falls. Overall, the total number of quits for the month decreased from January’s revised figure of 3.574 million to 3.497 million in February.

Total vacancies during February fell by 130,000 from January’s revised figure of 7.012 million to 6.882 million, driven by increases in the “Other Services” and “Retail trade” sectors. Unlike the previous month’s report, slightly more sectors experienced a contraction in vacancies than the number of sectors which expanded. Overall, 11 out of 19 sectors experienced fewer job openings than in the previous month.

National Australia Bank Head of FX Strategy Ray Attrill noted job openings had fallen by less than expected “but this will be a whole different story in March.”

Feb lending data “early sign of turning point”

07 April 2020

A very clear downtrend was evident in the monthly figures of both the number and value of home loan commitments through late-2017 to mid-2019. Then the RBA began to reduce its cash rate target in a series of cuts and both the number and value of mortgage approvals began to noticeably increase. The latest report has provided figures which indicate that trend is probably over.

February’s housing finance figures have now been released and the total number of loan commitments (excluding refinancing loans) to owner-occupiers fell by 2.0%, a turnaround from January’s revised figure of +1.5%. On an annual basis, the growth rate slowed from January’s revised figure of +3.7% to +1.0%.

ANZ economist Adelaide Timbrell said, “The outlook for housing finance and prices is very different than it was at the start of the year.”Local Treasury bond yields finished largely unchanged, ignoring modest increases in US Treasury yields in overnight trading. By the end of the day, 3-year and 10-year ACGB yields both finished unchanged at 0.25% and 0.91% respectively while the 20-year yield finished just 1bp higher at 1.61%.

Prices of cash futures contracts were also largely unmoved. By the end of the day, May contracts implied a rate cut down to zero as a 45% chance, down from the previous day’s 48%. June contracts implied a 41% chance of such a move, the same likelihood as the previous day. Another rate reduction was not seen as being any more likely in later months of 2020; December contracts implied a 47% chance of a rate cut down to zero.

Click for more news