07 April 2020
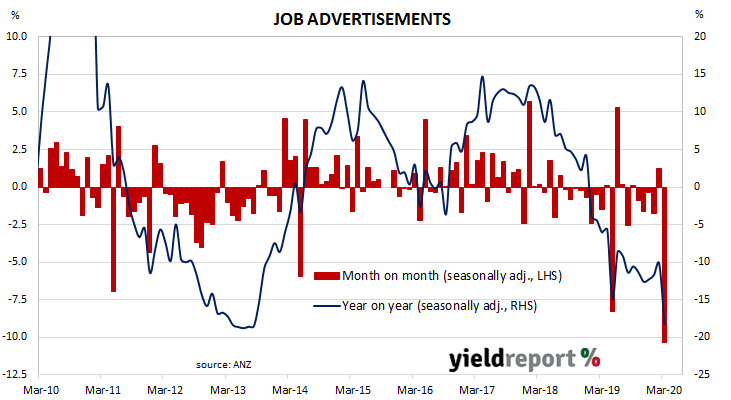
From mid-2017 onwards, year-on-year growth rates in the total number of Australian job advertisements consistently exceeded 10%. That was until mid-2018 when the annual growth rate fell back markedly. 2019 was notable for its reduced employment advertising, along with a reversal of the gains in 2017 and 2018. The first two surveys of 2020 provided modest increases but the latest report is undoubtedly a sign of things to come.
According to the latest ANZ figures, total advertisements fell by 10.3% in March on a seasonally-adjusted basis, following a 1.2% rise in February after that month’s figures were revised up. On a 12-month basis, total job advertisements were 18.2% lower than in March of last year, a large deterioration from February’s comparable figure of -10.2%.
ANZ senior economist Catherine Birch said, “Most of the fall occurred over the second half of March as Australian COVID-19 cases escalated, restrictions on movement tightened and shutdowns of non-essential services broadened.”
 Domestic bond yields rose markedly at the long end following a “risk-on” theme present in offshore markets and large rises in the afternoon after the RBA’s April monetary policy statement. By the end of the day, 3-year ACGB yields remained unchanged at 0.25%, fixed by the RBA, while the 10-year yield had jumped by 15bps to 0.91% and the 20-year yield finished 16bps higher at 1.60%.
Prices of cash futures contracts moved to reflect a slight softening of rate-cut expectations, although the RBA’s latest rate cut to 0.25% has almost ruled out further rate cuts, with members of the RBA Board having agreed after the previous rate cut “the cash rate was now at its effective lower bound.” By the end of the day, May contracts implied a rate cut down to zero as a 48% chance, down from the previous day’s 52%. June contracts implied a 41% chance of such a move, down from 45%. Another rate reduction was not seen as being any more likely in later months of 2020; December contracts implied a 44% chance of a rate cut down to zero.
06 April 2020
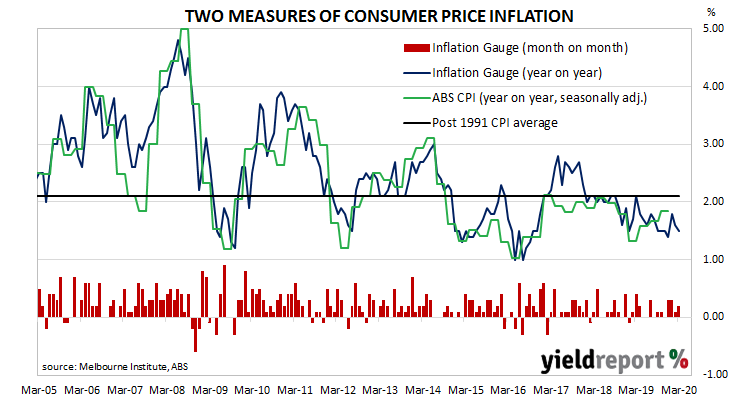
The RBA’s stated objective is to achieve an inflation rate of between 2% and 3%, “on average, over time.” Since the GFC, Australia’s inflation rate has been trending lower and lower and it has been below the RBA’s target band for some years now. Despite the RBA’s desire for a higher inflation rate, attempts to accelerate inflation through record-low interest rates have failed to date.
The Melbourne Institute’s latest Inflation Gauge index increased by 0.2% through March following a 0.1% increase in February and +0.3% in January. On an annual basis, the index increased by 1.5%, down from February’s comparable rate of 1.6%.
Domestic bond yields generally moved a touch higher. By the end of the day, 3-year and 10-year ACGB yields had each inched 1bp higher to 0.25% and 0.76% respectively while the 20-year yield finished 3bps higher at 1.44%.
Prices of cash futures contracts hardly moved. By the end of the day, April contracts implied a rate cut down to zero as a 57% chance, up from the previous day’s 55%. May contracts implied a 52% chance of such a move in that month, the same likelihood as at the end of the previous day. Another rate reduction was not seen as being any more likely in later months of 2020; December contracts implied a 49% chance of a rate cut down to zero.
The Melbourne Institute’s Inflation Gauge is an attempt to replicate the ABS consumer price index (CPI) on a monthly basis. It has turned out to be a reliable leading indicator of the CPI, although there are periods in which the Inflation Gauge and the CPI have diverged for as long as twelve months. On average, the Inflation Gauge’s annual rate tends to overestimate changes in CPI inflation by an average of about 0.1%.
03 April 2020
The US economy has ceased producing jobs in net terms as infection controls began to be implemented and commerce slowed dramatically. The US unemployment rate had been around 3.5% since September 2019, with around 1.5 million positions created on a rolling annual basis. However, the latest employment report indicates the US economy has begun a period of significant job losses.
According to the US Bureau of Labor Statistics, the US economy lost a massive 701,000 jobs in the non-farm sector in March, a much-greater fall than the 61,000 contraction which had been the median expectation and a considerable turnaround from February’s 275,000 gain after revisions. Employment figures for January and February were revised down by a total of -57,000.
March’s unemployment rate jumped up from February’s rate of 3.5% to 4.4%. The total number of unemployed expanded by 1.353 million to 7.140 million while the total number of people who are either employed or looking for work decreased by 2.987 million to 162.912 million. The fall in the number of people in the labour force noticeably lowered the participation rate from 63.4% to 62.7%.
ANZ economist Adelaide Timbrell noted “much worse is to come as the lockdowns intensified after the survey week [which] ended 14 March.”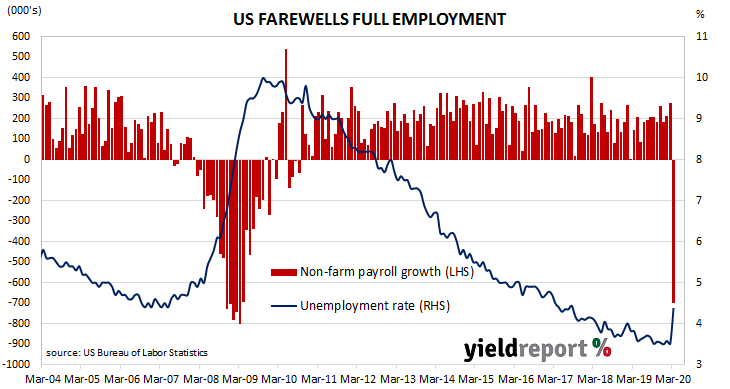 US Treasury yields fell modestly on the day. By the close of business, US Treasury 2-year and 10-year bond yields had each slipped 1bp to 0.22% and 0.60% respectively while the 30-year Treasury yield lost 4bps to 1.22%.
The ANZ economist noted a large proportion of March’s job losses were in the hospitality and leisure sectors. She expects other sectors to be hit in April. “As the lockdowns have since broadened to affect all sectors, including retail, jobs loss across industries is expected in April.”
03 April 2020
Growth figures of domestic retail sales have been declining since 2014 and they reached a low-point in September 2017 when they registered an annual growth rate of just 1.5%. They then began increasing for about a year, only to stabilise at around 3.0% to 3.5% through late 2018 before trending lower through 2019. February’s figures have continued the trend and economists expect future months’ figures to deteriorate considerably.
According to the latest ABS figures, total retail sales increased by 0.5% in February on a seasonally-adjusted basis, a larger gain than the +0.4% increase which had been expected and a turnaround from January’s -0.3%. However, on an annual basis, retail sales increased by just 1.8%, as compared to January’s comparable figure of 2.0%.
Westpac senior economist Matthew Hassan said he “had expected the wash-up to be a touch softer.”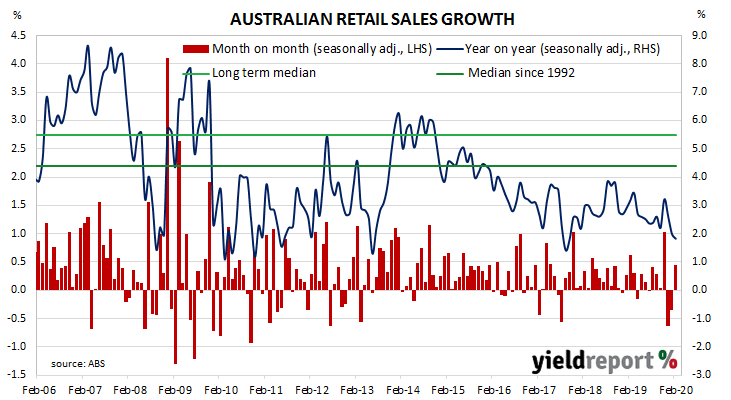 Domestic Treasury bond yields reacted in a manner which was mixed but subdued. By the end of the day, the 3-year ACGB yield had slipped 1bp to 0.24% while the 10-year yield remained unchanged at 0.75% and the 20-year yield finished 3bps higher at 1.41%.
Prices of cash futures contracts hardly moved. By the end of the day, April contracts implied a rate cut down to zero as a 55% chance, up from the previous day’s 52%. May contracts implied a 53% chance of such a move at that month’s RBA Board meeting. However, another rate reduction was not seen as being any more likely in later months of 2020; December contracts implied a 49% chance of a rate cut down to zero.
01 April 2020
US purchasing managers’ indices (PMIs) have been sliding since August 2018, albeit from elevated levels. After reaching a cyclical peak in September 2017, manufacturing PMI readings went sideways for a year before they started a downtrend. Readings then stabilised after a truce of sorts was made with the Chinese regarding trade in late 2019. However, the latest reading implies US manufacturing activity began contracting in March.
According to the latest Institute of Supply Management (ISM) survey, its Purchasing Managers Index recorded a reading of 49.1 in March, considerably higher than the expected figure of 45.0 but lower than February’s final reading of 50.1. The average reading since 1948 is 52.9 and any reading below 50 implies a contraction.
The ISM’s Tim Fiore said, “The coronavirus pandemic and shocks in global energy markets have impacted all manufacturing sectors.”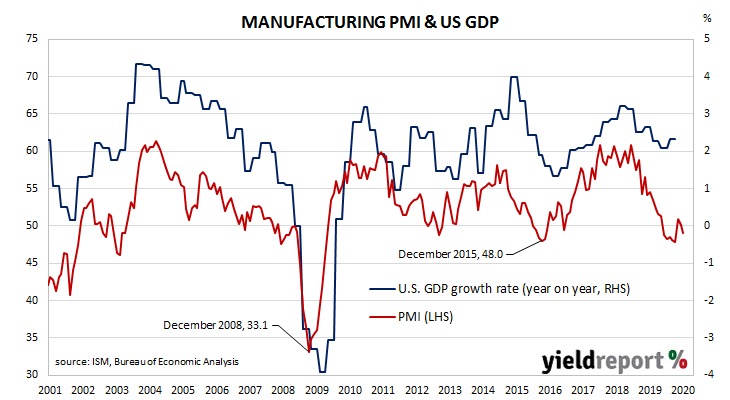 US Treasury yields fell across the curve. By the end of the day, the 2-year Treasury bond yield had shed 2bps to 0.21%, the 10-year yield had lost 8bps to 0.58% while the 30-year yield finished 11bps lower at 1.21%.
A month ago, ANZ economist Adelaide Timbrell noted slowing delivery times “owing to delays in receiving inputs” had posed a concern. NAB head of FX Strategy within its FICC division Ray Attrill said a rise in delivery times was behind this latest result. “In normal times this is a sign of demand outstripping the ability to supply, but these are not normal times and the March increase reflected supply chain disruptions due to COVID-19.” He noted other sub-indices had fallen and, in some cases, “quite sharply”.
Purchasing Managers’ Indices (PMIs) are economic indicators derived from monthly surveys of executives in private-sector companies. They are diffusion indices, which means a reading of 50% represents no change from the previous period, while a reading under 50% implies respondents reported a deterioration on average. They are particularly useful as a leading indicator.
01 April 2020
Approvals for dwellings, that is apartments and houses, had been heading south since mid-2018. As an indicator of investor confidence, falling approvals represent a worrying signal, not just for the building sector but for the overall economy. Approval figures from November and December represented a substantial turnaround and the possibility of a recovery in 2020. While the latest numbers offer some suggestion of a rising trend, they are from a month untouched by the economic effects of the pandemic the world is currently facing.
The Australian Bureau of Statistics has released the latest figures from February and total residential approvals increased by 19.9% on a seasonally-adjusted basis, much higher than the +4.50% increase which had been expected and a substantial turnaround from January’s revised figure of -15.1%. On an annual basis, total approvals contracted by 5.8%, an improvement from January’s comparable figure of -11.1% after it was revised a little.
Westpac senior economist Matthew Hassan said, “Obviously we should ignore the headline figure; aside from the high-rise issue, many projects will be shelved or delayed as the social restriction measures impact activity and the substantive hit to the economy sees a pull-back in new building.”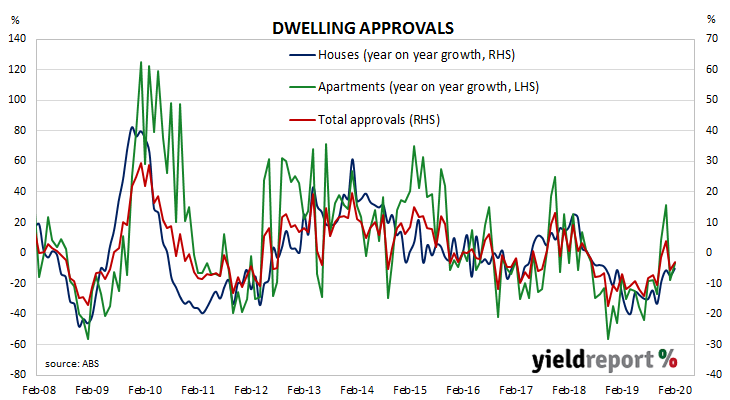 Australian government bond yields fell a little harder than their US counterparts had in overnight trading. By the end of the day, the 3-year ACGB yield had lost 5bps to 0.22%, the 10-year yield had dropped 8bps to 0.66% while the 20-year yield finished 12bps lower at 1.31%.
Prices of cash futures contracts moved to reflect a slight hardening of rate-cut expectations, although last month’s rate reductions by the RBA have almost ruled out any further cuts. By the end of the day, April contracts implied a rate cut down to zero as a 55% chance, up from the previous day’s 47%. May contracts also implied a 55% chance of such a move at that month’s RBA Board meeting. However, another rate reduction was not seen as being any more likely in later months of 2020; December contracts implied a 49% chance of a rate cut down to zero.
Approvals for new houses fell by 1.7% over the month, down from January’s revised figure of +0.7%. On a 12-month basis, house approvals were 5.1% lower than in February 2019.
01 April 2020
The ADP National Employment Report is a monthly report which provides an estimate of US non-farm employment in the private sector. Since the report began to be published in 2006, its employment figures have exhibited a high correlation with official non-farm payroll figures, although a large difference can arise in any individual month. However, this latest report has a cut-off date which does not include a dramatic change which took place over the second half of March.
March’s report indicates private sector employment fell by 27,000, a smaller contraction than the -150,000 which had been expected but still a distinct reversal from February’s revised figure of +179,400.
ANZ economist Daniel Been noted the survey’s 12 March cut-off date and said “it’s not capturing the lockdowns, as is expected with non-farm payrolls on Friday.”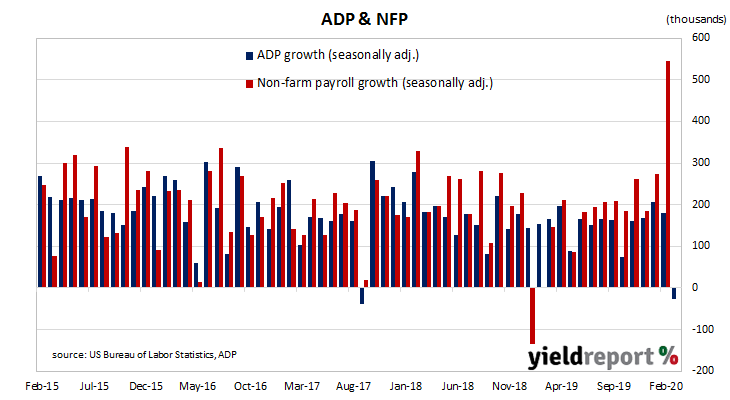
US Treasury yields fell across the curve. By the end of the day, the 2-year Treasury bond yield had shed 2bps to 0.21%, the 10-year yield had lost 8bps to 0.58% while the 30-year yield finished 11bps lower at 1.21%.
Employment numbers continued to grow in medium-sized and large-sized businesses but small business took a hit. Firms with less than 50 employees lost a net 90,000 positions but mid-sized firms (50-499 employees) added 7,000 positions and large businesses (500 or more employees) accounted for 56,000 additional positions.
31 March 2020
US consumer confidence collapsed in late 2007 as the US housing bubble burst and the US economy went into recession. By 2016, it had clawed its way back to neutral and then went from strength to strength until late 2018. Measures of consumer confidence then oscillated within a fairly narrow band at historically high levels until March 2020.
The latest Conference Board survey held during the first half of March indicates US consumer confidence has deteriorated significantly. March’s Consumer Confidence Index registered 120.0, above the median consensus figure of 115 but well below February’s final figure of 132.6. Compared to consumers’ views held at the time of the February survey, their views of present conditions slipped a little while their views of future conditions softened considerably.
Lynn Franco, a senior director at the Conference Board said, “March’s decline in confidence is more in line with a severe contraction, rather than a temporary shock, and further declines are sure to follow.”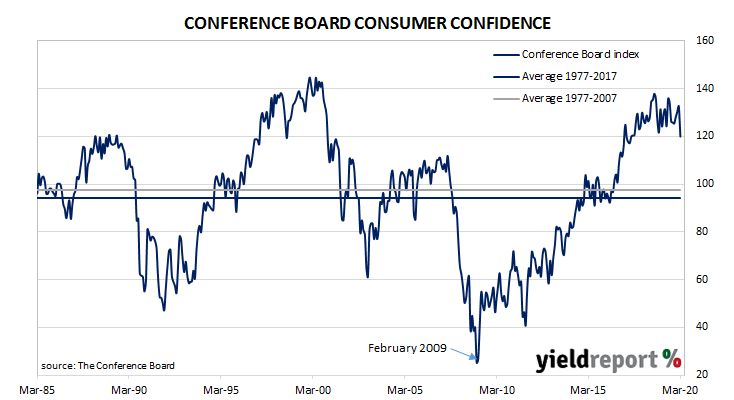
US Treasury markets reacted by mostly sending yields lower. By the end of the day, the yield on 2-year Treasury bonds had inched up 1bp to 0.23% while the 10-year yield had lost 6bps to 0.66% and the 30-year yield had shed 2bps to 1.34%.
In terms of US Fed policy, a rate change of any sort remained unlikely given the federal funds rate has been at the effective lower bound since the US Fed reduced it on Sunday 15 March. Contract prices out to March 2021 imply traders expect no change in the federal funds rate over the next 12 months.
31 March 2020
The pace of lending to the non-bank private sector by financial institutions in Australia has been trending down since October 2015. It appeared to have stabilised in the September quarter of 2018 but the annual growth rate then continued to deteriorate through 2019, despite some optimism emerging in the housing market following the re-election of the Coalition Government in May of that year.
While senior RBA officials would like business lending to increase, those same officials would also like households to reduce debt. In early 2020, RBA Governor Philip Lowe publicly stated the cash rate had been reduced in part to assist households to set aside funds to repay debt.
According to the latest RBA figures, private sector credit grew by +0.4% in February, above the +0.3% increase which had been expected but in line with January’s +0.4% increase after it was revised up from 0.3%. The annual growth rate moved higher, from January’s revised annual rate of 2.6% to 2.8%.
The increase over the month was predominantly driven by increased business lending, with real estate investors also playing a significant part. Personal lending and lending to owner-occupiers both increased modestly.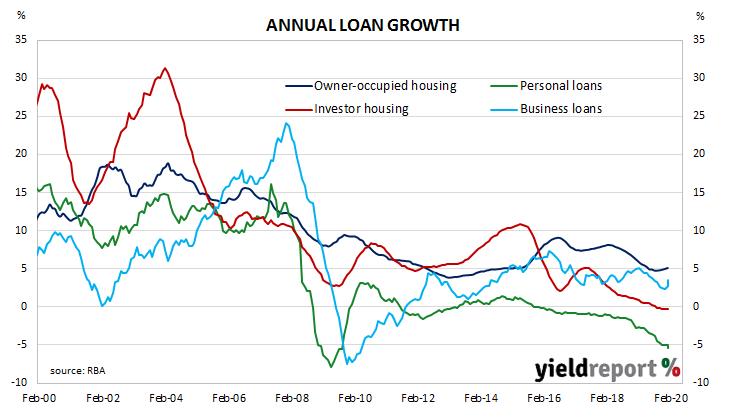 Westpac senior economist Andrew Hanlan said, “Credit began 2020 on a slightly better note, expanding by 0.4% in both January and February, the best two month period since August-September 2018.” ANZ economist Hayden Dimes agreed but noted the change in conditions after the end of February. “Despite the pick-up this quarter so far, we anticipate from next quarter onwards overall credit growth will slow and then turn negative.”
Local Treasury bonds yields fell a little. By the end of the Australian trading day, the 3-year Treasury bond yield had slipped 1bp to 0.27%, 2bps above the RBA target rate of 0.25%. The 10-year yield lost 2bps to 0.74% while the 20-year yield finished 3bps lower at 1.43%.
27 March 2020
One of the US Fed’s favoured measures of inflation is the change in the core personal consumption expenditures (PCE) price index. After hitting the Fed’s target at 2.0% in mid-2018, the annual rate then hovered in a range between 1.8% and 2.0% through to the end of 2018 before dropping in the first quarter of 2019 to around 1.5%. It has ranged between 1.5% and 1.8% since then.
The latest figures have now been published by the Bureau of Economic Analysis as part of the February personal income and expenditures report. Core PCE prices increased by 0.2% for the month, above the +0.1% increase which had been expected but the same rate as January’s 0.2% increase after it was revised up from +0.1%. On a 12-month basis, the core PCE inflation rate ticked up from January’s revised rate of 1.7% to 1.8%.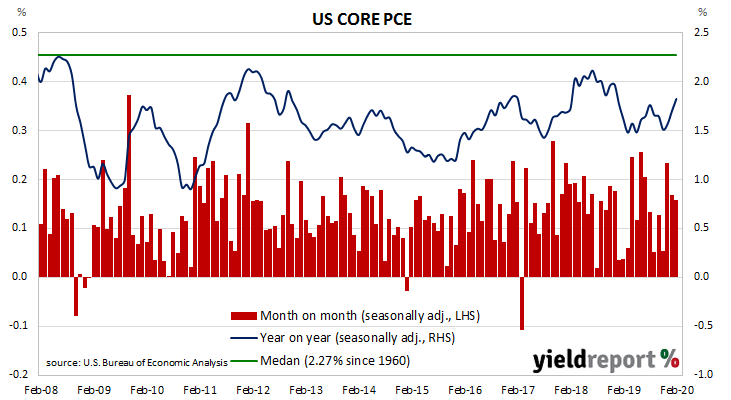
US Treasury yields finished considerably lower, although the day’s change was more likely the result of broader market concerns over US COVID-19 infection rates and moves by investors away from equity markets. By the end of the day, the 2-year Treasury yield had fallen 6bps to 0.24% while 10-year and 30-year yields had each plunged by 18bps to 0.67% and 1.26% respectively.
In terms of US Fed policy, a rate change of any sort remained unlikely given the federal funds rate has been at the effective lower bound since the US Fed made its second emergency cut for the month on Sunday 15 March.

