19 February 2020
Around the end of 2018, the annual rate of prices received by producers began a downtrend which then continued through 2019. Months in which prices picked up suggested the trend may have been coming to an end, only for the trend to continue. It is tempting to suggest the most recent figures represent a change.
The figures from January have been published by the Bureau of Labor Statistics and they indicate producer prices increased by 0.5% after seasonal adjustments, more than the 0.1% which had been expected and an increase from December’s revised increase of 0.2%. On a 12-month basis, the rate of producer price inflation after seasonal adjustments accelerated to 2.1% after recording 1.3% in December and 1.0% in October.
ANZ economist Kishti Sen Hayden Dimes said the result was much stronger than expected but “largely due to a 0.7% rise in services costs, as strong rises in retailer margins offset weakness in freight and cargo.” However, he described inflationary pressures overall as “subdued”.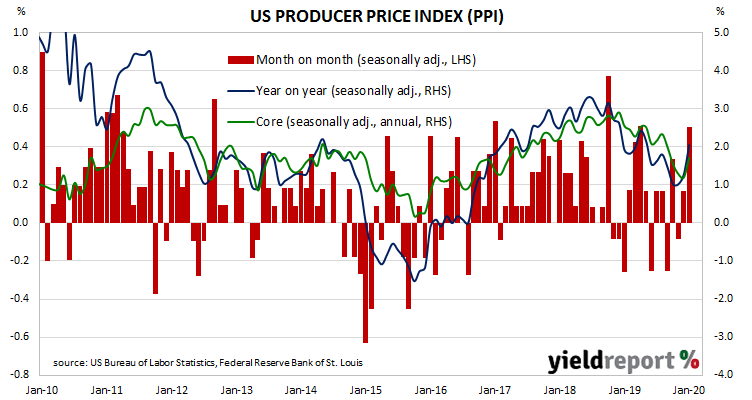
“Core” PPI inflation also increased by 0.5%, a marked increase from December’s 0.1% rise. Its annual rate accelerated to 1.7% from 1.2% after having slowed for four consecutive months.
US Treasury bond yields finished higher but only at the short end. By the end of the day, the US 2-year Treasury yield had increased by 2bps to 1.42% while 10-year and 30-year yields each remained unchanged at 1.56% and 2.01% respectively.
19 February 2020
Westpac and the Melbourne Institute describe their Leading Index as a composite measure which attempts to estimate the likely pace of Australian economic activity over the next three to six months. After reaching a peak in early 2018, the index headed lower through 2018 and most of 2019. Recently, it had staged a modest recovery.
The latest six month annualised growth rate of the indicator has fallen from December’s revised figure of –0.28% to -0.46% in January. The current reading ends a recent string of increases and it leaves the index’s growth rate entrenched in the sub-trend territory.
Westpac chief economist Bill Evans has not changed his forecasts for GDP growth in 2020 over the past few months, restating his view “that growth will remain around a 2% pace in the first half of 2020.” However, he has revised Westpac’s March quarter growth forecast from 0.5% to zero as a result of the effects from bushfires in January and, more recently, the coronavirus.
Index figures represent rates relative to trend-GDP growth, which is generally thought to be around 2.75% per annum. The index is said to lead GDP by three to six months, so theoretically the current reading represents an annualised GDP growth rate of around 2.25% in mid-2020.
14 February 2020
US retail sales had been trending up since late 2015 but, beginning in late 2018, a series of weak or negative monthly results led to a drop-off in the annual growth rate which brought the annual rate below 2.0% by the end of the year. However, growth rates increased in trend terms through 2019 and the first set of figures for 2020 have been largely uncontroversial.
According to the latest “advance” sales numbers released by the US Census Bureau, total retail sales grew by 0.3% in January, in line with expectations but higher than December’s revised increase of +0.2%. On an annual basis, the growth rate fell back to 4.4% from December’s revised rate of 5.5%.
The report came on the same day as consumer sentiment and industrial production figures were released and bond yields fell a few basis points across the curve. By the close of trade, the 2-year Treasury yield was 2bps lower at 1.42% while 10-year and 30-year yields had both lost 3bps each to 1.59% and 2.04% respectively.
In terms of US Fed policy, expectations of another rate change in the next few months remained soft. According to end-of-day prices of federal funds futures, the implied probability of a 25bps rate cut at the FOMC’s March meeting ticked up from 10% to 11%, while the likelihood of a rate cut by or at July’s meeting moved from 55% to 56%.
14 February 2020
US consumer confidence started 2019 at well-above-average levels in a longer-term context, although readings were markedly lower than those which had been typical of most of the previous year. Since then, surveys have generally indicated US households maintained historically-high levels of confidence except for two short-lived plunges; one at the very start of the year and one in August.
The latest survey conducted by the University of Michigan indicates the average confidence level of US households has resumed its recovery after falling precipitously in August 2019. The University’s preliminary reading from its Index of Consumer Sentiment increased from January’s final figure of 99.8 to 100.9 in February, over the consensus figure of 99.8.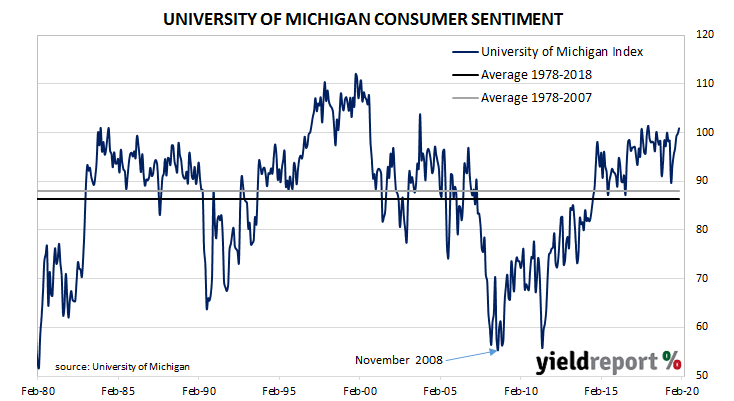
The report came on the same day as industrial production and retail sales figures were released and bond yields fell a few basis points across the curve. By the close of trade, the 2-year Treasury yield was 2bps lower at 1.42% while 10-year and 30-year yields had lost 3bps each to 1.59% and 2.04% respectively.
In terms of US Fed policy, expectations of another rate change in the next few months remained soft. According to end-of-day prices of federal funds futures, the implied probability of a 25bps rate cut at the FOMC’s March meeting ticked up from 10% to 11%, while the likelihood of a rate cut by or at July’s meeting moved from 55% to 56%.
14 February 2020
The Federal Reserve’s industrial production (IP) index measures real output from manufacturing, mining, electricity and gas company facilities located in the United States. These sectors are thought to be sensitive to consumer demand and so some leading indicators of GDP use industrial production figures as a component. The latest figures indicate a downtrend which began in late 2018 has continued.
According to January’s figures released by the Federal Reserve, US industrial production fell by 0.3%, in line with expectations and a little higher than December’s revised figure of +0.4%. On an annual basis, the growth rate improved from December’s -0.9% to -0.8%.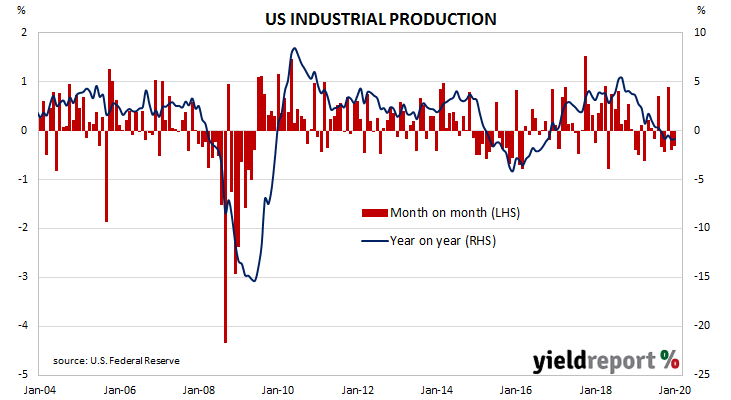 The report came on the same day as consumer sentiment and retail sales figures were released and bond yields fell a few basis points across the curve. By the close of trade, the 2-year Treasury yield was 2bps lower at 1.42% while 10-year and 30-year yields had both lost 3bps each to 1.59% and 2.04% respectively.
In terms of US Fed policy, expectations of another rate change in the next few months remained soft. According to end-of-day prices of federal funds futures, the implied probability of a 25bps rate cut at the FOMC’s March meeting ticked up from 10% to 11%, while the likelihood of a rate cut by or at July’s meeting moved from 55% to 56%.
13 February 2020
The annual rate of US consumer inflation halved from nearly 3% in the period from July 2018 to February 2019 and then subsequently fluctuated in a range from 1.5% to 2.0%. “Headline” inflation is known to be volatile and so references are often made to “core” inflation for analytical purposes. This measure has mostly ranged between 1.7% and 2.3% in recent years.
The latest consumer price index (CPI) figures released by the Bureau of Labor Statistics indicated seasonally-adjusted consumer prices increased by +0.1% on average in January, less than the +0.2% increase which had been expected and lower than December’s +0.2%. However, on a 12-month basis, the inflation rate increased from December’s annual rate of 2.3% to 2.5%.
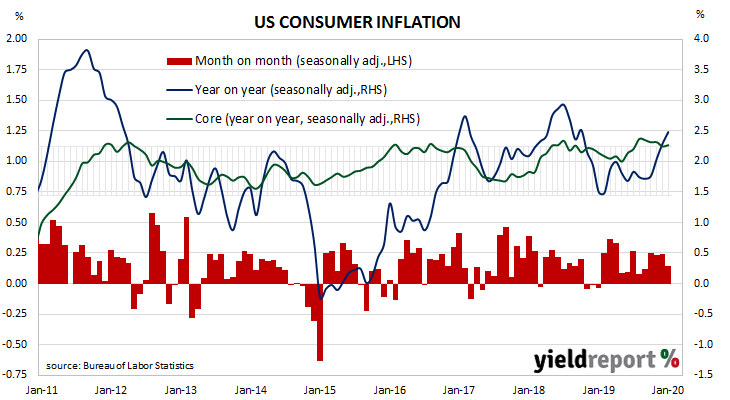
Core inflation, a measure of inflation which strips out the volatile food and energy components of the index, increased on a seasonally-adjusted basis by +0.2% for the month, in line with expectations but up from December’s +0.1% increase. The annual rate ticked up from December’s 2.2% to 2.3% in January.
ANZ economist Hayden Dimes said the figures “show the US economy is improving and [they] support the argument for the Fed to hold interest rates at current levels.”
12 February 2020
As with other countries’ measures of industrial production, Eurostat’s industrial production index measures the output and activity of industrial sectors in euro-zone countries in aggregate. Following a recession in 2009/2010 and the debt-crisis of 2010-2012 which flowed from it, euro-zone industrial production recovered and then reached a peak four years later in early-2016. Growth rates then slowed through the rest of 2016, accelerated during 2017 and then began a steady and persistent slowdown.
According to the latest figures released by Eurostat, euro-zone industrial production declined by a seasonally-adjusted 2.1% in December, much lower than the 0.2% fall which had been expected and also noticeably lower than November’s flat result. On an annual basis, seasonally-adjusted growth in industrial production deteriorated from November’s revised rate of -1.7% to -3.5%* in December.
ANZ senior economist Felicity Emmett described the report’s figures as “dire” while NAB economist Tapas Strickland used the term “woeful”.
Industrial production growth rates contracted in all of the eurozone’s four largest economies. Industrial production contracted by 2.5% in Germany, in France by 2.9%, in Spain by 1.5% and by 2.7% in Italy.
12 February 2020
After a lengthy divergence between measures of consumer sentiment and business confidence in Australia which began in 2014, confidence readings of the two sectors converged again around July 2018. Since then, their readings have deteriorated, with consumer confidence leading the way. Recent surveys paint a picture of a cautious consumer, indeed a somewhat pessimistic one. However, these readings have remained above the low-point reached in October 2019.
According to the latest Westpac-Melbourne Institute survey conducted in the first week of February, average household optimism has increased, albeit from low levels. The Consumer Sentiment Index increased from 93.4 to 95.5, back to where it was before a series of bushfires hit south-eastern Australia around the end of 2019.
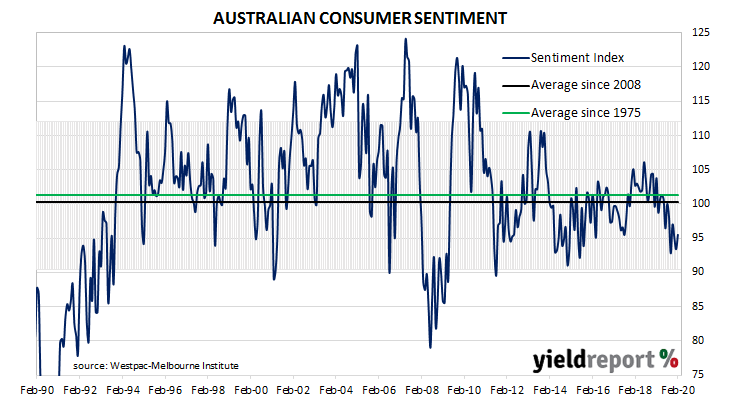
Any reading below 100 indicates the number of consumers who are pessimistic is greater than the number of consumers who are optimistic. The latest figure is also noticeably below the long-term average reading of just over 101.
Westpac senior economist Matthew Hassan said, “The lift in sentiment this month likely reflects easing concerns around bushfires and comes despite some significant negative developments, most notably the coronavirus outbreak abroad.” However, he also noted “the escalating coronavirus outbreak looks to have had only a limited effect on consumer sentiment… the full impact of the outbreak is yet to be felt locally and we may see more of a drag on sentiment in the months ahead, particularly as the hit to sectors such as tourism and education start to come through.”
11 February 2020
Australian business conditions were robust in the first half of 2018 and a cyclical-peak was reached in April of that year. However, readings began to slip and, by the end of 2018, they had dropped to below-average levels. Forecasts of a slowdown in the domestic economy began to emerge in the first half of 2019. Since then, conditions have remained quite stable, albeit at low-growth levels, while confidence readings appear to be trending lower.
According to NAB’s latest monthly business survey of 400 firms conducted in through late January and early February, business conditions continued to bump along at below-average levels. The NAB’s conditions index has registered 3, the same reading as at the start of January.
Business confidence recovered a little, although it remained very much at the lower bound. NAB’s confidence index ticked up from -2 to -1, well below its long-term average reading of 6. Typically, NAB’s confidence index leads the conditions index by approximately one month, although some divergences appear from time to time.
Alan Oster, NAB’s chief economist, said the figures “suggest very little-to-no growth in the private sector.”

Although US Treasury bond yields had closed a little lower in overnight trading, local yields finished slightly higher. By the end of the day, yields on 3-year and 10-year ACGBs had each ticked up 1bp to 0.71% and 1.03% respectively while the 20-year yield finished 2bps higher at 1.43%.
Prices of cash futures contracts moved to reflect a softening of rate-cut expectations on the day. The March contract implied a 7% chance of a 25bps rate cut, down from the previous day’s 11% while the April contract implied a 26% chance of another cut, down from 31%. May contracts implied a 48% chance but prices of the July contract almost fully factored in a 25bps cut.
11 February 2020
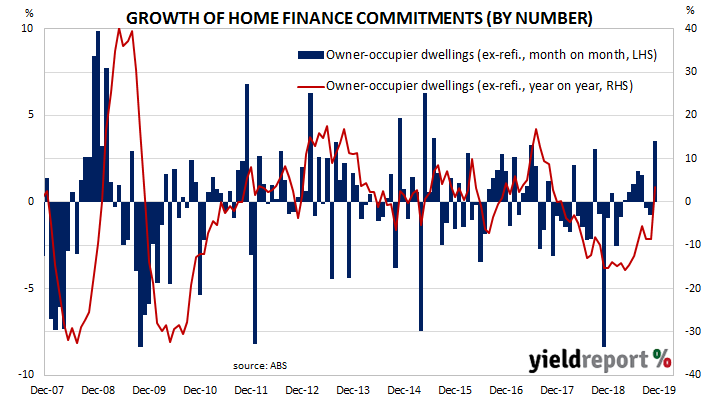
A very clear downtrend was evident in the monthly figures of both the number and value of home loan commitments through late-2017 to mid-2019. Then the RBA began to reduce its cash rate target in a series of cuts and both the number and value of mortgage approvals began to noticeably increase.
December’s housing finance commitment figures have now been released and the total number of loan commitments (excluding refinancing loans) to owner-occupiers increased by 3.5%, an improvement on November’s revised figure of -0.8%. On an annual basis, the growth rate accelerated from November’s revised figure of -8.7% to +3.5%.
ANZ economist Adelaide Timbrell said, “Improved sentiment in the property market, driven by easier credit, low interest rates and consistently strong price growth, is behind the continuing strength of mortgage demand.”
 Although US Treasury bond yields had closed a little lower in overnight trading, local yields finished slightly higher. By the end of the day, yields on 3-year and 10-year ACGBs had each ticked up 1bp to 0.71% and 1.03% respectively while the 20-year yield finished 2bps higher at 1.43%.
Prices of cash futures contracts moved to reflect a softening of rate-cut expectations. The March contract implied a 7% chance of a 25bps rate cut, down from the previous day’s 11% while the April contract implied a 26% chance of another cut, down from 31%. May contracts implied a 48% chance but prices of the July contract almost fully factored in a 25bps cut.

