30 January 2020
While the US has a historically low unemployment rate, recent bond yields suggest future growth rates will be below trend. The US Fed agreed and it reduced its federal funds range three times in the second half of 2019 as a form of insurance against a softening economy. While US GDP growth slowed in the second quarter of that year, it stabilised and then maintained a 0.5% per quarter growth rate.
The US Commerce Department has just released December quarter “advance” GDP estimates and they indicate the US economy grew at 0.5% for the quarter or at an annualised growth rate of 2.1%. The growth figure was a touch higher than the 2.0% which had been expected but it was the same as the September quarter’s final figure.
ANZ senior economist Cherelle Murphy said, “The private domestic demand components of GDP softened. Waning fiscal stimulus, capacity constraints and trade policy are weighing on growth.”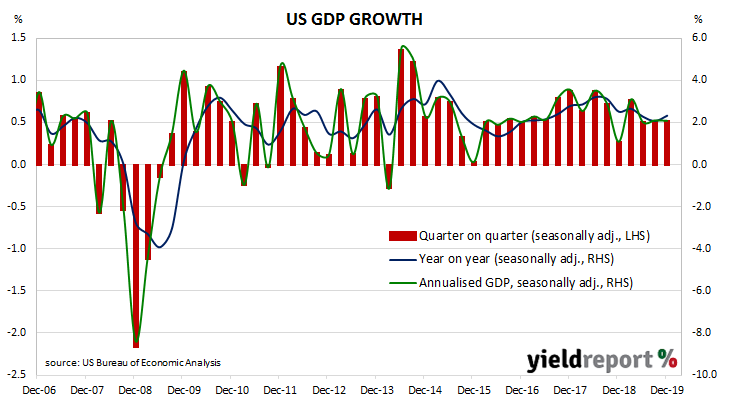
US Treasury bond yields moved lower. By the end of the day, the 2-year Treasury bond yield had lost 4bps to 1.37%, the 10-year yield had shed 5bps to 1.53% while the 30-year yield finished only 2bps lower at 2.01%.
In the futures market for federal funds, expectations of another cut in the first half of 2020 hardened albeit from a low base. According to end-of-day prices, the implied probability of a 25bps rate cut at the FOMC’s March meeting was 13%, up from the previous day’s 7%. The implied probabilities of a cut at the April and June meetings was 25% and 44% respectively.
29 January 2020
In the early 1990s, entrenched inflation was broken by the “recession we had to have”, as it became known. Since then, core consumer price inflation has averaged around 2.6% which, coincidentally, is almost the midpoint of the RBA’s target range of 2%-3%. In recent years, various measure of inflation have been in a down-trend despite attempts by the RBA to increase them through historically low cash rates.
Figures for the December quarter have now been released by the ABS and both the headline and seasonally-adjusted figures exceeded market expectations. The headline inflation rate was +0.7% for the quarter, up from the September quarter’s +0.5% while the seasonally-adjusted inflation rate accelerated from +0.3% to +0.6%. On a 12-month basis, both headline and seasonally-adjusted inflation registered 1.8%, both having recorded 1.7% growth rates in the September quarter.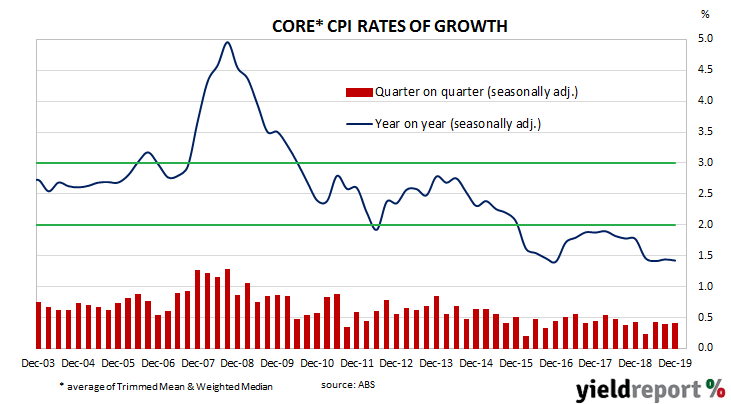 The RBA’s preferred measure of core inflation, the “trimmed mean”, remained unchanged from September’s values on a quarterly basis and an annual basis. The trimmed mean inflation rate for the December quarter was +0.4%, in line with the market’s expected figure while the 12-month growth rate also remained unchanged at 1.6%.
Commonwealth Government bond yields finished higher, aided by higher US Treasury yields in overnight trading. By the end of the day, the 3-year ACGB yield had gained 5bps to 0.67%, the 10-year yield had increased by 6bps to 1.03% while 20-year yields finished 7bps higher at 1.43%.
29 January 2020
Westpac and the Melbourne Institute describe their Leading Index as a composite measure which attempts to estimate the likely pace of Australian economic activity over the next three to six months. After reaching a peak in early 2018, the index headed lower through 2018 and most of 2019. Recently, it has staged a modest recovery.
The latest six month annualised growth rate of the indicator has increased from November’s revised figure of –0.62% to -0.32% in December. The current reading represents the third consecutive reading in which the index has improved, although it still remains in sub-trend territory.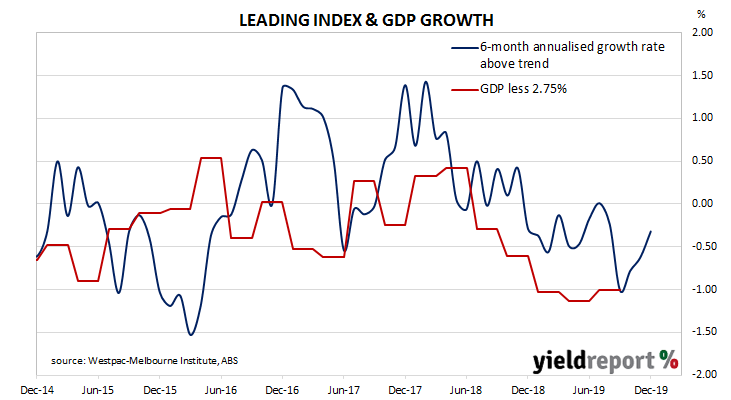
Westpac chief economist Bill Evans restated his view from late last year. “The latest update points to weak economic momentum continuing in the first half of 2020 and is consistent with Westpac’s view that growth will remain around a 2% pace in the first half of 2020.”
Index figures represent rates relative to trend-GDP growth, which is generally thought to be around 2.75% per annum. The index is said to lead GDP by three to six months, so theoretically the current reading represents an annualised GDP growth rate of around 2.40% in mid-2020.
28 January 2020
US consumer confidence collapsed in late 2007 as the US housing bubble burst and the US economy went into recession. By 2016, it had clawed its way back to neutral and then went from strength to strength until late 2018. Since then, measures of consumer confidence have oscillated within a fairly narrow band at historically high levels.
The latest Conference Board survey indicates US consumers remained very optimistic. January’s Consumer Confidence Index registered 131.6, a little above the median consensus figure of 128.0 and December’s final figure of 128.2. Consumers’ views of present conditions and future conditions both improved from those held at the time of the December survey.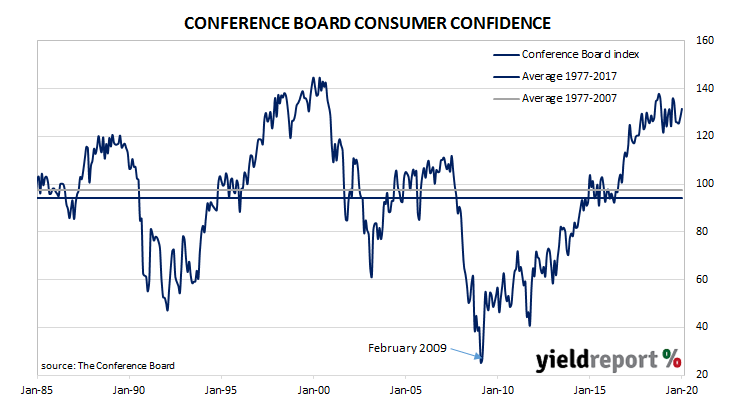
NAB Head of FX Strategy Ray Attrill said “the US consumer still looks to be in rude health”. ANZ senior economist Felicity Emmett expanded on this theme, pointing to “the lowest unemployment rate since 1969, the longest expansion on record, low inflation and near record-high job vacancies…Household balance sheets are strong…”
Treasury bond yields rose across the curve. By the end of the day, the yield on 2-year Treasury bonds had gained 3bps to 1.47% while 10-year and 30-year yields had each increased by 5bps to 1.66% and 2.11% respectively.
In the futures market for federal funds, expectations of another cut in the first half of 2020 remained low. According to end-of-day prices of federal funds futures, the implied probability of a 25bps rate cut at the FOMC’s January meeting is zero while the likelihood of a cut at March’s meeting remained at 8%. The April and June meetings of the FOMC had implied probabilities of another cut at 17% and 32% respectively.
28 January 2020
Australian business conditions were robust in the first half of 2018 and a cyclical-peak was reached in April of that year. However, readings began to slip and, by the end of 2018, they had dropped to below-average levels. Forecasts of a slowdown in the domestic economy began to emerge in the first half of 2019. Since then, conditions readings have varied modestly while confidence readings appear to be trending lower.
According to NAB’s latest monthly business survey of 400 firms conducted in the first half of January, business conditions continued to bump along at below-average levels. Since late 2018, NAB’s conditions index bounced between 3, which is on the low side of normal and 7, which is about average. The index then broke through this lower bound in May 2019 and began to bounce between 1 and 4. The latest reading has registered 3, down from November’s reading of 4.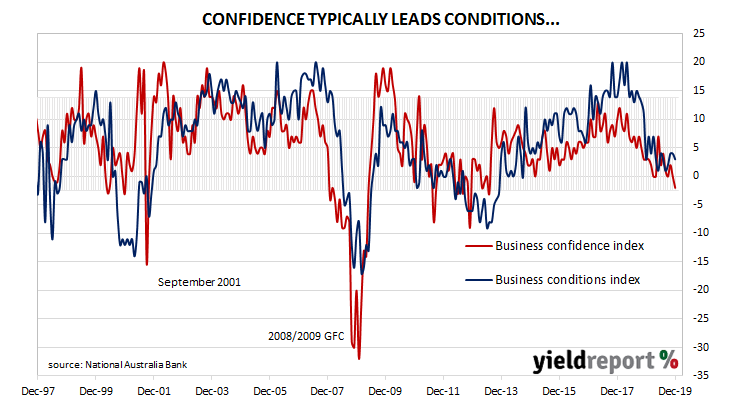 While the conditions index remained in its recent range, the latest reading of NAB’s confidence index fell below zero, from November’s 0 to -2. Typically, NAB’s confidence index leads the conditions index by approximately one month, although some divergences appear from time to time.
In mid-December, NAB’s chief economist, Alan Oster, had said business conditions appear to “have stabilised at low levels”. He reiterated this description saying this latest survey “provides further evidence that activity stabilised in Q4.”
Westpac senior economist Andrew Hanlan agreed. He also noted any “rebound in response to policy stimulus” suggest the Federal Government’s tax cuts or the rate cuts of last year have “yet to materialise.”
23 January 2020
EU consumer confidence plunged during the GFC and again in 2011/12 during the European debt crisis. Since early 2014, it has been at average or above-average levels, rising to a cyclical peak at the beginning of 2018. However, it dropped back significantly in late 2018 at about the same time as doubts emerged over the US economy’s robustness. Since then, it has remained in a fairly narrow range.
The January survey conducted by the European Commission indicated household confidence remained at robust levels. The latest published reading of its Consumer Confidence index recorded a figure of -8.1, the same reading as in November and still at an above-average figure. The average reading since the beginning of 1985 has been -11.6.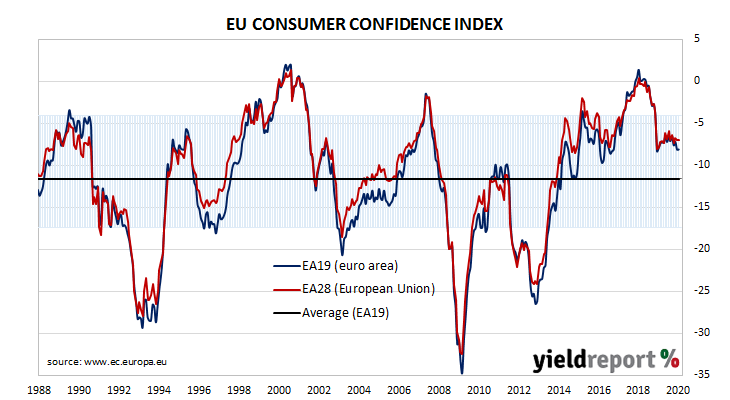
The reading was almost in line with the expected figure of -8.0 but German and French sovereign bond yields both fell a little, possibly the result of the ECB chief’s comments on the day rather than the survey’s figures. By the end of the day, yields on German and French 10-year bonds had fallen by 5bps to -0.31% and -0.06% respectively.
23 January 2020
The Conference Board Leading Economic Index (LEI) is a composite index composed of ten indices which are thought to be sensitive to changes in the US economy. The Conference Board describes it as an index thought to signal peaks and troughs; turning points in the index have historically occurred prior to changes in aggregate economic activity. Recently, month-on-month changes in the LEI have been predominantly negative.
The Leading Economic Index declined by 0.3% during December, less than the -0.2% which had been expected and less than November’s revised figure of +0.1%. On an annual basis, the LEI slowed a little from November’s revised growth rate of 0.4% to 0.2%.
Towards the end of 2019, the Conference Board’s Senior Director of Economic Research, Ataman Ozyildirim, had predicted the US economy would end “on a weak note” with a growth rate just under 2%. After this latest report, he said financial conditions and consumers’ outlook for the economy “should support growth of about 2% through early 2020.”
Changes in the LEI over time can be large but once they are standardised, a clearer relationship with GDP emerges. The latest reading implies a year-on-year growth rate of 1.3% at the end of the June 2020 quarter.
22 January 2020
After a lengthy divergence between consumer sentiment and business confidence in Australia which began in 2014, the two sectors converged again around July 2018. Since then, confidence readings from both groups have deteriorated, with consumer confidence leading the way. Although recent surveys paint a picture of a cautious consumer, those same readings have not suggested any further material deterioration.
According to the latest Westpac-Melbourne Institute survey conducted in mid-January, average household optimism has fallen back to a level which is close to the lower part of its normal range. The Consumer Sentiment Index declined from 95.1 to 93.4, back to where it was in October 2019 and noticeably below the long-term average reading of just over 101. Any reading below 100 indicates the number of consumers who are pessimistic is greater than the number of consumers who are optimistic.
Westpac chief economist Bill Evans said, “It is entirely reasonable to have expected that the Index would have fallen during this period of devastating bushfires.” However, he said the fall was surprisingly small if one were to use the Queensland floods of 2011 as a guide.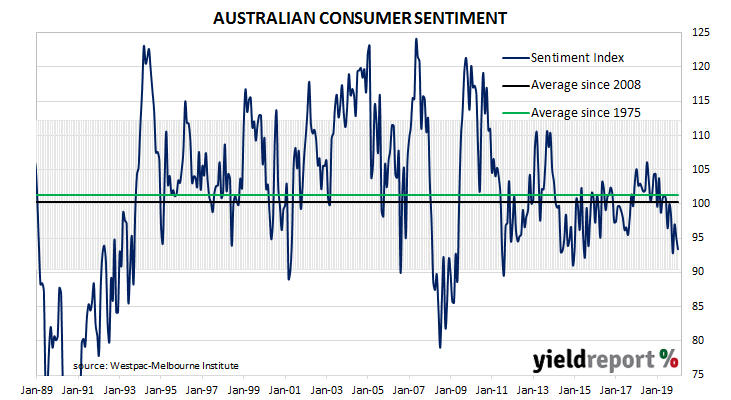
Local Treasury bond yields finished the day lower, largely in line with US movements overnight. By the end of the day, the 3-year ACGB yield had lost 4bps to 0.70% while 10-year and 20-year yields had both shed 5bps to 1.13% and 1.54% respectively.
17 January 2020
US consumer confidence started 2019 at well above average levels in a longer-term context, although readings were markedly lower than those which had been typical of most of the previous year. Since then, surveys have generally indicated US households maintained historically-high levels of confidence except for two short-lived plunges; one at the very start of the year and one in August.
The latest survey conducted by the University of Michigan indicates the average confidence level of US households has stopped rising after four consecutive months in which sentiment had improved. The University’s preliminary reading from its Index of Consumer Sentiment slipped from December’s final figure of 99.3 to 99.1 in January, just under the consensus figure of 99.2.
The University’s Surveys of Consumers chief economist, Richard Curtin, said, “Consumer sentiment remained virtually unchanged in early January, differing by just 0.2 index points from December. This stability extended to all components, both current assessments as well as future economic prospects.”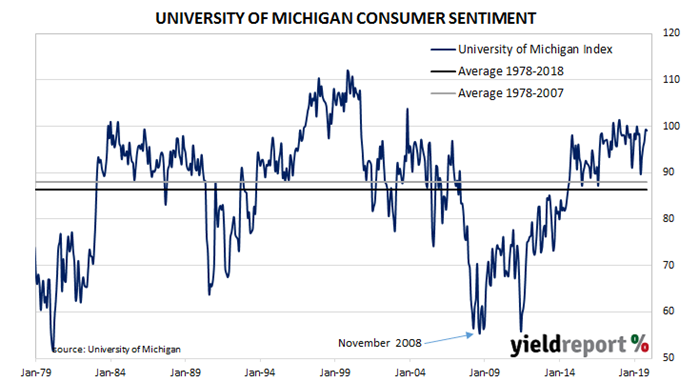
The report came on the same day as JOLTS figures and industrial production figures were released and bond yields eased at the short end. By the close of trade, the 2-year Treasury yield was 2bps lower at 1.56% while the 10-year yield had inched up 1bp to 1.82 and the 30-year yield had gained 2bps to 2.28%.
17 January 2020
The quit rate as a percentage of total US non-farm employment increased slowly but steadily from the end of the GFC. It peaked in August 2018, stabilised and then remained largely unchanged through the remainder of 2018 before it hit a new peak in July 2019. It has tracked sideways since then.
Figures released as part of the most recent JOLTS report show the quit rate has been maintained at just under the record levels reached in July and August. 2.3% of the non-farm workforce left their jobs voluntarily in November, the same rate as in September and October and much of the latter part of 2018 and the first half of 2019.
Quit numbers were highest in the retail trade sector while the “other”, accommodation/food services and construction sectors recorded the largest falls. Overall, the total number of quits for the month increased from October’s revised figure of 3.497 million to 3.536 million in November.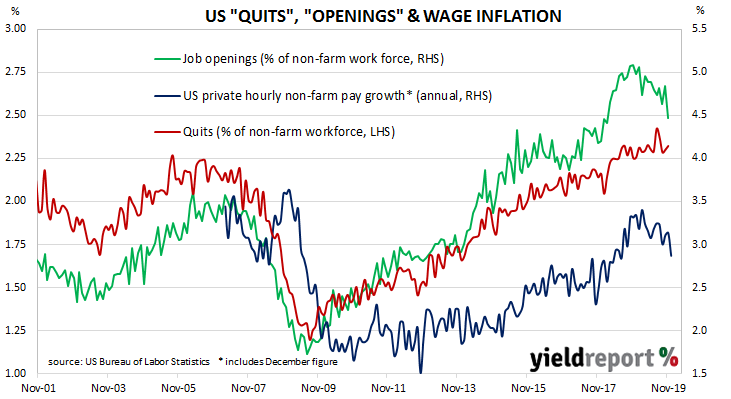
Total job openings fell significantly even before October’s figure had been revised up by 94,000. Total vacancies during November decreased by 561,000 from October’s revised figure of 7.361 million to 6.800 million, driven by large reductions in the retail and construction sectors. Additional openings in the “health care/social assistance” and information sectors provided some modest cushioning effects. Overall, 12 out of 19 sectors experienced fewer job openings than in the previous month.

