02 December 2019
Approvals for dwellings, that is apartments and houses, have been heading south since mid-2018. As an indicator of investor confidence, falling approvals represent a worrying signal, not just for the building sector but for the overall economy. There had been some expectation of a recovery in recent months but economists now appear uncertain.
The Australian Bureau of Statistics has now released the latest figures from October and total residential approvals dropped by 8.1% on a seasonally-adjusted basis, a larger fall than the 1% decrease which had been expected and a large turnaround from September’s revised figure of +7.2%. On an annual basis, total approvals fell by 23.6%, a marked deterioration from September’s comparable figure of -17.0% after revisions.
Westpac senior economist Matthew Hassan said, “The detail was particularly disappointing; rather than a high-rise driven result, weakness was more evenly spread across all dwelling types…”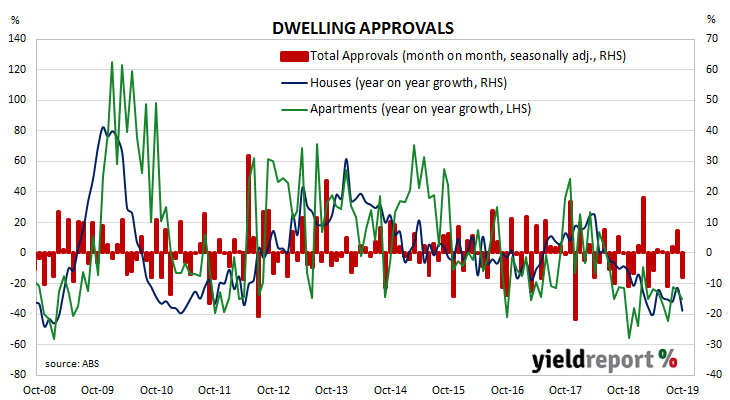
Domestic bond yields finished the day noticeably higher, although it is unlikely the sell-off was driven by this report, ANZ’s latest Job Ads survey or the latest Inflation Gauge report. By the end of the day, 3-year ACGB yields had gained 4bps to 0.69% while 10-year and 20-year yields had each increased by 6bps to 1.10% and 1.50% respectively.
Prices of cash futures contracts moved to lower expectations of another cut in the cash rate target, although one more rate cut is still largely expected within the next six months. By the end of the day, December contracts implied a 9% chance of another 25bps rate cut, down from the previous day’s 13%. February contracts implied a 70% chance of a cut, down from 77% while May continued to fully price in another rate reduction.
02 December 2019
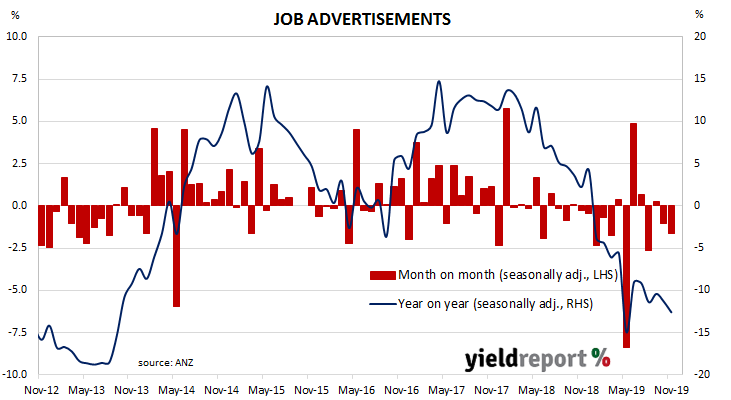
From mid-2017 onwards, year-on-year growth rates in the total number of Australian job advertisements consistently exceeded 10%. That was until mid-2018 when the annual growth rate fell back markedly and then turned negative in early 2019.
According to the latest ANZ figures, total advertisements fell by 1.7% in November on a seasonally-adjusted basis, following a 1.0% fall in October. On a 12-month basis, total job advertisements were 12.6% lower than the same month last year, a further deterioration from October’s comparable figure of -11.3% after revisions.
ANZ senior economist Catherine Birch said the survey’s role as a leading indicator was reasserting itself. “Although there has been a longer lag than usual, the downturn in the number of advertisements may be starting to filter through to the labour market.”
Domestic bond yields finished the day noticeably higher, although it is unlikely the sell-off was driven by these figures, October’s dwelling approvals figures or the latest Inflation Gauge reading. By the end of the day, 3-year ACGB yields had gained 4bps to 0.69% while 10-year and 20-year yields had each increased by 6bps to 1.10% and 1.50% respectively.
Prices of cash futures contracts moved to lower expectations of another cut in the cash rate target, although one more rate cut is still largely expected within the next six months. By the end of the day, December contracts implied a 9% chance of another 25bps rate cut, down from the previous day’s 13%. February contracts implied a 70% chance of a cut, down from 77% while May continued to fully price in another rate reduction.
29 November 2019
The pace of lending to the non-bank private sector by financial institutions in Australia has been trending down since October 2015. It appeared to have stabilised in the September quarter of 2018 but then subsequent credit figures put paid to that idea. Despite some optimism emerging in the housing market following the re-election of the Coalition Government in May, lending figures have continued to slow to a rate not that faster than the inflation rate.
According to the latest RBA figures, private sector credit grew by 0.1% in October, well below the +0.3% increase which had been expected and a step down from September’s +0.2%. The annual growth rate continued its downward slide as, this time from September’s figure of 2.7% to 2.5% in October. Lending to owner-occupiers remained solid but restrained while lending in other segments was either flat or contractionary.
ANZ economist Hayden Dimes said, “The lag between new approvals and the stock of credit looks to be almost over, and we could see a sharp pick-up in housing credit growth in coming months.”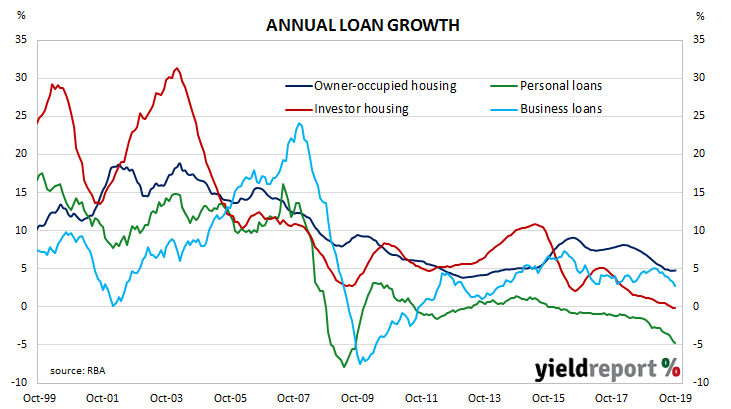
Local financial markets reacted by sending bond yields moderately higher while the likelihood of the RBA loosening monetary policy further softened. By the end of the Australian trading day, the 3-year Treasury bond yield had added 2bps to 0.65%, the 10-year yield had gained 4bps to 1.04% and the 20-year yield finished 3bps higher at 1.44%.
28 November 2019
Australia’s capital expenditure (capex) slump was thought to be coming to an end as investment in the mining sector reverted back to its long-term mean after a spike early in the decade. Total investment had begun to grow again, driven by investment in the services sector. However, contractions in recent quarters have become the norm.
According to the latest ABS figures, seasonally-adjusted private sector capex in the September quarter contracted by 0.2%, a modest improvement on the June quarter’s figure of -0.6% but less than the flat result which had been expected. On a year-on-year basis, total capex contracted by 1.3% after recording an annual rate of -1.0% in the June quarter.
ANZ senior economist Felicity Emmett said, “The weakness was concentrated in non-mining spending, while mining capex rose at it fastest pace since 2012. While miners remain relatively upbeat about the outlook, non-mining firms downgraded their investment plans and now expect to cut investment in 2019-2020.” Local financial markets reacted by sending bond yields a little lower while the likelihood of the RBA loosening monetary policy further remained largely unchanged. By the end of the Australian trading day, 3-year and 10-year Treasury bond yields each shed 2bps to 0.63% and 1.00% respectively while the 20-year yield finished 1bp lower at 1.41%.
27 November 2019
One of the US Fed’s favoured measures of inflation is the change in the core personal consumption expenditures (PCE) price index. After hitting the Fed’s target at 2.0% in mid-2018, the annual rate then hovered in a range between 1.8% and 2.0% through to the end of 2018 before dropping in the first quarter of 2019.
The latest figures have now been published by the Bureau of Economic Analysis as part of the October personal income and
expenditures report. Core PCE inflation increased by +0.1% for the month, less than the +0.2% which had been expected but more than September’s flat result. On a 12-month basis, the core PCE inflation rate slipped for a second consecutive month, from September’s 1.7% to 1.6% in October.
Westpac described the result as “disappointing”.
US Treasury yields finished the day a little higher and more so at the front of the curve. By the end of the day, 2-year yields had gained 4bps to 1.62%, 10-year yields had increased by 3bps to 1.77% and 30-year yields ticked up 1bp to 2.19%.
27 November 2019
Construction expenditure increased rapidly in Australia in the early part of this decade. A large portion of the increase came from the commissioning of new liquid natural gas projects and the expansion of existing mining projects to exploit a tripling in price of Australia’s mining exports in the previous decade. The return to “normal” investment levels is still continuing.
According to the latest construction figures published by the ABS, the value of construction work has fallen for a fifth consecutive quarter. Total construction in the September quarter fell by 0.4%, a smaller fall than the 1.0% contraction which had been expected and more than the revised 2.8% fall of the June quarter. On an annual basis, the growth rate improved from June’s revised figure of -9.8% to -7.0%.
ANZ senior economist Catherine Birch took a semi-optimistic view of the figures. “Overall, this was a much better result than Q2 [the June quarter]. Construction activity will be less of a drag on GDP growth in Q3.” Westpac senior economist Andrew Hanlan was less enthused. “The construction sector is in a cyclical downturn led by the housing sector, where conditions have swung from boom to bust.”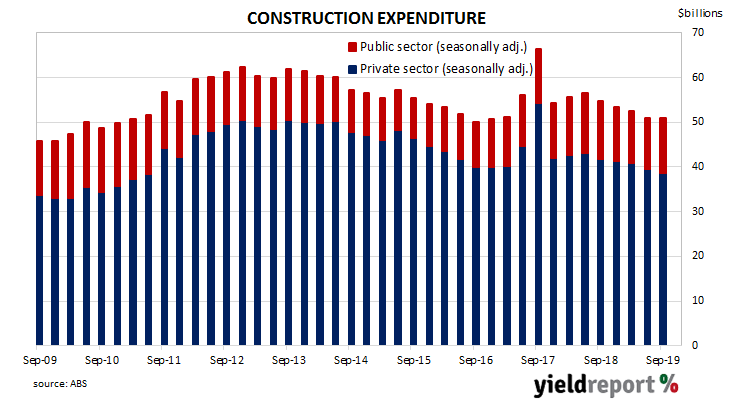 Commonwealth Government bond yields finished the day significantly lower, with lower US Treasury yields and a forecast of quantitative easing by Westpac’s chief economist adding to pressure for lower domestic yields. By the end of the day, the 3-year ACGB yield had dropped by 8bps to 0.65% while 10-year and 20-year yields had each shed 6bps to 1.02% and 1.42% respectively.
26 November 2019
US consumer confidence collapsed in late 2007 as the US housing bubble burst and the US economy went into recession. By 2016, it had clawed its way back to neutral and then went from strength to strength until late 2018. Since then, measures of consumer confidence have oscillated within a fairly narrow band while maintaining historically high levels.
The latest Conference Board survey indicates US consumers remained very optimistic. November’s Consumer Confidence Index registered 125.5, slightly below the median consensus figure of 126.8 and a little below October’s final figure of 125.9. Consumers’ views of present conditions deteriorated from those held at the time of the October survey but they were “moderately more positive” with regards to future conditions.
NAB currency strategist Rodrigo Catril said, “US consumer confidence was weaker than expected, dropping for a fourth consecutive month but from a very high level.”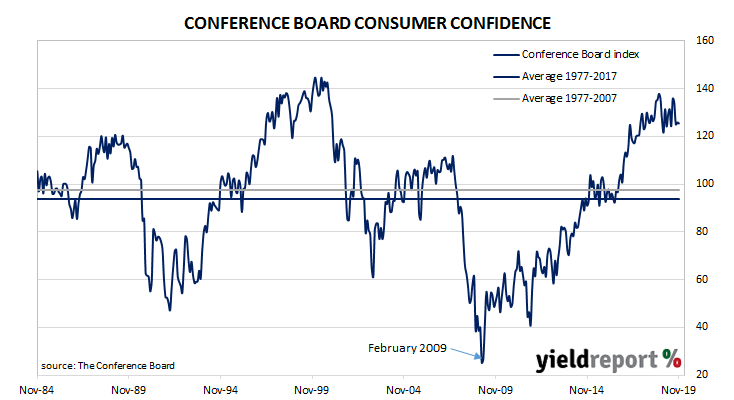
US financial markets sent Treasury yields lower across the curve. By the end of the day, the yield on 2-year Treasury bonds had lost 4bps to 1.58%, while 10-year and 30-year yields had each shed 2bps to 1.74% and 2.18% respectively.
In the futures market for federal funds, expectations of another cut in the short term remained low. According to end-of-day prices of federal funds futures, the implied probability of a 25bps rate cut at the FOMC’s December meeting remained at zero while the likelihood of a cut at January’s meeting inched up from 10% to 11%.
21 November 2019
EU consumer confidence plunged during the GFC and again in 2011/12 during the European debt crisis. Since early 2014, it has been at average or above-average levels, rising to a cyclical peak at the beginning of 2018. However, it dropped back significantly in late 2018 at about the same time as doubts emerged over the US economy’s robustness. Since then, it has remained fairly steady, largely ignoring the trade spat between the US and China, although there has been a small amount of variation from month-to-month.
The November survey conducted by the European Commission indicated household confidence remained at robust levels. The latest published measure of Consumer Confidence index produced a figure of -7.2, indicating households were slightly more confident than in October when the index registered -7.6. The average reading since the beginning of 1985 has been -11.6.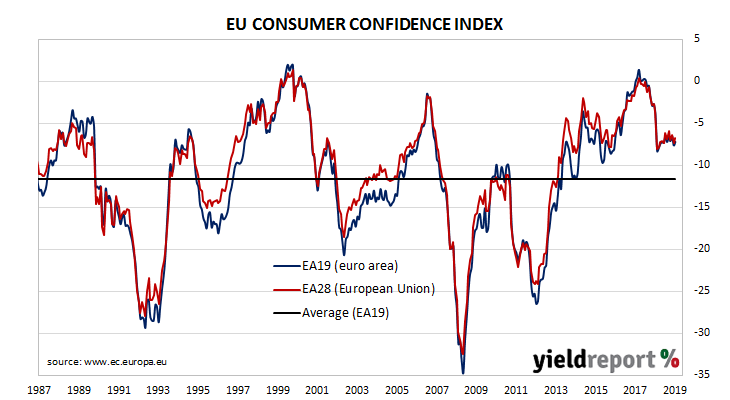
The figure was slightly better than the -7.3 which had been expected and German and French sovereign bond yields increased modestly. By the end of the day, the yield on German 10-year bunds had added 2bps to -0.33% while the French 10-year OATS yield had gained 3bps to -0.01%.
21 November 2019
The Conference Board Leading Economic Index (LEI) is a composite index which is composed of ten indices which are thought to be sensitive to changes in the US economy. The Conference Board describes it as an index which attempts to signal peaks and troughs and turning points in the index have historically occurred prior to changes in aggregate economic activity. Recently, month on month changes in the LEI have been largely negative.
The Leading Economic Index slipped by 0.1% during October, in line with expectations but more than September’s revised figure of -0.2%. On an annual basis, the LEI accelerated a little from September’s growth rate of 0.3% to 0.5%.
The Conference Board’s Senior Director of Economic Research, Ataman Ozyildirim, said the US economy will “end the year on a weak note” with a growth rate of a little under 2%. He said the labour market had softened and “conditions in manufacturing remain weak and show no signs of improvement yet.”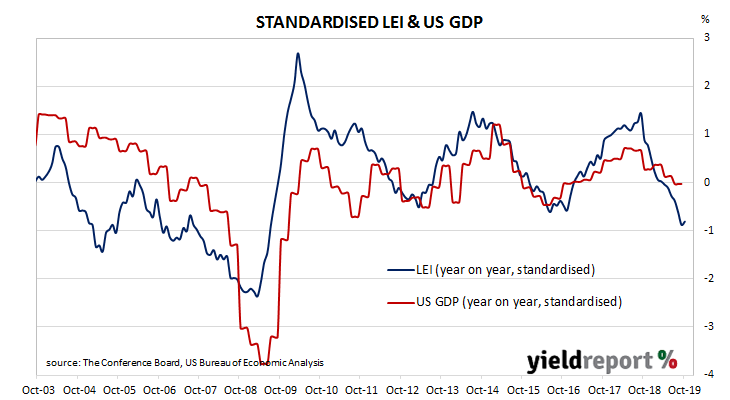
Changes over time can be large but once they are standardised, a clearer relationship with GDP emerges. The latest reading implies a year-on-year growth rate of just 1.3% at the end of the March 2020 quarter.
20 November 2019
Westpac and the Melbourne Institute describe their Leading Index as a composite measure which attempts to estimate the likely pace of Australian economic activity over the next three to six months. After reaching a peak in early 2018, the index headed lower through 2018 and the first few months of 2019. It then recovered for a few months before turning down again.
The latest six month annualised growth rate of the indicator has increased from September’s revised figure of –1.01% to -0.91% in October. 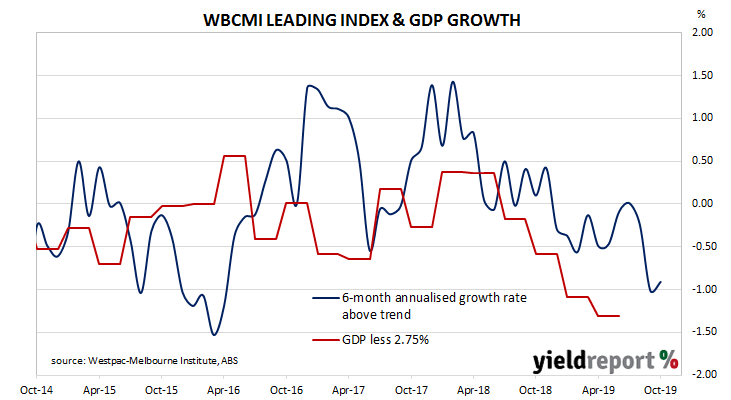
Westpac chief economist Bill Evans said, “Despite a slight improvement in the month, the Leading Index growth rate remains materially below trend and continues to point to weak economic momentum carrying well into 2020.”
Index figures represent rates relative to trend-GDP growth, which is generally thought to be around 2.75% per annum. The index is said to lead GDP by three to six months, so theoretically the current reading represents an annualised GDP growth rate of around 1.70% in early-to-mid 2020.

