30 October 2019
While the US has a historically low unemployment rate, bond yields suggest future growth rates will be below trend. The US Fed has been cutting rates as a form of insurance against a softening external sector and the yield curve is close to being flat after having been inverted for a short period according to at least two measures. While US GDP growth figures have softened through the first half of calendar 2019, they have been far from recessionary.
The US Commerce Department has now released September quarter “advance” GDP estimates and they indicate the US economy grew at an annualised growth rate of 1.9%. The growth figure was more than the 1.6% expected but it represents a minor reduction from the June quarter’s revised figure of 2.0%.
NAB senior economist David de Garis described the increase as a surprise which had come about as a result of “slightly stronger consumption growth”. Overall, the figures were “consistent with the moderation in a broad range of US economic indicators this year.”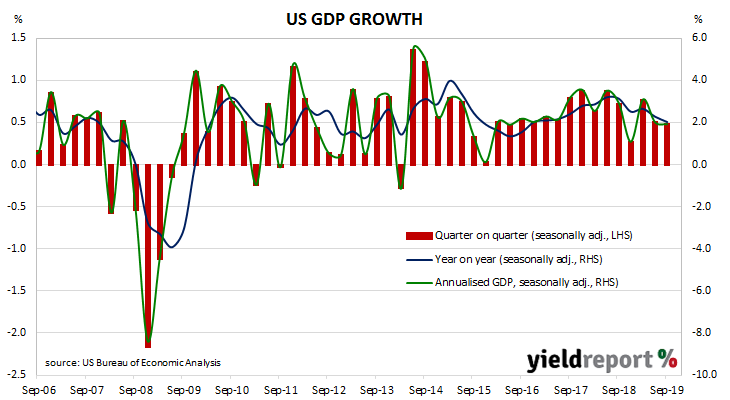
The report came out on the same day as the ADP’s employment report and on the same day the FOMC cut the federal funds target range by 25bps. US Treasury bond yields moved lower, especially at the long end. By the end of the day, 2-year Treasury bond yields were 4bps lower at 1.60% while 10-year and 30-year yields had each lost 7bps to 1.77% and 2.26% respectively.
30 October 2019
The ADP National Employment Report is published monthly by the ADP Research Institute. The report provides an estimate of US non-farm employment in the private sector. Since the report began to be published in 2006, its total private sector non-farm employment figures have exhibited a high correlation with the Bureau of Labor Statistics (BLS) non-farm payroll figures which are typically published a day or two later.
The latest figures indicate private sector employment grew by 125,000 in October, above the expected figure of 116,000. The new figure represent an improvement from September’s increase of 93,000 but only after that month’s increase was revised down by 37,900.
NAB senior economist David de Garis described the result as “a small upside surprise” but he also noted the ADP indicator as having “a mixed track record with forecasting recent payrolls results.”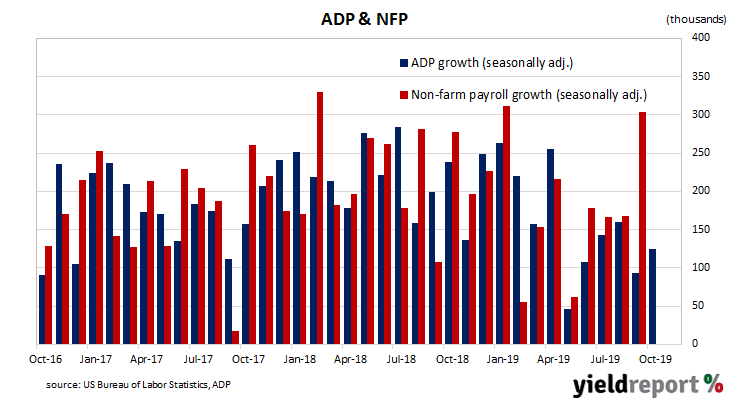
The report came out on the same day as the September quarter’s GDP figures and on the same day the FOMC cut the federal funds target range by 25bps. US Treasury bond yields moved lower, especially at the long end. By the end of the day, 2-year Treasury bond yields were 4bps lower at 1.60% while 10-year and 30-year yields had each lost 7bps to 1.77% and 2.26% respectively.
30 October 2019
The US was at the heart of what became known as the “Global Financial Crisis” in 2008/2009. As the US economy fell into a deep recession, the Federal Reserve rapidly cut its interbank overnight lending target range to 0%-0.25%. It left this target range close to zero for over seven years until it began to “normalise” interest rates through 2016, 2017 and 2018. However, in early-2019, it was spooked by prospects of a slowing global economy, falling bonds yields and the beginnings of the US-China trade dispute. Shortly thereafter, the Fed began to flag a change in its policy and markets become accustomed to the idea of future rate cuts. The first cut in the cycle arrived in July, with another one coming in September.
As widely expected, the Federal Reserve cut its overnight interest rate target by 25bps at its latest monetary policy meeting. The Fed’s interest rate setting committee, known as the Federal Open Markets Committee (FOMC), reduced the Federal Funds target range from 1.75%-2.00% to 1.50%-1.75%.
ANZ economist Kishi Sen said the statement which announced the decision was different from recent ones. “Interestingly, unlike previous statements, the Fed offered a more neutral statement to the market. It highlighted a moderating growth environment and despite a pullback in non-farm payrolls, it remains optimistic on the US jobs market.”
Westpac’s finance AM team seemed to disagree at first but they too noted a change, saying “The statement was largely a copy of September’s, with the main change being the removal of the phrase “act as appropriate”, saying instead it will “assess the appropriate path….”. Westpac also noted another cut was not flagged but the Fed “retained the optionality to do so.”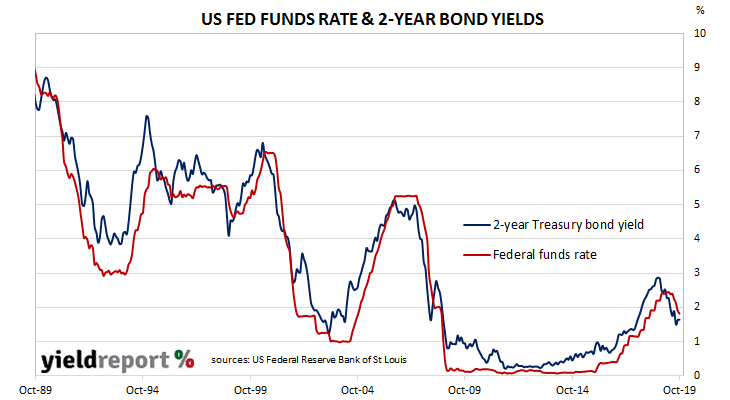
28 October 2019
US consumer confidence collapsed in late 2007 as the US housing bubble burst and the US economy went into recession. By 2016, it had clawed its way back to neutral and then went from strength to strength until late 2018. Since then, measures of consumer confidence have oscillated within a fairly narrow band while maintaining historically high levels. The most recent figures have continued in this manner.
The latest Conference Board survey indicates US consumers remained very optimistic, largely ignoring trade disputes and presidential politics. October’s Consumer Confidence Index registered 125.9, a small fall from September’s final figure of 126.3 and below the consensus figure expected. Consumers’ views of present conditions improved from those held at the time of the September survey but they were also less positive with regards to future conditions than a month ago.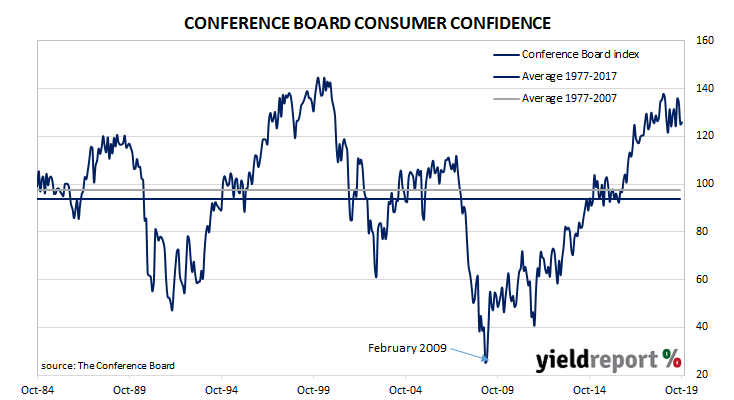
The consensus expectation prior to the report was for a reading of around 128.0 but US Treasury yields increased across the yield curve while expectations of rate cuts firmed. By the end of the day, 2-year yields had gained 2bps to 1.65% while 10-year and 30-year yields had both increased by 4bps to 1.84% and 2.33% respectively. In terms of likely US monetary policy, according to federal funds futures contracts the likelihood of a rate cut at the FOMC’s October meeting increased from 94% to 95%.
23 October 2019
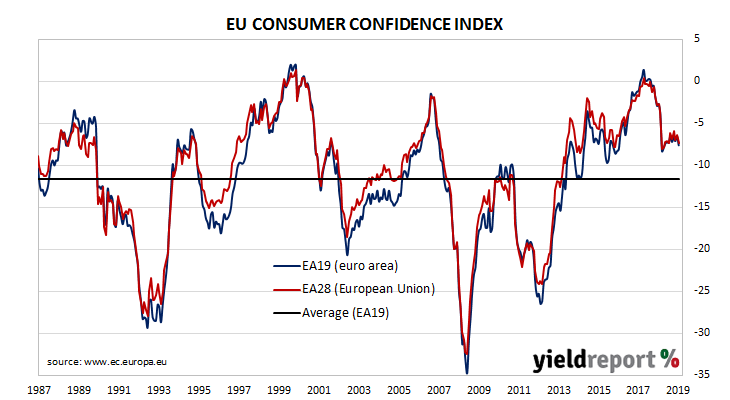
EU consumer confidence plunged during the GFC and again in 2011/12 during the European debt crisis. Since early 2014, it has been at average or above-average levels, rising to a cyclical peak at the beginning of 2018. However, it dropped back significantly in late 2018, albeit to still-elevated levels, at about the same time as doubts emerged over the US economy’s robustness. Since then, it has slowly been recovering in fits and starts.
The October survey conducted by the European Commission indicates household confidence in the European Union has given back all of September’s rise, plus a bit more. The latest published measure of Consumer Confidence index produced a figure of -7.6, indicating households were less confident than in September when the index recorded -6.5. The average reading since the beginning of 1985 has been -11.6.
ANZ FX Strategist John Bromhead said the figures are “a worrying sign” for the EU economy “given recent weakness in manufacturing and trade.”
17 October 2019
The Federal Reserve’s industrial production (IP) index measures real output from manufacturing, mining, electricity and gas company facilities located in the United States. These sectors are thought to be sensitive to consumer demand and so some leading indicators of GDP use industrial production figures as a component. A month ago, IP figures had suggested some chance of an end to a recent run of months in which US production has gone backwards. Figures from the latest report indicated that view was probably premature.
According to the latest figures released by the Fed, US industrial production slumped by 0.4% in September, less than the 0.2% fall which had been expected and a noticeable turnaround from August’s revised growth rate of +0.6%. On an annual basis, growth in industrial production slowed from August’s revised rate of +0.4% to -0.1%.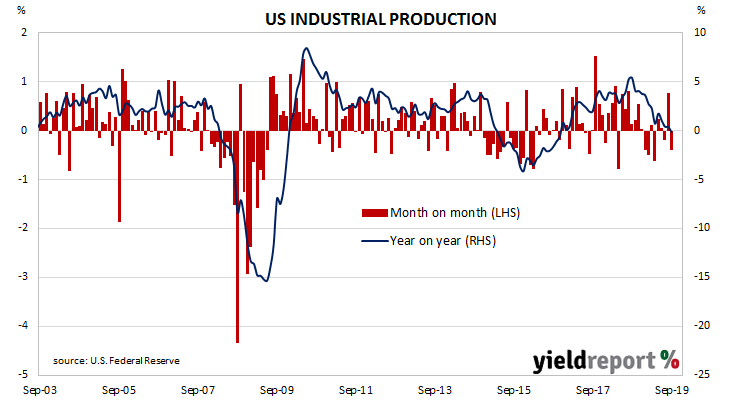
Westpac’s Finance AM team said the figures “appeared softer but much of that was due to upward revisions to the prior month.” Over at NAB, currency strategist Rodrigo Catril was less forgiving. “Industrial production was weak, not helped by the GM strike but even excluding that the manufacturing sector looks fragile.”
Treasury bond yields finished the day a touch higher, moving the yield curve consistently up. By the close of business, 2-year, 10-year and 30-year US Treasury yields had all inched up 1bp to 1.59%, 1.75% and 2.24% respectively.
16 October 2019
Westpac and the Melbourne Institute describe their Leading Index as a composite measure which attempts to estimate the likely pace of Australian economic activity over the next three to six months. After reaching a peak in early 2018, the index headed lower through 2018 and into 2019 until it hit a short-term trough in February. That low has now been breached.
The latest six-month annualised growth rate of the indicator has fallen from August’s revised figure of -0.24% to -0.92% in September. Nine out of the last ten readings have been negative.
Index figures represent rates relative to trend-GDP growth, which is generally thought to be around 2.75% per annum. The index is said to lead GDP by three to six months, so theoretically the current reading represents an annualised GDP growth rate of around 1.80% in early-to-mid 2020.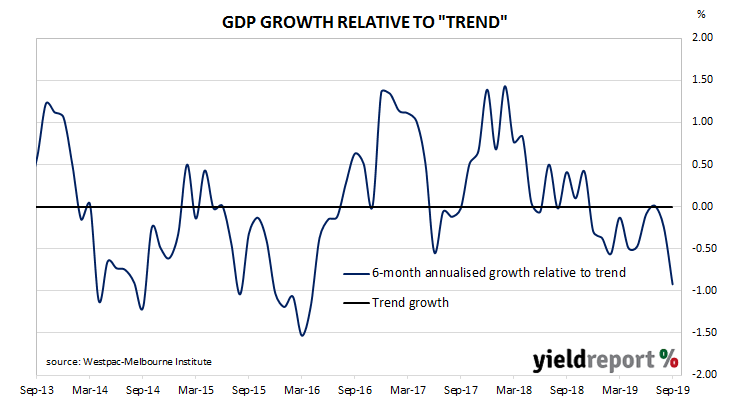
16 October 2019
US retail sales had been trending up since late 2015 but, beginning in late 2018, a series of weak or negative monthly results led to a drop-off in the annual growth rate which brought the annual rate below 2.0% by the end of the year. After an unsteady start to 2019, subsequent months’ figures have produced a recovery and expansion which prevailed into the third quarter of the year. However, the most-recent figures do not exactly fit in with this theme.
According to the latest “advance” sales numbers released by the US Census Bureau, total retail sales contracted by 0.3% in September, well under the +0.3% which had been expected and much lower than August’s growth rate which was revised up from +0.4% to +0.6%. On an annual basis, the growth rate slowed to 4.1% from August’s revised rate of 4.3%.

US Treasury yields finished a few basis points lower on the day. By the close of business, 2-year and 10-year yield Treasury yields had both lost 3bps to 1.58% and 1.74% respectively while the 30-year yield remained unchanged at 2.23%.
Expectations of another cut in the federal funds rate at the upcoming FOMC meeting at the end of October firmed considerably. According to end-of-day prices of federal funds futures, the implied probability of a 25bps rate cut increased from the previous day’s 74% to 90%.
15 October 2019
The RBA reduced its official cash rate target for the third time in 2019 at its October board meeting. The rate at which the RBA wishes banks to lend to each in the market for unsecured overnight loans was lowered from 1.00% to 0.75%.
Around February of this year, the RBA began to publicly move away from a tightening bias. By April, “there was not a strong case for a near-term adjustment in monetary policy” and, by May, the transformation to an easing bias had been completed. In June, a 25bps rate cut was announced and another one followed in July.
The RBA then took a breather and no changes were made at the RBA’s August and September board meetings. However, it then moved again at its October meeting.
The minutes of that meeting have now been released and the board’s deliberations focussed on a rationale for a rate cut. While some members were “mindful” of various factors which may present reasons not to lower the cash rate target, they “concluded that these various factors did not outweigh the case for a further easing of monetary policy at the present meeting.”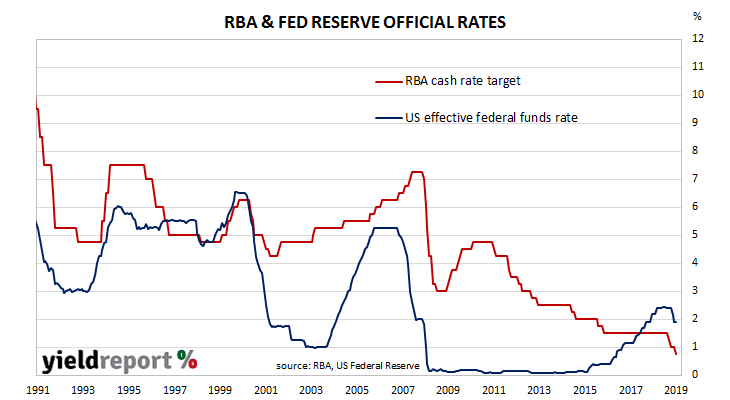 One interesting observation which arose out of the minutes relates to the effect of lower interest rates on asset prices. The minutes noted the possibility “prices might be overly inflated by lower interest rates.” However, as far as the RBA is concerned, higher prices provide the incentive for people to build and invest. “Members acknowledged that asset prices were part of the transmission mechanism of policy, including by encouraging home building.” It seems the RBA would only be concerned “if rapidly increasing asset prices were accompanied by materially faster credit growth, weak lending standards and rising leverage.”
14 October 2019
As with other countries’ measures of industrial production, Eurostat’s industrial production index measures the output and activity of industrial sectors, except in its case, it does so with countries in the European Union. Following a recession in 2009/2010 and the resultant European debt-crisis of 2010-2012, euro-zone industrial production began to recover until a peak was reached four years later in early-2016. Growth rates then slowed through the rest of 2016, accelerated during 2017 and then began a steady slowing which has lasted through to mid-2019.
According to the latest figures released by Eurostat, euro-zone industrial production increased by a seasonally-adjusted 0.4% in August, higher than the 0.3% increase which had been expected and a reversal of July’s -0.4%. However, on an annual basis, seasonally-adjusted growth in industrial production slowed even further from July’s revised rate of -1.9% to -2.6*% in August.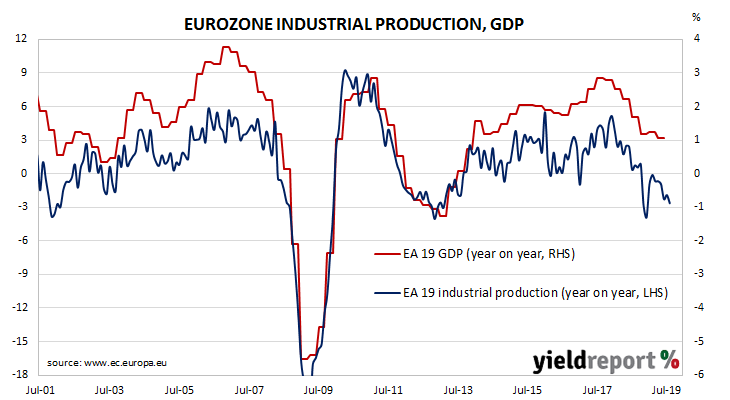
The main drivers of the euro-zone, France and Germany, posted very different results for the month. Industrial production in Germany expanded by +0.6% while it contracted by 0.8% in France. In Spain and Italy the comparable figures were +1.1% and +0.3% respectively.

