11 October 2019
US consumer confidence started 2019 at well above average levels in a longer-term context, although readings were markedly lower than those which typified most of the previous year. Since then, surveys have generally indicated US households have maintained historically-high levels of confidence except for two short-lived plunges; one at the very start of the year and one recently in August.
The latest survey conducted by the University of Michigan indicates the average confidence level of US households has increased for a second consecutive month. The University’s preliminary estimate of its Index of Consumer Sentiment increased from September’s final figure of 93.2 to 96.0 in October, ahead of the consensus figure of 92.
The University’s Surveys of Consumers chief economist, Richard Curtin, said, “Overall, the data indicate that consumption spending will be strong enough to offset weakness in business investment spending so as to keep the economy expanding into 2020.”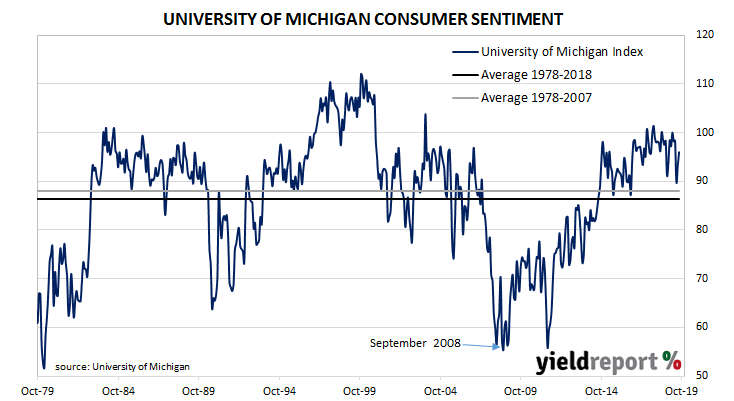
US Treasury yields finished higher on the day, helped by news of a partial trade with China. By the close of business, 2-year Treasury yields had increased by 5bps to 1.59%, the 10-year yield had gained 6bps to 1.73% and 30-year yields had added 4bps to 2.20%.
10 October 2019
Since late 2017/early 2018, a very clear downtrend has been evident in the monthly figures of both the number and value of home loan commitments. This downtrend lasted through to June 2019 when the RBA cut its cash rate target from 1.50% to 1.25%. The RBA then reduced its target again in July; coincidentally or otherwise, approvals figures jumped.
August’s housing finance commitment figures have now been released and the total number of loan commitments to owner-occupiers increased by 1.8%, less than the expected 2.5% increase and less than July’s revised figure of +5.5%. On an annual basis, the growth rate improved for a second consecutive month from July’s revised figure of -7.6% to -3.7%. When “re-financings” are removed, the number of loan commitments increased by 0.7% over the month but they contracted by 5.1% when compared to August 2018’s figure.
ANZ economist Adelaide Timbrell said, “The effects of June/July rate cuts and APRA changes have continued to flow through to housing finance. Investor lending drove this result, growing [by] 5.7% in August, the strongest result since September 2016.”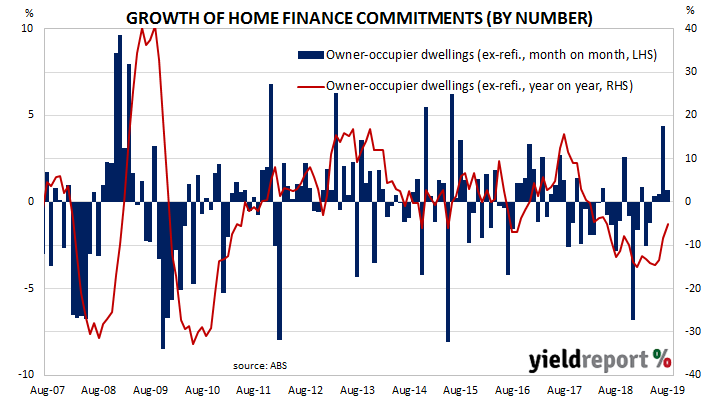 Despite increases in US bond yields overnight, Australian bond yields hardly changed. By the end of the day, the yield on 3-year ACGBs remained unchanged at 0.57%, while 10-year and 20-year yields had both crept up 1bp to 0.89% and 1.31% respectively.
10 October 2019
The annual rate of US consumer inflation halved from nearly 3% in the period from July 2018 to February 2019 and then subsequently fluctuated in a range from 1.5% to 2.0%. However, “headline” inflation is known to be volatile and so references are often made to “core” inflation figures for purposes of analysis. This measure has mostly ranged between 1.7% and 2.3% in recent years and it has not been below 2.0% since early 2018. It hit a new post-GFC high just recently.
The latest consumer price index (CPI) figures released by the Bureau of Labor Statistics indicated seasonally-adjusted consumer prices remained unchanged on average in September, less than the 0.1% increase which had been expected and less than August’s 0.1% increase. On a 12-month basis, the inflation rate slipped from August’s annual rate of 1.8% to 1.7%.
NAB currency strategist Rodrigo Catril described the figures as “soft” and said, “hawks within the FOMC are losing important ammunition in order to push back at the prospect of further Fed easing.” (“Hawks” are people who generally favour tighter monetary policy.) Core inflation, a measure of inflation which strips out the volatile food and energy components of the index, increased on a seasonally-adjusted basis by +0.1% for the month, less than the 0.2% which had been expected and less than in the previous three months. Even so, the annual rate remained unchanged at 2.4%.
09 October 2019
The quit rate as a percentage of total US non-farm employment increased slowly but steadily from the end of the GFC. It peaked in August 2018, stabilised and then remained largely unchanged through the remainder of 2018 before it hit a new peak in July 2019.
Figures released as part of the most recent JOLTS report show the quit rate has pulled back from record levels. 2.3% of the non-farm workforce left their jobs voluntarily in August, down from 2.4% in July. The modest slowdown comes after registering 2.3% in each of the previous months from June 2018 through to June 2019.
Quit numbers were highest in the durable goods and real estate (rentals and leasing) sectors while the professional/business services and “other” sectors recorded the largest falls. Overall, the total number of quits for the month decreased from July’s revised figure of 3.668 million to 3.526 million in August. July’s total quits were revised up by 76,000.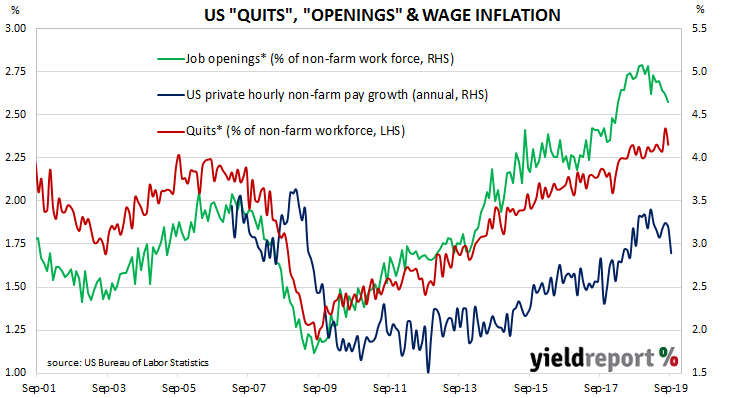
* August
09 October 2019
After a lengthy divergence between consumer sentiment and business confidence in Australia which began in 2014, the two sectors converged again around July 2018. Both measures have been around or under neutral levels in recent months but business sentiment has been falling from a higher base, whereas consumer sentiment has been stagnating at or close to neutral levels for some years. This latest consumer sentiment survey indicates the recent stoicism of households has cracked in the face of global uncertainties and the RBA’s recent actions.
According to the latest Westpac-Melbourne Institute survey conducted over a week in late September and early October, average household optimism has plunged to levels which are approaching the lower boundary of a range which is considered to be “normal”. The Consumer Sentiment Index dropped from 98.2 to 92.8, considerably below the long-term average reading of just over 101. Any reading above 100 indicates the number of consumers who are optimistic is greater than the number of consumers who are pessimistic.
Westpac chief economist Bill Evans said, “The fall comes despite a further 25bps cash rate cut from the RBA at its October meeting, the third rate cut since June, taking the cash rate to a new historical low of 0.75%.”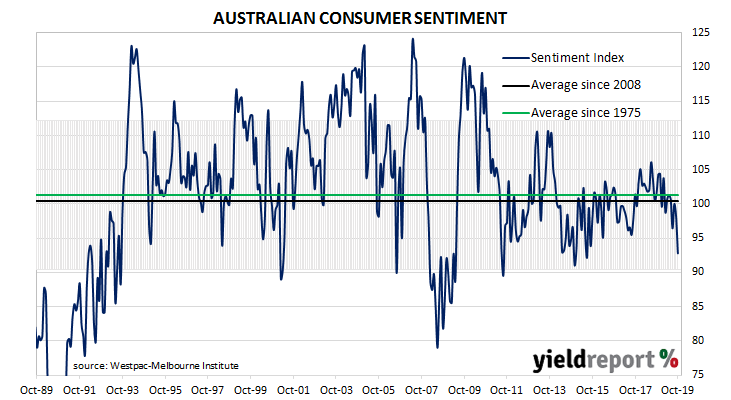
08 October 2019
From mid-2017 onwards, year-on-year growth rates in the total number of Australian job advertisements consistently exceeded 10%. That was until mid-2018 when the annual growth rate fell back markedly and then continued to deteriorate for the remainder of 2018 and into 2019. The latest numbers may be positive but they are far from impressive.
According to the latest ANZ figures, total advertisements increased by just 0.3% in September on a seasonally-adjusted basis, a modest turnaround from August’s 2.6% fall. On a 12-month basis, total job advertisements were 10.4% lower than the same month last year, which is a small improvement from August’s comparable figure of -11.4% after revisions.
ANZ senior economist Catherine Birch said the survey “does not necessarily indicate a turning point in the labour market.” She pointed to the recent increase in the official unemployment rate as well as fewer job vacancies in the latest quarterly ABS report.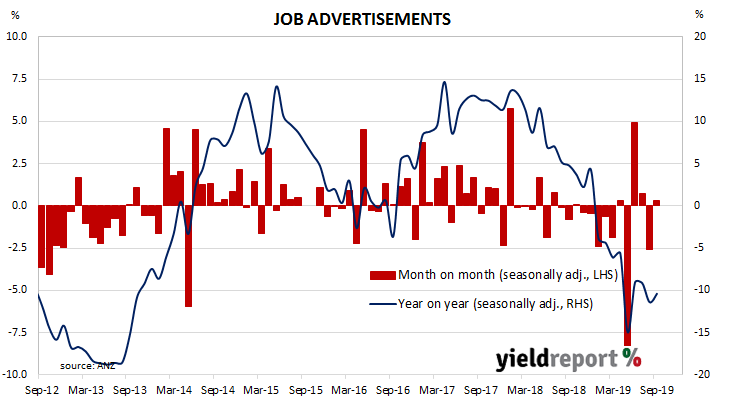 Local markets largely followed higher US treasury yields. By the end of the day, yields on 3-year ACGBs had gained 4bps to 0.58% and the 10-year had increased by 3bps to 0.89%. However, ultra-long bond yields inexplicably slipped 1bp to 1.29%.
08 October 2019
Australian business conditions were robust in the first half of 2018 and a cyclical-peak was reached in April of that year. Although they remained well above average for some months, readings began to slip and by the end of 2018, they had dropped to below-average levels. Forecasts of a slowing domestic economy began to emerge in the first half of 2019 and the last few months’ readings from NAB’s survey have largely been at levels which are consistent with these forecasts.
According to NAB’s latest monthly business survey of 400 firms conducted in the latter half of September, business conditions continued to bump along at below-average levels. Since late 2018, NAB’s conditions index bounced between 3, which is on the low side of normal and 7, which is about average. The index then broke through this lower bound in May 2019. The latest reading registered 2, a modest rise from August’s figure of 1.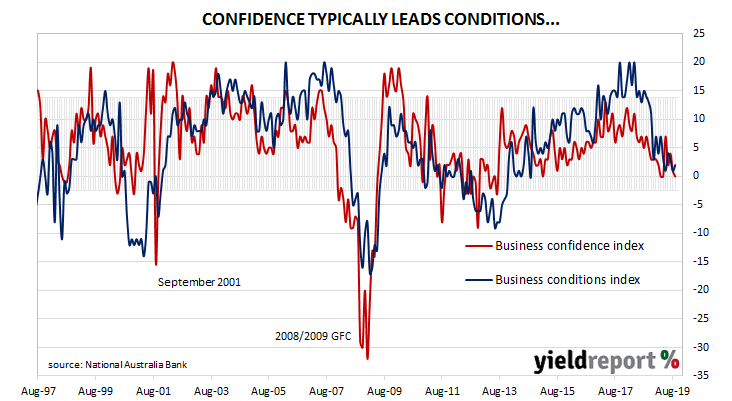 Largely in line with NAB’s condition index, the latest reading of the confidence index slipped from August’s reading of 1 to 0 in September, well below its long-term average reading of 6. Typically, NAB’s confidence index leads the conditions index by approximately one month, although some divergences appear from time to time.
ANZ senior economist Catherine Birch noted the improvement in business conditions was from a low base while the confidence index was at its lowest reading in six years. “There were small improvements across a range of indicators but most remain well below their long-run averages…” She added recent “rate cuts and tax cuts are not having the expected…impact on the private sector in the near-term.”
08 October 2019
Around the end of 2018, the annual rate of prices received by producers began a downtrend which then continued through 2019. A month ago, there was some suggestion this trend may have finished. However, the latest figures have done away with this idea.
The latest figures have been published by the Bureau of Labor Statistics and they indicate producer prices fell by 0.3% after seasonal adjustments in September. The result was less than the expected +0.1% increase and less than August’s +0.1%. On a 12-month basis, the rate of producer price inflation after seasonal adjustments slowed to 1.4% after recording 1.8% in August and 1.7% in July.
“Core” PPI inflation also fell by 0.3%, reversing August’s 0.3% increase. Its annual rate slowed from August’s comparable rate of 2.3% to 1.9%.
ANZ FX strategist John Bromhead said, “The data suggests that firms are absorbing the cost of new tariffs rather than passing them on.”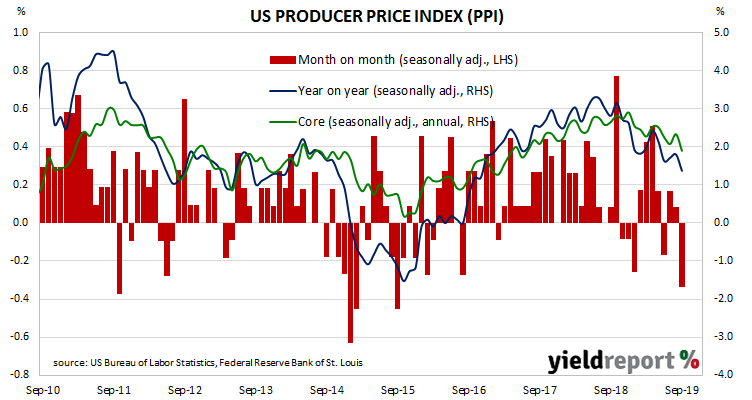
04 October 2019
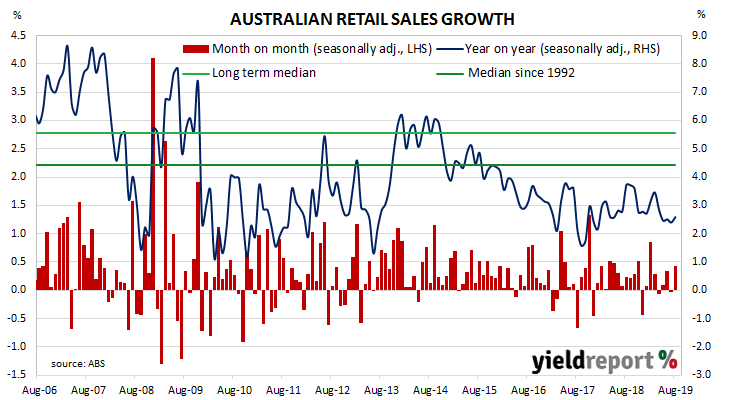
Growth figures of domestic retail sales have been declining since 2014 and they reached a low-point in September 2017 when they registered a growth rate of just 1.5%. They then began increasing for about a year, only to stabilise at around 3.0% to 3.5% through late 2018. 2019 has produced a number of low-growth months along with the odd surprisingly strong result, lowering the annual growth rate. The latest figures are largely in line with this pattern.
According to the latest ABS figures, total retail sales increased by +0.4% in August on a seasonally-adjusted basis, a little less than the +0.5% increase which had been expected but an improvement from July’s flat result. On an annual basis, retail sales increased by 2.6%, up from July’s comparable figure of 2.4%.
Westpac senior economist Matthew Hassan said, “While this was broadly in line with the consensus forecast of a 0.5% gain, it is a disappointing result given the scale of the policy stimulus boost to disposable incomes.”
 US Treasury yields had fallen heavily overnight, especially those of 2-year bonds. Local bond yields fell on the day but not as much as their US counterparts. By the end of the day, the yield on 3-year ACGBs had slipped 1bp to 0.57%, the 10-year rate had fallen by 3bps to 0.89% and 20-year yields had shed 5bps to 1.30%.
In the cash futures market, the implied probability of a 25bps cut at the RBA’s November meeting remained at 48% while February contracts continued to fully factor in a rate cut which would take the cash rate target down to 0.50%. End of day prices of May 2020 contracts implied a 57% chance of a 0.25% cash rate, up from the previous day’s 55%.
04 October 2019
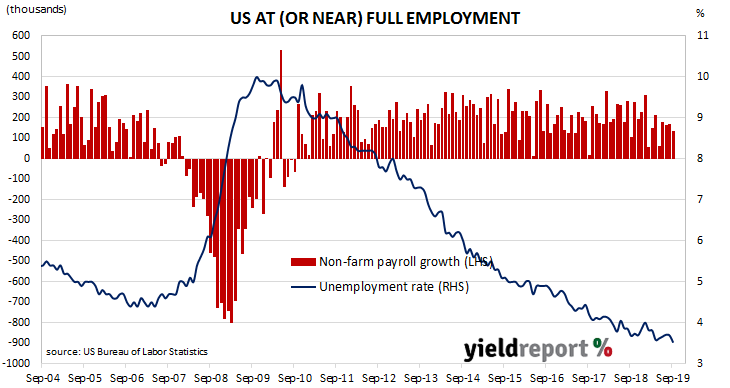
The US economy continues to produce more jobs despite being close to full employment. The unemployment rate has remained at or under 4% since April 2018 and the underemployment rate has fallen under 7%. The latest employment report indicates the US is still producing enough jobs to accommodate an expanding population but annual increases in hourly pay have slowed.
According to the US Bureau of Labor Statistics, the US economy created an additional 136,000 jobs in the non-farm sector in September, less than August’s revised increase of 168,000 and under the 145,000 increase which had been expected. Employment figures for July and August were also revised up by a total of 45,000.
The unemployment rate dropped from August’s rate of 3.7% to 3.5% in September as the total number of unemployed decreased by 275,000 to 5.759 million while the total number of people either employed or looking for work shrank by 275,000 to 164.038 million.
US Treasury yields increased at the short end but slipped a little elsewhere along the yield curve. By the end of the day, 2-year Treasury bond yields had gained 2bps to 1.40% while 10-year and 30-year yields each slipped 1bps to 1.53% and 2.02% respectively.

