02 October 2019
The ADP National Employment Report is published monthly by the ADP Research Institute. The report provides an estimate of US non-farm employment based in the private sector. Since the report began to be published in 2006, its total private sector non-farm employment figures have exhibited a high correlation with the Bureau of Labor Statistics (BLS) non-farm payroll figures which are typically published a day or two later.
The latest figures indicate private sector employment grew by 134,900 in September, a little below the expected figure of 138,000. The new figures represent a deterioration from August’s increase of 156,600 after it was revised down by 37,700.
NAB currency strategist Rodrigo Catril said “amid a heightened level of concern over the resilience of the US consumer, the soft report added another layer to the ongoing market uncertainty.”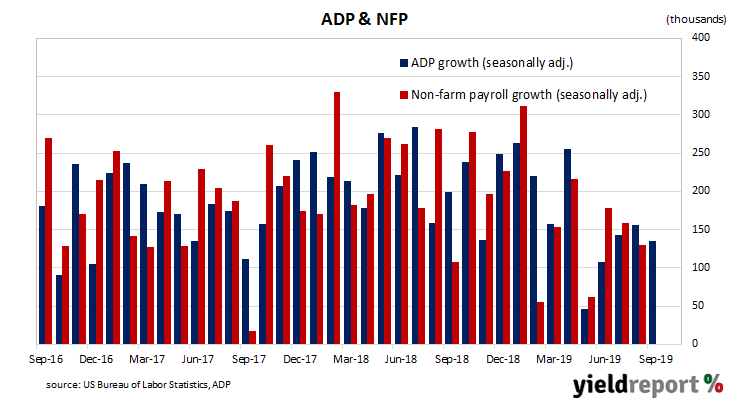 US Treasury bond yields moved lower, especially at the short end where Federal Reserve policy has the greatest effect. By the end of the day, 2-year Treasury bond yields were 6bps lower at 1.48%, the 10-year yield had shed 4bps to 1.60% and the 30-year yield had slipped 1bp to 2.08%.
01 October 2019
US purchasing managers’ indices (PMIs) have been sliding since August 2018, albeit from elevated levels. After reaching a cyclical peak in September 2017, manufacturing PMI readings went sideways for a year before they started a downtrend. The latest reading has continued in this fashion, taking it to troubling levels.
US manufacturing activity has slowed for a sixth consecutive month, taking it further into contractionary territory. According to the latest Institute of Supply Management (ISM) survey, its Purchasing Managers Index recorded a reading of 47.8, down from August’s reading of 49.1 and less than the market’s expected figure of 50.5. The average reading since 1948 is 52.9 and any reading below 50 implies a contraction.
The ISM’s Tim Fiore said “trade remains the most significant issue”, pointing to a contraction in new export orders which began in July.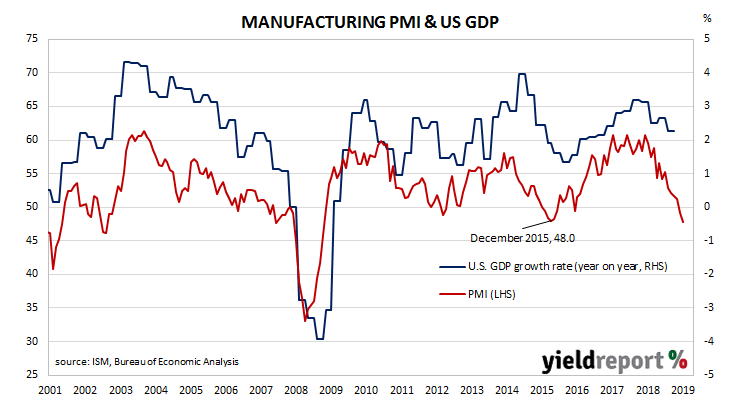 US financial markets responded by sending Treasury yields lower, especially at the short end where the US Fed’s policies have more effect. By the end of the day, 2-year bond yields had fallen by 7bps to 1.54%, 10-year yields were 3bps lower at 1.64% and 30-year yields had lost 2bps to 2.09%.
In terms of likely US monetary policy, according to federal funds futures contracts the implied probability of a 25bps cut or greater at the FOMC’s October meeting increased from 62% to 77%.
01 October 2019
Approvals figures for dwellings, that is apartments and houses, have been heading south since mid-2018. As an indicator of investor confidence, falling approval figures represent a worrying signal, not just for the building sector but for the overall economy. There had been some expectation of a recovery in recent months but quality concerns in the high rise sector appear to be adding a new complication.
The Australian Bureau of Statistics has now released the latestt figures from August and total residential approvals fell by 1.1% on a seasonally-adjusted basis, less than the 2.0% increase which had been expected but a substantial improvement on July’s figure of -9.7%. On an annual basis, total approvals fell by 21.5%, which is also an improvement on July’s comparable figure of -28.2% after revisions.
Westpac senior economist Matthew Hassan said, “Dwelling approvals have yet to form a base. They are now at their lowest level since January 2013 and are below the estimated level of underlying requirements. A key concern is further downside risks to the high-rise segment.”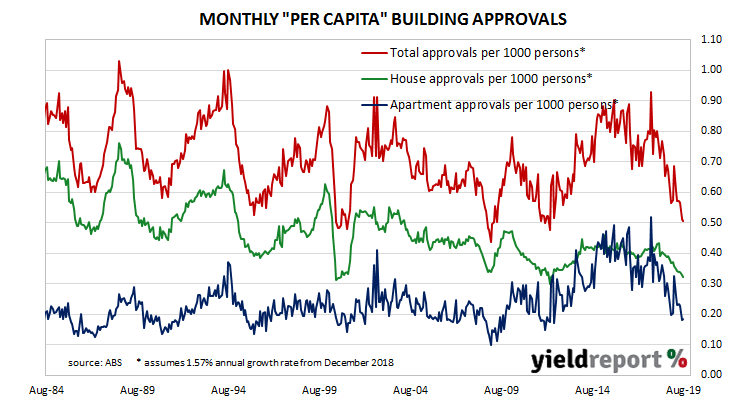
30 September 2019
The RBA’s stated objective is to achieve an inflation rate of between 2% and 3%, “on average, over time.” Since the GFC, Australia’s inflation rate has been trending lower and lower and it has been below the RBA’s target band for some years now. Despite the RBA’s desire for a higher inflation rate, its attempts to accelerate inflation through record-low interest rates have failed so far. The latest unofficial measurement of consumer inflation is unlikely to provide Australian policy makers with new evidence of inflationary pressures.
The Melbourne Institute’s latest Inflation Gauge index increased by 0.1% in September after a flat result in August and a 0.3% increase in July. On an annual basis, the index increased by 1.5%, slowing from August’s 1.7%.
Despite slightly lower US Treasury yields in overnight trading, local yields increased noticeably, although August’s bank lending figures will have had some bearing. By the end of the day, 3-year ACGB yields had increased by 3bps to 0.70% while 10-year and 20-year yields had both jumped by 7bps to 1.01% and 1.43% respectively.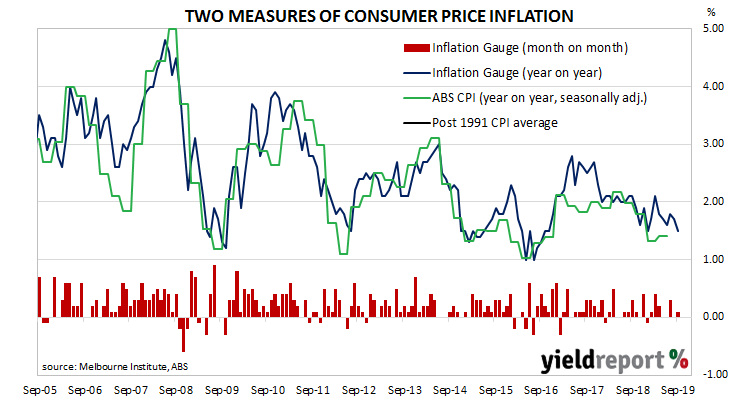
30 September 2019
The pace of lending to the non-bank private sector by financial institutions in Australia has been trending down since October 2015. It appeared to have stabilised in the September quarter of 2018 but then subsequent credit figures put paid to that idea. Despite some optimism emerging in the housing market following the re-election of the Coalition Government in May, lending figures are not indicative of any rush in recent months to draw upon finance facilities.
According to the latest RBA figures, private sector credit grew by 0.2% in August, less than the expected +0.3% but the same as July’s +0.2%. Once again, the annual growth rate slipped, this time from July’s figure of 3.1% to 2.9%. Lending to owner-occupiers and business remained subdued while investor lending moved a little closer to going into a contraction.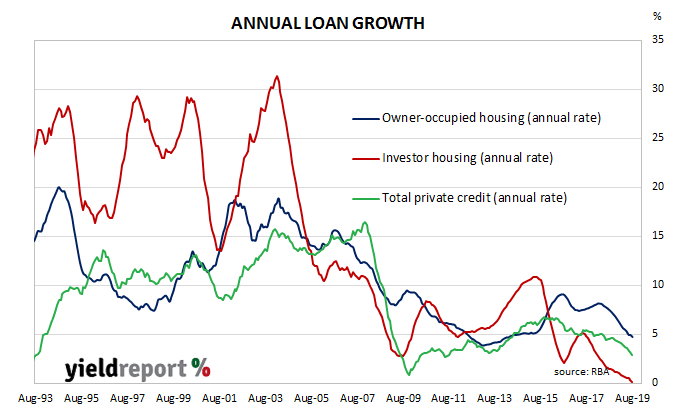 Despite slightly lower US Treasury yields in overnight trading, local yields increased noticeably, although the Westpac-Melbourne Institute’s latest Inflation Gauge may have muddied the waters to some degree. By the end of the day, 3-year ACGB yields had increased by 3bps to 0.70% while 10-year and 20-year yields had both jumped by 7bps to 1.01% and 1.43% respectively.
Prices of cash futures contracts were largely unmoved by the report and a rate cut was still expected in the short term. By the end of the day, October contracts implied a 79% chance of a 25bps rate cut, the same as on the previous day, while November contracts still fully factored in one rate cut plus a 14% chance of another cut as well.
The traditional driver of loan growth rates, the owner-occupier segment, slowed to +0.3% in August from July’s +0.5%. Its 12-month growth rate also slowed as it fell back to 4.7% after recording 4.9% in July.
27 September 2019
One of the US Fed’s favoured measures of inflation is the change in the core personal consumption expenditures (PCE) price index. After hitting the Fed’s target at 2.0% in mid-2018, the annual rate then hovered in a range between 1.8% and 2.0% through to the end of 2018 before dropping in the first quarter of 2019. It then hovered around 1.5% or just above it for some months before moving higher recently.
The latest figures have now been published by the Bureau of Economic Analysis as part of the August personal income and expenditures report. Core PCE inflation was +0.1% for the month, in line with expectations but less than July’s +0.2%. However, on a 12-month basis, the core PCE inflation rate ticked up from July’s revised rate of 1.7% to 1.8%.
ANZ economist Jack Chambers said, “The rise, whilst still below the Fed’s 2.0% target, will be a welcome move in the right direction by US policymakers.”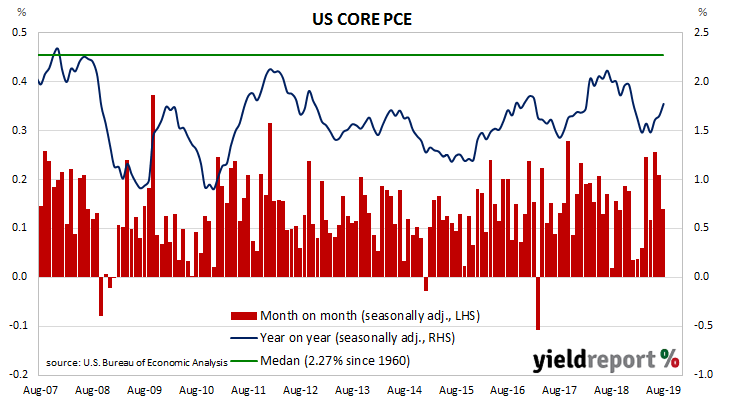
US Treasury yields finished the day a little lower across the curve. By the end of the day, 2-year yields had lost 2bps to 1.64%, 10-year yields slipped 1bp to 1.69% and 30-year yields had lost 2bps to 2.13%.
In terms of likely US monetary policy, according to federal funds futures contracts the probability of a rate cut at the October meeting of the FOMC remained close to a 50/50 bet. December contracts implied a slightly higher chance of a rate cut from that of the previous day; at the end of the day a third rate cut in 2019 crept up from 69% to 70%.
24 September 2019
US consumer confidence collapsed in late 2007 as the US housing bubble burst and the US economy went into recession. By 2016, it had clawed its way back to neutral and then went from strength to strength until late 2018. Since then, measures of consumer confidence have oscillated within a fairly narrow band at historically high levels. The most recent figures have continued this pattern despite the presence of international geopolitical tensions and a jump in the price of oil.
The latest Conference Board survey indicates US consumers remained very optimistic even after a substantial fall in its Consumer Confidence Index. September’s index reading came in at 125.1, a sharp fall from August’s final figure of 134.2 and substantially below the consensus forecast figure of 133.5. Consumers’ views of present and future conditions deteriorated from those held at the time of the August survey.
Westpac noted the lower than expected figure but said the index “still remain at relatively high post-crisis levels.”
The consensus expectation prior to the report was for a reading of around 134 and US Treasury yields still fell hard across the yield curve while expectations of further rate cuts hardened. By the end of the day, 2-year yields had fallen by 5bps to 1.63%, the 10-year yield had lost 8bps to 1.65% and the 30-year yield had dropped by 7bps to 2.11%. In terms of likely US monetary policy, according to federal funds futures contracts the likelihood of a rate cut at the FOMC’s October meeting increased from 45% to 56%.
20 September 2019
EU consumer confidence plunged during the GFC and again in 2011/12 during the European debt crisis. Since early 2014, it has been at average or above-average levels, rising to a cyclical peak at the beginning of 2018. However, it dropped back significantly in late 2018, albeit to still-elevated levels, at about the same time as doubts emerged over the US economy’s robustness. Since then, it has slowly been recovering in fits and starts. The latest survey of euro-zone households indicates this process has continued.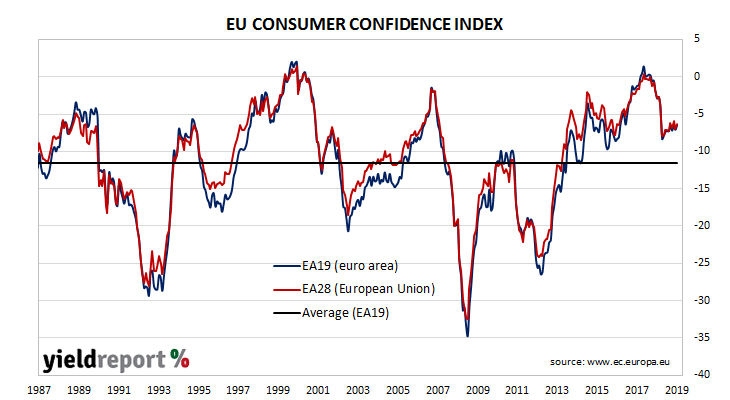
The September survey conducted by the European Commission indicates EU household confidence has recovered all of August’s fall while remaining comfortably above the 30-year average. The latest published measure of Consumer Confidence index produced a figure of -6.5, indicating households were more confident than in August when the index recorded -7.1.
19 September 2019
The Conference Board Leading Economic Index (LEI) is a composite index which is composed of ten indices which are thought to be sensitive to changes in the US economy. The Conference Board describes it as an index which attempts to signal peaks and troughs and turning points in the index have historically occurred prior to changes in aggregate economic activity. Recently, month on month changes in the LEI have produced flat or negative results, interspersed with the odd spike. The latest report contains more of the former rather than the latter.
The Leading Economic Index remained flat in August, less than the expected +0.1% and a marked drop from July’s revised figure of +0.4%. As such, on an annual basis the LEI slowed down from July’s growth rate of 1.8% to 1.3%.
Changes over time can be large but once they are standardised, a clearer relationship with GDP emerges.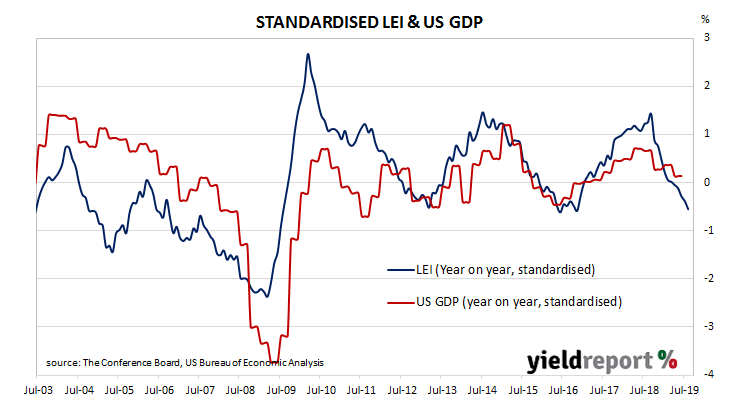
Ataman Ozyildirim, Senior Director of Economic Research at The Conference Board said, “The recent trends in the LEI are consistent with a slow but still expanding economy, which has been primarily driven by strong consumer spending and robust job growth.”
18 September 2019
Westpac and the Melbourne Institute describe their Leading Index as a composite measure which attempts to estimate the likely pace of Australian economic activity over the next three to six months. After reaching a peak in early 2018, the index headed lower through 2018 and into 2019 until it troughed in February. Since then, the index has shown signs of recovery, only to be reversed a month or two later.
The latest six-month annualised growth rate of the indicator has fallen back from July’s revised figure of +0.01% to -0.35% in August. These figures represent rates relative to trend-GDP growth, which is generally thought to be around 2.75% per annum. The index is said to lead GDP by 3 to 6 months, so theoretically the current reading represents an annualised GDP growth rate of around 2.40% in late 2019 and/or early 2020.
Westpac chief economist Bill Evans said, “The relapse confirms the consistent signal from most of those preceding months that the economy will continue to be operating at a below trend growth pace into late 2019 and early 2020.” He pointed to falls in the share market, lower commodity prices and fewer dwelling approvals as the major causes.
Commonwealth Government bond yields finished the day a touch higher, in spite of 4-5bps falls along the US Treasury curve in overnight trading. By the end of the day, 3-year ACGB yields remained unchanged at 0.83% while 10-year and 20-year yields had each inched up 1bp to 1.14% and 1.54% respectively.

