06 September 2019
The US economy continues to produce more jobs despite being close to full employment. The unemployment rate has remained at or under 4% since April 2018 while annual increases in hourly pay have remained above 3% for eleven consecutive months. This latest employment report indicates the US still has an expanding labour market, in spite of international trade worries and a central bank which has just cut its official rate.
According to the US Bureau of Labor Statistics, the US economy created an additional 130,000 jobs in the non-farm sector in August, less than July’s revised increase of 159,000 and under the 165,000 increase which had been expected. Employment figures for June and July were also revised down by a total of 20,000.
The unemployment rate remained unchanged at July’s rate of 3.7% as the total number of unemployed decreased by 19,000 to 6.044 million while the total number of people either employed or looking for work increased by 571,000 to 163.92 million.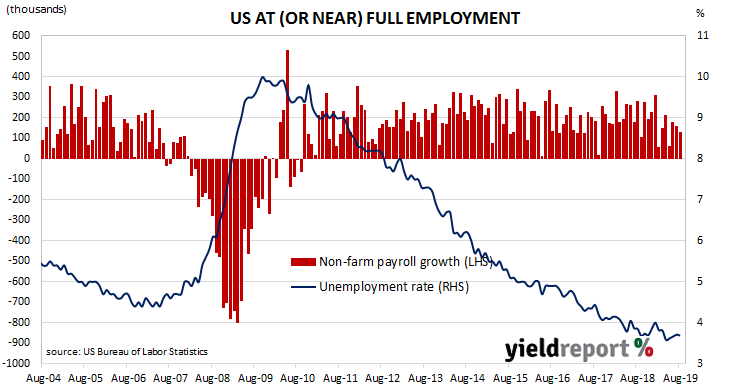
US Treasury yields increased at the short end but remained unchanged or even fell elsewhere on the yield curved. By the end of the day, 2-year Treasury bond yields had gained 2bps to 1.54%, 10-year yields remained unchanged at 1.56% while 30-year yields finished 2bps lower at 2.03%.
05 September 2019
The ADP National Employment Report is published monthly by the ADP Research Institute. The report provides an estimate of US non-farm employment based in the private sector. Since the report began to be published in 2006, its total private sector non-farm employment figures have exhibited a high correlation with the Bureau of Labor Statistics (BLS) non-farm payroll figures which are typically published a day or two later.
The latest figures indicate private sector employment grew by 195,000 in August, well above the expected figure of 143,000. The new figures represent an improvement on July’s increase of 141,600 after it was revised down by 14,000.
Westpac described the report’s figures as “underscoring ongoing US labour market resilience.”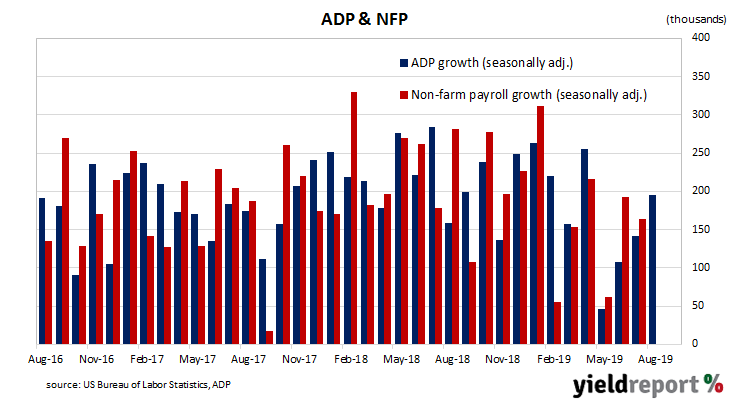
The report came on the same day as China announced it was willing to resume trade discussions with the US in early October. Equity markets rallied and US Treasury bond yields moved noticeably higher. By the end of the day, 2-year Treasury bond yields were 8bps higher at 1.52%, the 10-year yield gained 9bps to 1.56% and the 30-year yields increased by 8bps to 2.05%.
In terms of Federal Reserve monetary policy, the likelihood of rate cuts in the near time remained high. The implied probability of a 25bps cut or greater at the FOMC’s September meeting remained at 100% but the likelihood of another additional cut at the December meeting fell from 86% to 82%.
03 September 2019
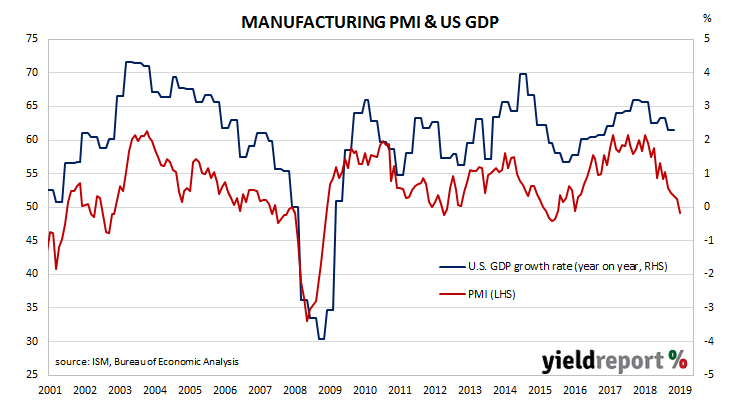
US purchasing managers’ indices (PMIs) have been sliding since August 2018, albeit from elevated levels. After reaching a cyclical peak in September 2017, manufacturing PMI readings went sideways for a year before they started a downtrend. The latest reading has continued this trend.
US manufacturing activity has slowed for a fifth consecutive month, taking it to a level which is defined as contractionary. According to the latest Institute of Supply Management (ISM) survey, its Purchasing Managers Index recorded a reading of 49.1, down from July’s reading of 51.2 and less than the market’s expected figure of 51.5. The average reading since 1948 is 52.9 and any reading below 50 implies a contraction.
NAB economist Tapas Strickland said, “The slide below 50 means that US manufacturing is moving more in line with an evident global manufacturing recession, as depicted by the JPM Global Manufacturing PMI, which came in at 49.5 for August from 49.3, having fallen below 50 back in May.”
He said the figures will have implications for US monetary policy and the US dollar. “How the Fed now responds to the news that a bellwether economic indicator has turned south will be key in whether markets start to price more aggressive easing and, in turn, whether the higher US dollar, which continues to be an additional headwind to US economies on the global stage, now stabilises or evens pulls back.”
US financial markets responded by sending Treasury yields lower while expectations of US rate cuts hardened. US Treasury bond yields fell, especially at the short end and, by the end of the day, 2-year bond yields had fallen by 5bps to 1.46%, 10-year yields were 4bps lower at 1.46% and 30-year yields had slipped 1bp to 1.95%. In terms of likely US monetary policy, according to federal funds futures contracts the implied probability of a 25bps cut or greater at the FOMC’s September meeting increased from 95% to 100% while the likelihood of another additional cut at the December meeting remained at 86%.
03 September 2019
Growth figures of domestic retail sales have been declining since 2014 and they reached a low-point in September 2017 when they registered a growth rate of just 1.5%. They then began increasing for about a year, only to stabilise at around 3.0% to 3.5% through late 2018. So far, 2019 has produced a number of low-growth months along with the odd surprisingly strong result, lowering the annual growth rate.
According to the latest ABS figures, total retail sales fell by 0.1% in July on a seasonally-adjusted basis, less than the +0.2% increase which had been expected and deterioration from June’s +0.4% increase. On an annual basis, retail sales increased by 2.4%, down a touch from June’s comparable figure of 2.5%.
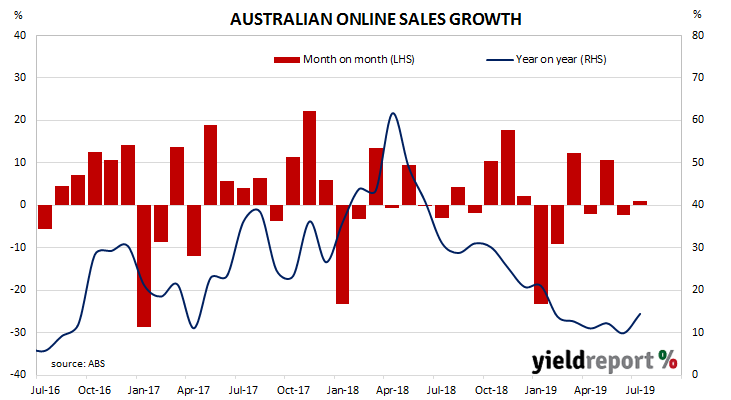
Westpac senior economist Matthew Hassan said, “The result implies little or no boost from recent policy measures; the RBA’s recent interest rate cuts and the Government’s tax offset payments only likely to have started impacting cash flows from late in the month.” These measures should be evident “in the coming months.”
02 September 2019
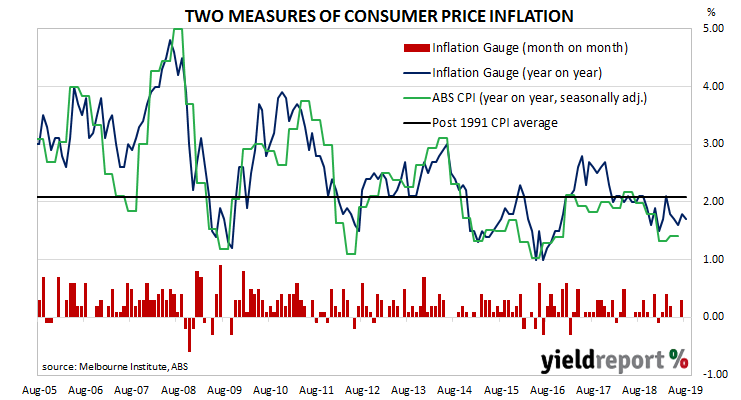
The RBA’s stated objective is to achieve an inflation rate of between 2% and 3%, “on average, over time.” Since the GFC, Australia’s inflation rate has been trending lower and lower and it has been below the RBA’s target band for some years now. Despite the RBA’s desire for a higher inflation rate, its attempts to accelerate inflation through record-low interest rates have failed so far. The latest unofficial measurement of consumer inflation indicates nothing has changed.
The Inflation Gauge index remained unchanged in August after a 0.3% increase in July and a flat result in June. On an annual basis, the index increased by 1.7%, slowing from July’s comparable rate of 1.8%.
Local markets ignored lower US treasury yields from overnight trading and Commonwealth bond yields increased fairly evenly across the curve, although ANZ’s Job Ads survey probably played a part. By the end of the day, yields on 3-year ACGBs had added 2bps to 0.69% while 10-year and 20-year yields each gained 3bps to 0.92% and 1.32% respectively.
02 September 2019
From mid-2017 onwards, year-on-year growth rates in the total number of Australian job advertisements consistently exceeded 10%. That was until mid-2018 when the annual growth rate fell back markedly and then continued to deteriorate for the remainder of 2018 and into 2019. Figures from May, June and July were suspected of being overly influenced by the timing of Easter, ANZAC Day and the federal election but the latest numbers should be clear of any such effects.
According to the latest ANZ figures, total advertisements fell by 2.8% on a seasonally-adjustment basis, a distinct turnaround from the increases in June and July. On a 12-month basis, total job advertisements were 11.4% lower than last year, a further deterioration in the annual rate from July’s comparable figure of -9.1% after revisions.
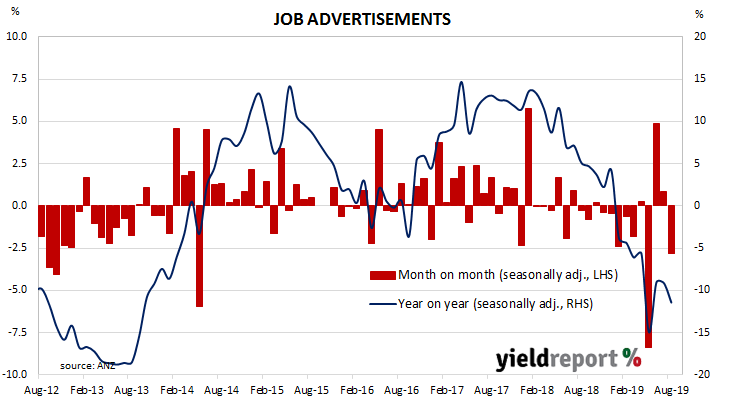
ANZ Head of Australian Economics David Plank said the figures from this survey confirmed his suspicions of the reliability of data from previous months. “We had postulated that the gain in job ads in June and July was a consequence of the holiday and election-related weakness in May, rather than a sign of genuine recovery.”
He also said the figures were consistent with other reports, noting NAB’s Business survey and recent building reports suggested “the outlook for the labour market is softening”. He expects the RBA to cut the cash rate target to 0.75% in October.
30 August 2019
One of the US Fed’s favoured measures of inflation is the change in the core personal consumption expenditures (PCE) price index. After hitting the Fed’s target at 2.0% in mid-2018, the annual rate then hovered in a range between 1.8% and 2.0% through to the end of 2018 before dropping in the first quarter of 2019. Since then, the annual rate has stayed around 1.5% or just above it.
The latest figures have now been published by the Bureau of Economic Analysis as part of the July personal income and expenditures report. Core PCE inflation was +0.2% for the month, the same rate as in June but less than the 0.3% increase which had been expected. On a 12-month basis, the core PCE inflation rate remained unchanged at 1.6%.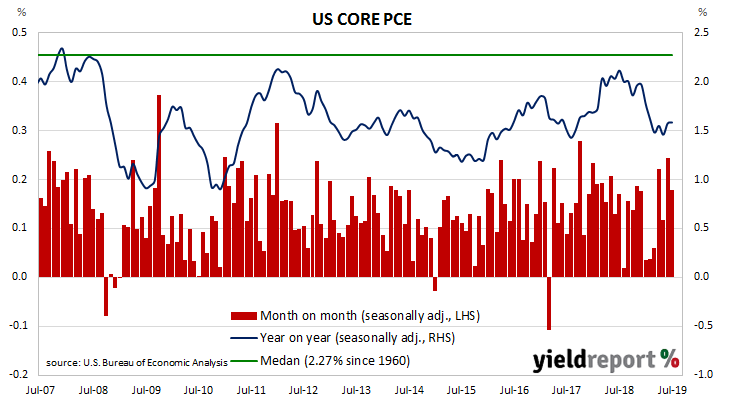
30 August 2019
The pace of lending to the non-bank private sector by financial institutions in Australia has been trending down since October 2015. It appeared to have stabilised in the September quarter of 2018 but then subsequent credit figures put paid to that idea. However, the failure of the left-wing parties at the recent federal election and the consequent deferment of their policies has led to a noticeable increase in lending to owner occupiers.
According to the latest RBA figures, private sector credit grew by 0.2% in July, in line with expectations and up from May’s +0.1%. However, the annual growth rate slipped again, this time from June’s figure of 3.3% to 3.1% as lending to business remained subdued.
Financial markets reacted in a subdued fashion, although the release of July’s home approval figures will have had some effect as well. By the end of the day, 3-year ACGB yields remained unchanged at 0.67%, 10-year yields had inched up 1bp to 0.88% and 20-year yields remained unchanged at 1.29%.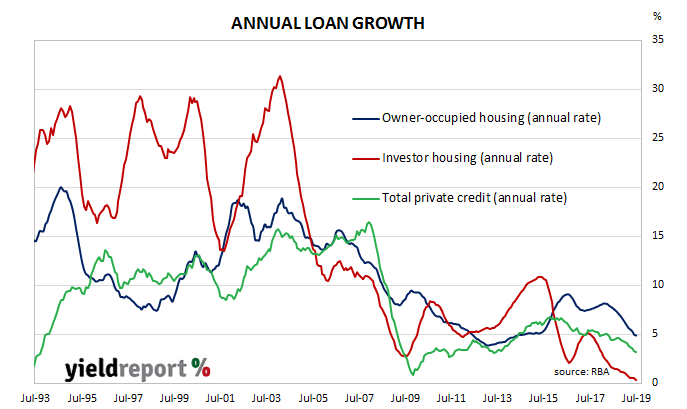 Cash futures prices moved to reduce the implied likelihood of further cuts in 2019 and 2020, although two more 25bps reductions are still expected. September contracts implied a 2% chance of a third rate cut for the year, down from the previous day’s 11%. October contracts implied a 13% chance of a third rate cut in 2019, down from 79%. November contracts finished with a rate cut priced as an 86% likelihood rather than being fully factored in but December contracts still have a 0.75% cash rate as a certainty.
30 August 2019
Approvals figures for dwellings, that is apartments and houses, have been heading south since mid-2018. As an indicator of investor confidence, falling approval figures represent a worrying signal, not just for the building sector but for the overall economy. There has been some expectation of a recovery in recent months but little in the way of confirmation.
The Australian Bureau of Statistics has now released the latest figures and total residential approvals dropped by 9.7% on a seasonally-adjusted basis in July, well under the 0.0% which had been expected and a marked deterioration from June’s revised figure of -0.8%. On an annual basis, total approvals fell by 28.5%, as compared to June’s comparable figure of -25.0% after revisions.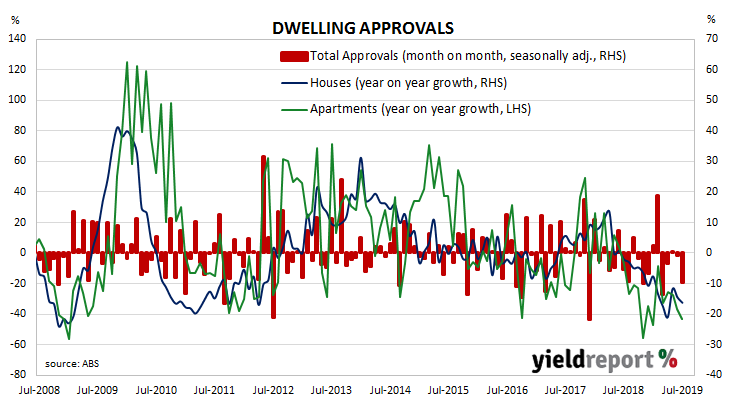 Westpac senior economist Matthew Hassan said, “Overall the July update is clearly much weaker than expected and raises the risk that building activity may take another leg lower.”
Financial markets reacted in a subdued fashion, although the release of July’s private credit figures will have also had some effect. By the end of the day, 3-year ACGB yields remained unchanged at 0.67%, 10-year yields had inched up 1bp to 0.88% and 20-year yields remained unchanged at 1.29%.
29 August 2019
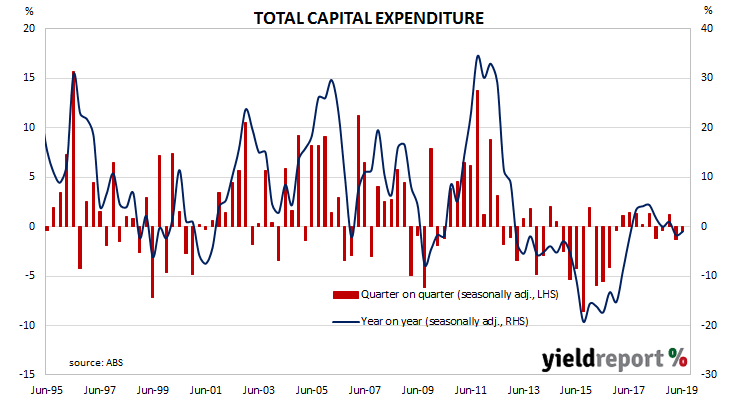
Australia’s capital expenditure (capex) slump was thought to be coming to an end as investment in the mining sector reverted back to its long-term mean after a spike early in the decade. Total investment had begun to grow again, driven by investment in the services sector. However, contractions in recent quarters have become the norm.
According to the latest ABS figures, seasonally-adjusted private sector capex in the June quarter contracted by 0.5%, a small improvement on the March quarter’s -1.3% after revisions but less than the 0.4% increase which had been expected. On a year-on-year basis, total capex contracted by 1.0% after recording a revised rate of -1.7% in the March quarter.
ANZ senior economist Catherine Birch said, “Private new capex contracted for a second consecutive quarter in Q2, as a rise in machinery and equipment was more than offset by a drop in buildings and structures. It wasn’t all bad news, though, with mining recording its strongest quarterly result in five years.”