13 August 2019
The annual rate of US consumer inflation halved from nearly 3% in the period from July 2018 to February 2019 and then subsequently fluctuated in a range from 1.5% to 2.0%. However, “headline” inflation is known to be volatile and so reference is often made to “core” inflation figures. This measure has mostly ranged between 1.7% and 2.3% in recent years and it has not been below 2.0% since early 2018. Some economists have recently begun to ask whether it is starting to rise further.
The latest consumer price index (CPI) figures released by the Bureau of Labor Statistics indicated seasonally-adjusted consumer prices increased on average by 0.3% in July, in line with the consensus figure but more than June’s 0.1% increase. On a 12-month basis, the inflation rate quickened from June’s revised annual rate of 1.6% to 1.8%.
NAB economist Tapas Strickland said tariff increases were playing a part, although not yet a major one. “Driving the read was some flow-through from the tariffs that were increased in May…though the dominant factors were higher [prices for] used cars, medical services and airline fares.”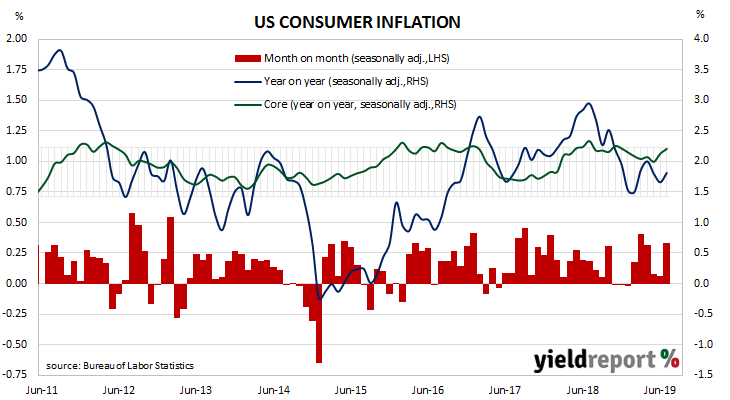
Core inflation, a measure of inflation which strips out the volatile food and energy components of the index, increased on a seasonally-adjusted basis by +0.3% for the month, higher than the 0.2% which had been expected but the same-sized increase as in June. As a result, the annual rate ticked up to 2.2%, an increase on June’s comparable figure of 2.1%.
13 August 2019
Australian business conditions were robust in the first half of 2018 and a cyclical-peak was reached in April of that year. Although they remained well above average for some months, readings began to slip and by the end of 2018, they had dropped to below-average levels. Forecasts of a slowing domestic economy began to emerge in the first half of 2019 and the latest readings from NAB’s survey are unlikely to alter their course.
According to NAB’s latest monthly business survey of 400 firms conducted in the latter part of July, business conditions deteriorated after a brief spike in June. Since late 2018, NAB’s conditions index had bounced between 3, which is on the low side of normal and 7, which is about average. The index then broke through this lower bound in May 2019. The latest reading of 2 is not much lower but it is far from comforting.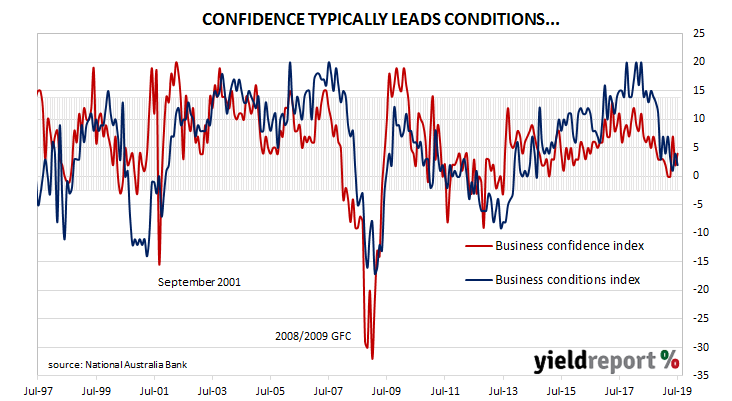 While NAB’s condition index fell, the latest reading of the confidence index partially rebounded from June’s figure of 2 to 4 in July, although it is still below the long-term average reading of 6. Typically, NAB’s confidence index leads the conditions index by approximately one month, although some divergences appear from time to time.
NAB chief economist Alan Oster reiterated his message from the previous month. “[T]he business sector has lost significant momentum since early 2018 and…forward-looking indicators do not point to an improvement in the near term.”
09 August 2019
The producer price index (PPI) is a measure of prices charged by producers for domestically produced goods, services, and construction. In the US, it is constructed by the Bureau of Labor Statistics in a fashion similar to the consumer price index (CPI) except it measures prices received from the producer’s perspective. It is another one of the various measures of inflation tracked by the US Fed, along with core personal consumption expenditure (PCE) data.
The latest figures have been published by the Bureau and they indicate producer prices increased by 0.2% during July after seasonal adjustments. The result was in line with expectations but an increase from June’s +0.1%. On a 12-month basis, the rate of producer price inflation after seasonal adjustments regained some speed to 1.7% after slowing to 1.6% in June from 1.9% in May.
09 August 2019
The Statement on Monetary Policy (SoMP) is released each quarter and it is closely watched for updates to the RBA’s own forecasts. In the November SoMP, the opening statement of the “Outlook” section stated “Domestic economic conditions have been a bit stronger than were expected in August”. In February’s SoMP, the sentence was changed to “have been a bit softer than were expected” and, in May this was modified to “was weaker over 2018 than expected…” In this latest SoMP, the Outlook section starts with the statement, “Domestic economic growth in the first half of the year was a little lower than expected…”
Consequently, the RBA has reduced calendar-year 2019 GDP and underlying inflation forecasts and at the same time it has increased unemployment forecasts out to June 2021.
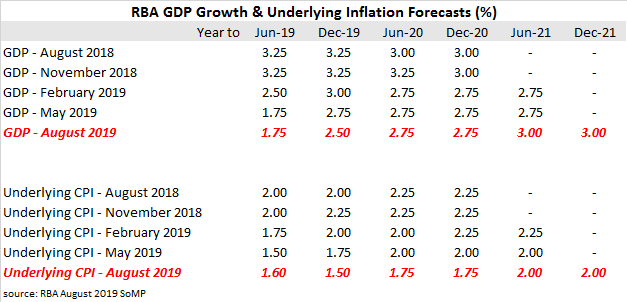 The RBA’s inflation forecasts were flagged in the statement which accompanied the August meeting’s monetary policy decision where Philip Lowe stated “it is likely to take longer than earlier expected for inflation to return to 2%. In both headline and underlying terms, inflation is expected to be a little under 2% over 2020 and a little above 2% over 2021.”
07 August 2019
Since late 2017/early 2018, a very clear downtrend has been evident in the monthly figures of both the number and value of home loan commitments. After the figures from February were released, some economists speculated the worst may have been over. However, the latest figures have only continued the downtrend and economists are still waiting for the effects of an unexpected federal election outcome to feed into demand for mortgages.
June’s housing finance commitment figures have now been released and they were generally in line with expectations. The total number of loan commitments to owner-occupiers fell by 0.9%, a further deterioration from May’s revised figure of -0.3%. On an annual basis, the growth rate ever-so-slightly recovered from May’s revised figure of -12.5%, recording -12.4%. When “re-financings” are removed, the number of loan commitments increased by 0.4% over the month, in line with the expected 0.4% increase but 13.6% lower than in June 2018.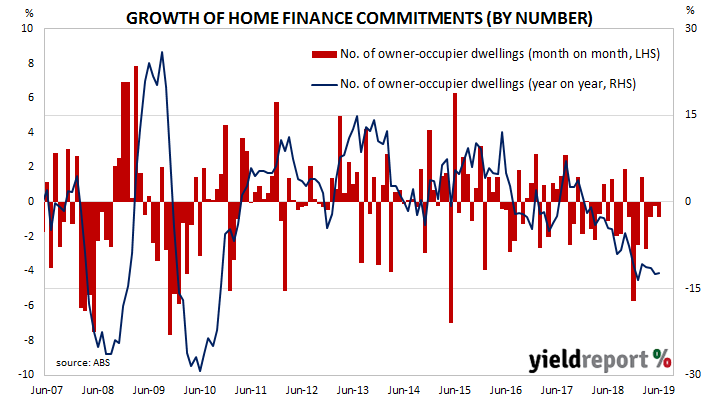
Westpac senior economist Matthew Hassan said, “The June housing finance approval figures were broadly consistent with stabilising market conditions through the middle of 2019.”
ANZ economist Adelaide Timbrell took a similar line, saying the report ”reflects a shift in sentiment after the May election result, the first RBA cut and discussions between APRA and banks on credit regulations.” However, she also noted the effects of a “string of April holidays and the May election, which may have delayed housing purchases.”
06 August 2019
The quit rate as a percentage of total US non-farm employment had been rising slowly but steadily since the end of the GFC. It peaked in August 2018, stabilised and then remained largely unchanged through the remainder of 2018 and into 2019 at a historically-high level. Despite international factors casting doubts on future economic conditions, the latest figures are yet to show signs of significant change in the domestic US economy.
Figures released as part of the most recent JOLTS report show the quit rate has remained largely unchanged in June. 2.3% of the non-farm workforce left their jobs voluntarily, a rate which has remained unchanged after rounding since June 2018. Quit numbers were highest in the construction and hotels/associated food services sectors while the transportation, warehousing/utilities and “other” sectors recorded the largest falls. Overall, the total number of quits fell from May’s revised figure of 3.478 million to 3.433 million in June.
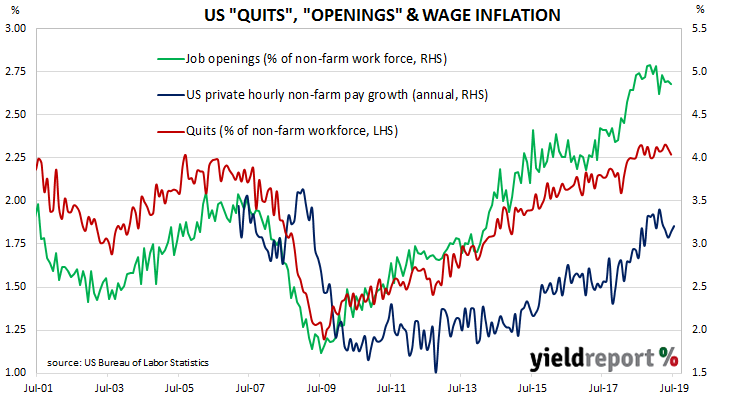
Total job openings fell but May figures were revised up by 12,000 and so the fall was not a consecutive one. Total vacancies during June fell by 36,000 from May’s revised figure of 7.384 million to 7.348 million, driven by reduced openings in the hotels/associated food services sectors, “other” and construction sectors. Additional openings in the retail trade and real estate sectors provided some offset to the overall fall but, overall, 11 out of 18 sectors experienced fewer job openings than in the previous month.
06 August 2019
From mid-2017 onwards, year-on-year growth rates in the total number of job advertisements consistently exceeded 10%. That was until mid-2018 when the annual growth rate fell back markedly and then continued to deteriorate for the remainder of 2018 and into 2019. The last two month’s figures have been positive but June figures were thought to be just a correction of May’s holiday-affected numbers and the latest figures may be just an aberration.
July’s figures have now been released by ANZ and total advertisements increased by 0.8% to 161,427 after revisions and seasonal adjustments. On a 12-month basis, total job advertisements were 9.1% lower than last year, a touch slower than June’s comparable figure of -9.0% after revisions.
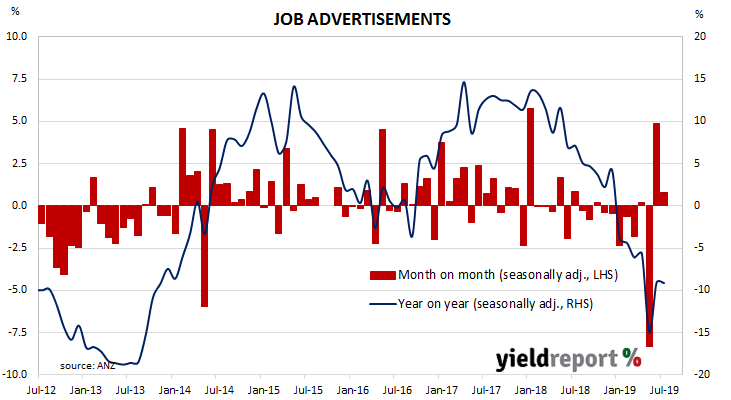 ANZ head of Australian Economics David Plank noted the second consecutive increase and he said normally this would be “encouraging”. However, April’s “holiday effect” and the May election had a destabilising effect on the report’s figures. “We will need another month or two of gains before we conclude the trend has definitely turned. Even if job ads are starting to move higher, there is still some way to go before they would be suggesting a turn in the recent slowing of jobs growth and rise in unemployment.”
05 August 2019
The RBA’s stated objective is to achieve an inflation rate of between 2% and 3%, “on average, over time.” Since the GFC, Australia’s inflation rate has been trending lower and lower and, for some years now, it has been below the RBA’s target band. Despite the RBA’s desire for a higher rate, its attempts to drive it up through record-low interest rates have failed to move Australia’s inflation rate to its target band. The latest unofficial measurement of consumer inflation may have accelerated but it is too early to pronounce any transition to a more-inflationary environment just yet.
The Melbourne Institute’s Inflation Gauge is an attempt to replicate the ABS consumer price index (CPI) on a monthly basis. It has turned out to be a reliable leading indicator of the CPI, although there are periods in which the Inflation Gauge and the CPI have diverged for as long as twelve months. On average, the Inflation Gauge’s annual rate tends to overestimate changes in CPI inflation by an average of about 0.1% per quarter.
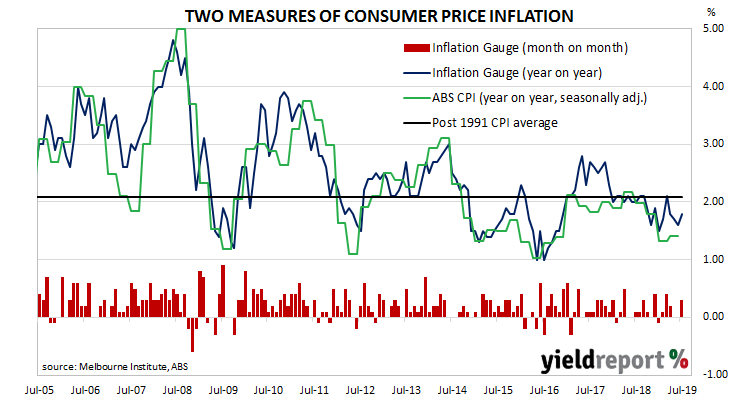
The Inflation Gauge index increased by 0.3% in July after flat results in both May and June. On an annual basis, the index increased by 1.8%, marking an acceleration from June’s comparable rate of 1.6%.
02 August 2019
The US economy continues to produce more jobs despite being close to full employment. The unemployment rate has remained at or under 4% since April 2018 while annual increases in hourly pay have remained above 3% for ten consecutive months. This latest employment report has provided more of the same, even as the US Fed has cut the federal funds rate target and various economic surveys hint at a coming slowdown.
According to the US Bureau of Labor Statistics, the US economy created an additional 164,000 jobs in the non-farm sector in July, less than June’s revised increase of 193,000 but broadly in line with the 160,000 increase which had been expected by economists. However, previous two month’s figures were revised lower by a total of 41,000.
The unemployment rate remained unchanged at June’s revised rate of 3.7% as the total number of unemployed increased by 88,000 to 6.063 million while the total number of people either employed or looking for work increased by 371,000 to 163.35 million. US bond yields fell on the day, not because of the non-farm numbers but as a result of the Chinese response to the Trump Administration’s tariff announcement of the previous day. By the end of the day, 2-year Treasury bond yields had shed 2bps to 1.71%, 10-year yields had lost 5bps to 1.85% and 30-year yields were 6bps lower at 2.38%.
02 August 2019
Growth figures of domestic retail sales have been declining since 2014 and growth figures hit a low-point in September 2017. Annual growth rates then began increasing for about a year, only to stabilise at around 3.0% to 3.5% through late 2018. Early 2019 produced a string of low-growth months along with the odd surprisingly strong result. The latest figures offer some promise but they may be just an aberration.
According to the latest ABS figures, total retail sales increased by 0.4% in June on a seasonally-adjusted basis, more than the +0.3% increase expected and an improvement on May’s +0.1% increase. On an annual basis, retail sales increased by 2.5%, up a touch from May’s comparable figure of 2.4%.
Westpac senior economist Matthew Hassan said, “Overall, while the June report does not show a further worsening it underscores the very weak conditions across Australia’s retail sector over the last year. The key question going forward is the extent to which policy stimulus flows through to spending in the second half of the year.”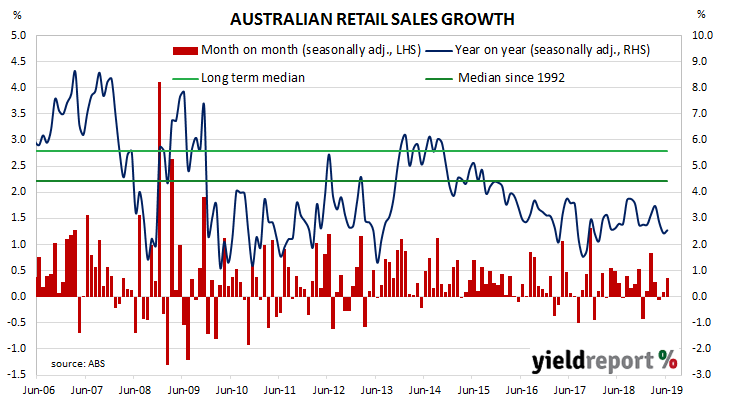
Local bond yields plunged in line with US markets, largely ignoring local data. By the end of the day, the yield on 3-year ACGBs had shed 9bps to 0.72%, 10-year yields had fallen by 13bps to 1.09% and 20-year yields had lost 12bps to 1.55%.

