17 July 2019
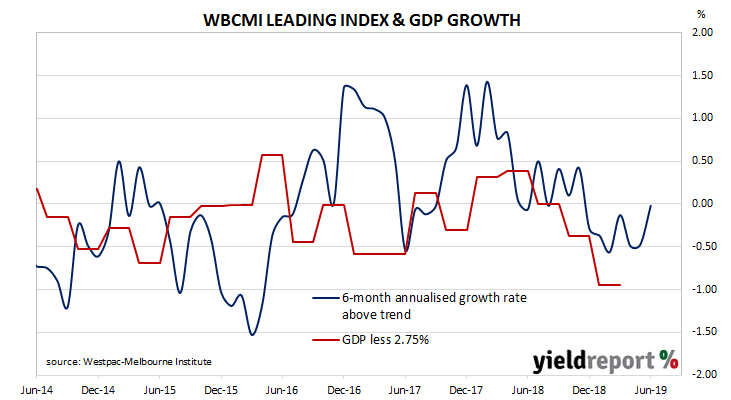
Westpac and the Melbourne Institute describe their Leading Index as a composite measure which attempts to estimate the likely pace of Australian economic activity relative to trend over the next three to six months. Since its peak in early 2018, the index had progressively headed lower through 2018 and into 2019. Recent months’ figures gave some sign of stabilising and the latest reading indicates GDP may be about to revert back to the trend growth rate just as the Reserve Bank has cut the cash rate to a historic low.
The six-month annualised growth rate of the indicator recovered from May’s revised figure of -0.47% to -0.02% in June. These figures represent rates relative to trend-GDP growth, which is generally thought to be around 2.75% per annum. The Index is said to lead GDP by 3 to 6 months, so theoretically the current reading represents an annualised GDP growth rate of around 2.75% in late-2019.
16 July 2019
The RBA cut the official cash rate by 25bps for a second time this year at its July board meeting, taking the cash rate target down to 1.00%. It has not been lower in the 60-year history of the Reserve Bank.
Statements from RBA officials through 2018 had indicated at the time the Bank’s next move was “more likely to be an increase”. Around February of this year, the RBA then changed its tune and stated “the probabilities around these scenarios were now more evenly balanced than they had been over the preceding year…”
Two months later, the RBA’s April minutes stated “there was not a strong case for a near-term adjustment in monetary policy.” However, the minutes also stated a cut in the cash rate would be appropriate “where inflation did not move any higher and unemployment trended up…”
By May, the RBA had shifted and if “there was no further improvement in the labour market in the period ahead….a decrease in the cash rate would likely be appropriate.”
The first-rate cut since August 2016 was announced after the June Board meeting, with the second cut announced one month later at the July meeting.
The minutes of that meeting have now been released. In the meeting, the Board’s deliberations once again focussed on spare capacity in the labour market. However, they also explained the rationale behind the necessity of two rate cuts in as many months.
16 July 2019
US industrial production was unchanged in June. According to the Federal Reserve’s industrial production index, production levels remained steady, a large fall from May’s 0.4% increase and missing the market’s expected figure of +0.1%.
The same report includes US capacity utilisation figures which are generally accepted as an indicator of future investment expenditure and/or inflationary pressures. In the US, capacity utilisation had been trending up since mid-2016 after a sudden dip in 2015. However, since December 2018, utilisation rates have been slipping. June’s reading maintained this trend as it fell from May’s reading of 78.1% to 77.9%.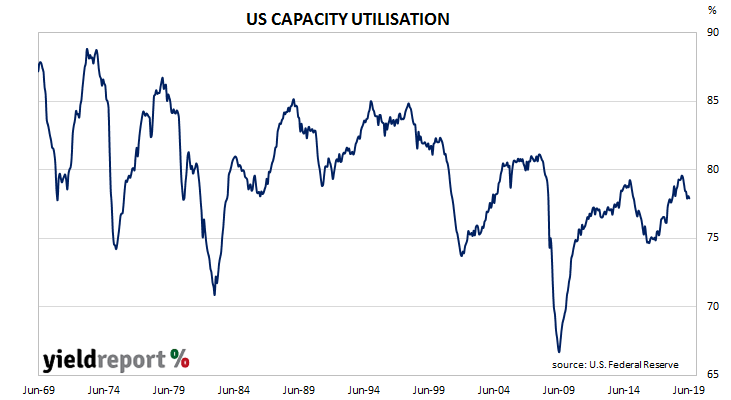
16 July 2019
US retail sales had been trending up since late 2015 but, beginning in late-2018, a series of weak or negative monthly results led to a drop-off in the annual growth rate. Subsequent sales figures formed a downtrend which brought the annual rate below 2.0% by the end of the year. Growth in the March quarter was quite strong and the June quarter has turned out to be robust as well.
According to the latest “advance” sales numbers released by the US Census Bureau, total retail sales increased by 0.4% in June, double the +0.2% which had been expected but in line with May’s revised figure of +0.4%. On an annual basis, the growth rate sped up to 3.4% from May’s revised rate of 2.9%.
NAB economist Tapas Strickland said the report’s latest figures suggest the US economy is holding up well despite trade dispute and other uncertainties. “The numbers suggest real consumer spending in Q2 could rise by up to an annualised 4.2% rate, well up from the 0.9% pace in Q1. So far it seems the industrial slowdown stemming from the trade spat is not spilling over to the larger services side of the economy for now.”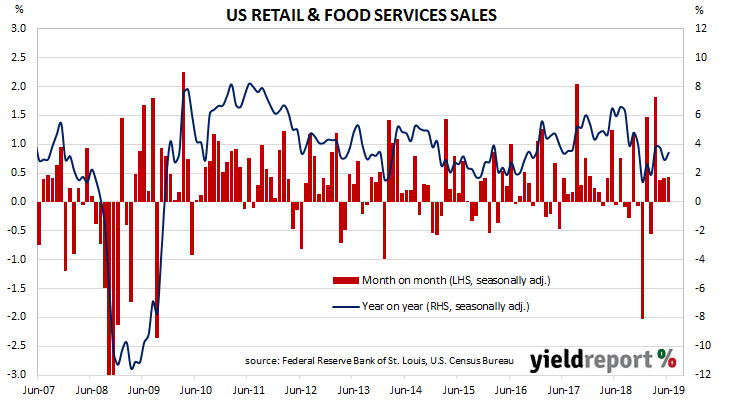 ANZ Head of FX Strategy Daniel Been agreed. “The gains were fairly broad-based with only electronics seeing a small pullback, suggesting that the consumer is alive and well.” However, he also acknowledged other economic reports were not so rosy. “Factories were looking less rosy in June though, with industrial production flat on the month, a bit weaker than expected.”
12 July 2019
The producer price index (PPI) is a measure of prices charged by producers for domestically produced goods, services, and construction. In the US, it is constructed by the Bureau of Labor Statistics in a fashion similar to the consumer price index (CPI) except it measures prices received from the producer’s perspective. It is another one of the various measures of inflation tracked by the US Fed, along with core personal consumption expenditure (PCE) data.
The latest figures have been published by the Bureau and they indicate producer prices increased by just 0.1% during June after seasonal adjustments. The result was in line with expectations and it was the same-sized increase as in May. On a 12-month basis, the rate of producer price inflation after seasonal adjustments slowed to 1.6% after recording 1.9% in May and 2.3% in April. “Core” PPI inflation picked up pace from May’s 0.2% to 0.3% in June while the annual rate remained at 2.3%.
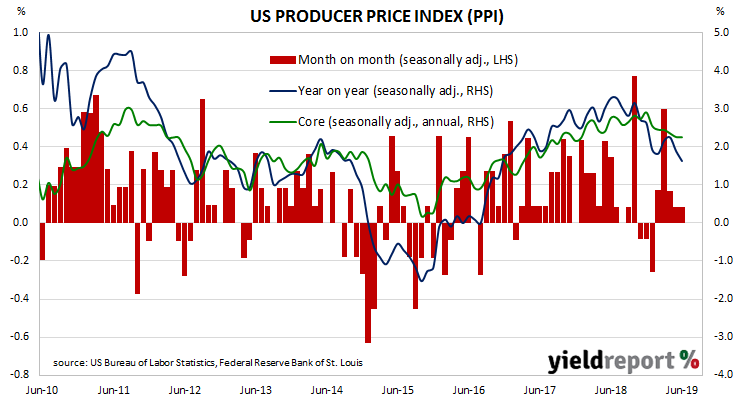
Westpac’s Head of NZ Strategy Imre Speizer described the figures as “another sign that the US is not at risk of a deflationary slide.” ANZ economist Hayden Dimes agreed but went further and said the report’s figures provided “another sign of inflation in the economy.”
11 July 2019
Since late 2017/early 2018, a very clear downtrend has been evident in the monthly figures of both the number and value of home loan commitments. After the figures from February were released, some economists speculated the worst may have been over. The latest numbers have not ended the downtrend but more data will be required to paint a reliable picture given an unexpected federal election result and consequently, unexpected policy stability.
The ABS has released May’s housing finance commitment figures* and they were just a little more than expected. The total number of loan commitments to owner-occupiers remained unchanged after rounding, a higher result than the expected -1.0% and an improvement from April’s revised figure of -0.9%. However, on an annual basis, the growth rate further deteriorated from April’s revised figure of -11.4%, recording -12.4%. When “re-financings” are removed, the number of loan commitments fell by 0.1% over the month and by 15.0% when compared to commitments from May 2018.
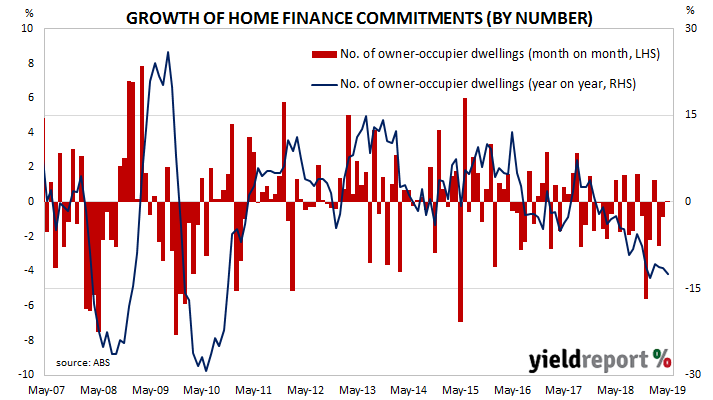
ANZ economist Adelaide Timbrell said the timing of several public holidays and the Federal election needed to be taken into account. “The election in mid-May and the string of public holidays in April may have weighed on the result, as prospective buyers delayed their purchases to later in the year.” She also thought the election may have acted as a type of circuit breaker, reducing the relevance of pre-election results. “Given the shift in sentiment since the election, we doubt there will be much focus on this result.”
Other economists said much the same. Westpac senior economist Matthew Hassan said, “Overall, the update is of limited interest given the data pre-dates what looks to have been a meaningful shift in market conditions through June-July. The next few months of approvals data and the performance of auction markets as we head into the Spring selling season will be much more important.”
11 July 2019
The annual rate of US consumer inflation halved from nearly 3% in the period from July 2018 to February 2019 and then subsequently fluctuated in a range from 1.5% to 2.0%. However, “headline” inflation is known to be volatile and so reference is often made to “core” inflation figures. This measure has mostly ranged between 1.7% and 2.3% in recent years and it has not been below 2.0% since early 2018.
The latest consumer price index (CPI) figures released by the Bureau of Labor Statistics indicated seasonally-adjusted consumer prices increased on average by 0.1% in June, which is more than the consensus figure but the same as May’s increase. On a 12-month basis, the inflation rate slowed from May’s annual rate of 1.8% to 1.7%.
ANZ economist Kishti Sen said, “While data flow out of the US continues to pour the occasional bucket of cold water on US rate cut expectations, worrying signs over upstream inflation pressures remain.”
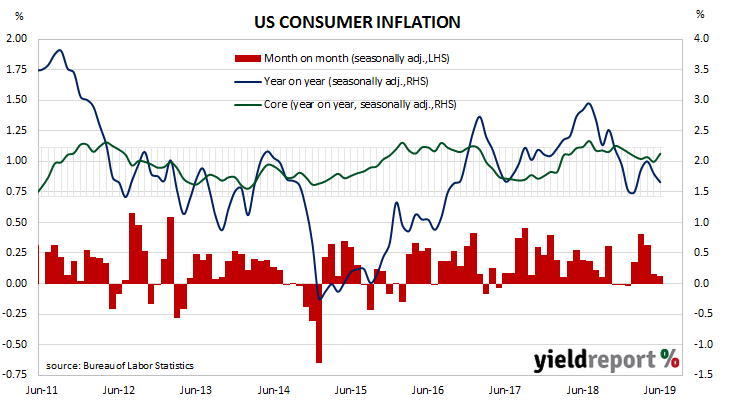
Core inflation, a measure of inflation which strips out the volatile food and energy components of the index, increased on a seasonally-adjusted basis by +0.3% for the month, higher than the 0.2% increase which had been expected and higher than May’s +0.1%. As a result, the annual rate ticked up to 2.1%, an increase on May’s comparable figure of 2.0% and more than the 2.0% consensus expectation.
10 July 2019
After a lengthy divergence between consumer sentiment and business confidence in Australia which began in 2014, the two sectors converged again around July 2018. Currently, both measures are at slightly negative or below-average levels. This latest measurement of consumer sentiment indicates household confidence has reverted back to the somewhat-depressed levels present from mid-2014 to mid-2017.
According to the latest Westpac-Melbourne Institute survey conducted in early July, average household optimism has dropped below neutral levels and it is now in negative territory. The Consumer Sentiment Index continued on from June’s modest fall, this time with a larger drop from 100.7 to 96.5. Any reading above 100 indicates the number of consumers who are optimistic is greater than the number of consumers who are pessimistic. The long-term average reading is just over 101.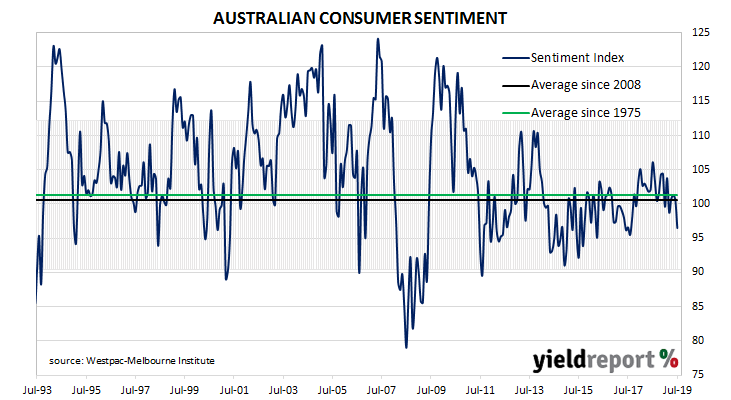
09 July 2019
The quit rate as a percentage of total US non-farm employment had been rising slowly but steadily since the end of the GFC. It peaked in August 2018, stabilised and then remained largely unchanged through the remainder of 2018 and into 2019 at a historically high level. The latest report has not changed this picture.
Figures released as part of the most recent JOLTS report show the quit rate has remained unchanged in May. 2.3% of the non-farm workforce left their jobs voluntarily, a rate which has remained unchanged after rounding since June 2018. Quit numbers were highest in the construction, retail trade and state education sectors while the professional/business services and healthcare sector recorded the largest fall. Overall, the total number of quits slipped from April’s revised figure of 3.516 million to 3.425 million.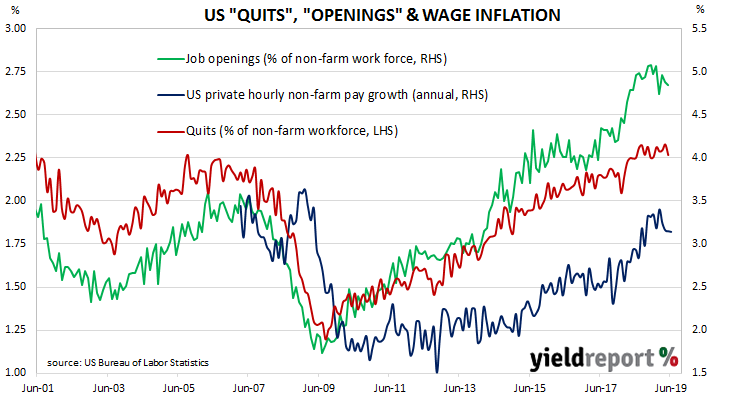
09 July 2019
Australian business conditions were robust in the first half of 2018 and a cyclical-peak was reached in April of that year. Although they remained well above average for some months, readings began to slip and by the end of 2018, they had dropped to below-average levels. Recent readings have added to forecasts of a slowing domestic economy.
According to NAB’s latest monthly business survey of 400 firms conducted in the latter part of June, business conditions have recovered back into the “normal range” from their worst levels since September 2014. Since the latter part of 2018, NAB’s conditions index had bounced between 3, which is on the low side of normal and 7, which is about average. After a dip below the range in May, the latest reading marks a return to this range.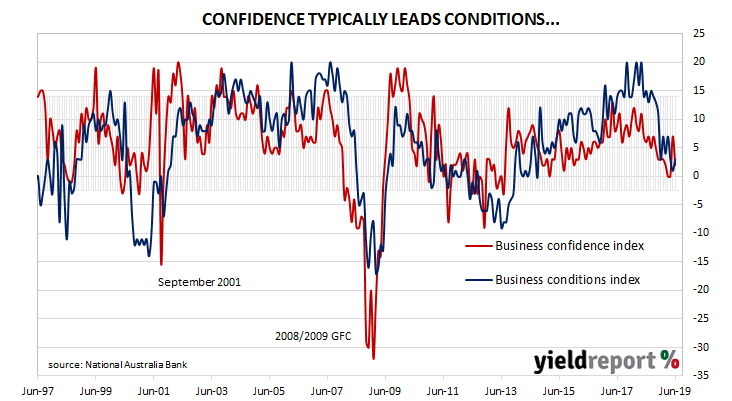 The latest reading of the confidence index dropped back from May’s figure of 7 to 2 in June, below the long-term average reading of 6. Typically, NAB’s confidence index leads the conditions index by approximately one month, although some divergences appear from time to time.

