08 July 2019
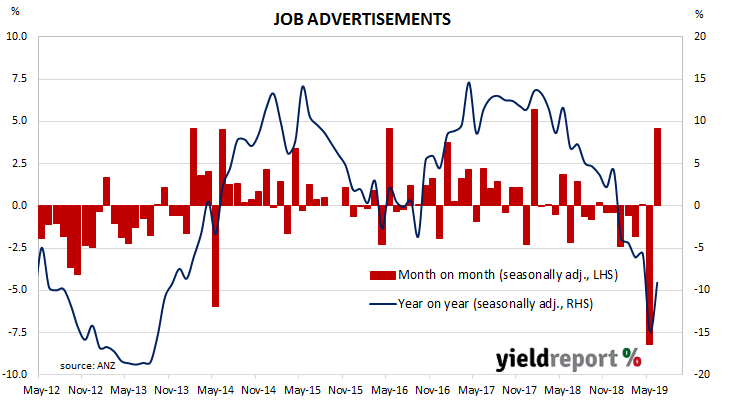
From mid-2017 onwards, year-on-year growth rates in the total number of job advertisements consistently exceeded 10%. That was until mid-2018 when the annual growth rate fell back markedly and then continued to deteriorate for the remainder of 2018 and into 2019. The latest figures for June were positive but they may just represent a correction of May’s holiday-affected numbers.
June’s figures have now been released by ANZ and total advertisements increased by 4.6% to 159,717 after revisions and seasonal adjustments. On a 12-month basis, total job advertisements were 9.1% lower than last year, up from May’s comparable figure of -14.9% after revisions.
ANZ head of Australian Economics David Plank said the increase was more the result of a timing issue than a fundamental process. “ANZ Australian Job Ads bounced back in June after falling more than 8% in May. The ‘holiday-year effect’ in late April and the timing of the election appear to have been responsible for much of the decline in May and the rebound in June can be seen as an unwinding of that effect.” He did not think “it necessarily represents a turn in the overall downward trend, however.”
05 July 2019
The US economy continues to produce more jobs despite being close to full employment. The unemployment rate has remained at or under 4% since April 2018 while annual increases in hourly pay have remained above 3% for nine consecutive months. This latest employment report has surprised observers who were expecting some sort of slowdown.
According to the US Bureau of Labor Statistics, the US economy created an additional 224,000 jobs in the non-farm sector in June, considerably more than May’s revised increase of 72,000 and more than the 158,000 increase which had been expected by economists. The unemployment rate ticked up from 3.6% to 3.7% as the total number of unemployed increased by 87,000 to 5.975 million while the total number of people either employed or looking for work increased by 334,000 to 162.98 million.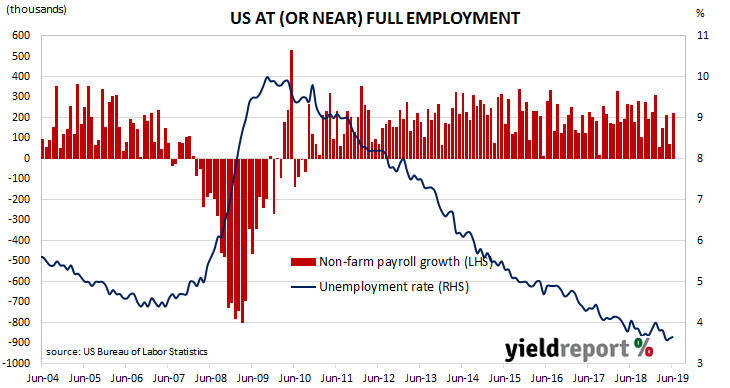 US bond yields increased on the news. By the end of the day, 2-year Treasury bond yields had gained 11bps to 1.86%, 10-year yields had increased by both 9bps to 2.04% and 30-year yields were 7bps higher at 2.54%.
04 July 2019
Growth figures of domestic retail sales have been declining since 2014 and growth figures hit a low-point in September 2017. Annual growth rates then began increasing for about a year, only to stabilise at around 3.0% to 3.5% through late-2018. After April’s figures were released, concerns arose as to a possible deterioration in consumer spending. This latest report does not do much to allay such concerns.
According to the latest ABS figures, total retail sales increased by 0.1% in May on a seasonally-adjusted basis, less than the +0.2% increase expected but an improvement on April’s 0.1% contraction. On an annual basis, retail sales increased by 2.4%, down from April’s comparable figure of 2.8%.

ANZ economist Adelaide Timbrell said the Federal election and timing of Easter had a dampening effect, although general weakness in the Australian economy was probably behind the soft result. “Broad weakness in the economy and continuing housing adjustment, despite some green shoots, may have also added downward pressure. The hangover in May from the “holiday effect” in April was seen in contractions for liquor, recreation and department store sales.
03 July 2019
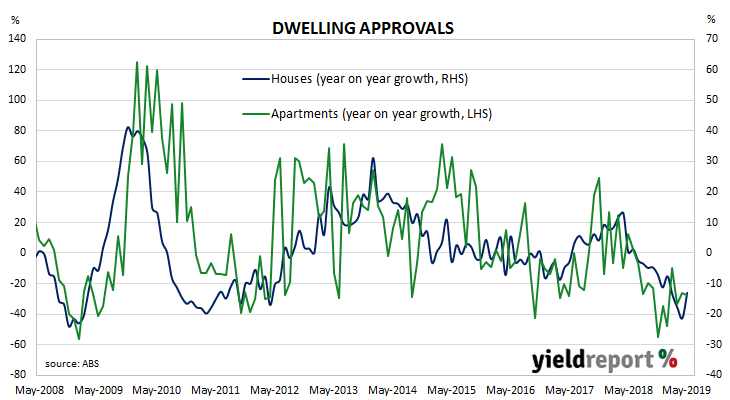
Approvals figures for dwellings, in this case, apartments and houses, have been heading south since mid-2018. As an indicator of investor confidence, falling approval figures represent a worrying signal, not just for the building sector but for the overall economy. The most recent figures offer a ray of hope and some economists think the bottom of the cycle may be approaching. However, other economists are still wary.
The Australian Bureau of Statistics has now released the latest building approval figures and they indicate total approvals have made a slight recovery. Seasonally-adjusted, total approvals increased by 0.7% in May, which is above the market consensus figure of no change and an improvement on April’s revised figure of -3.4%. On an annual basis, total approvals fell by 19.6%, as compared to April’s comparable figure of -23.4% after revisions.
03 July 2019
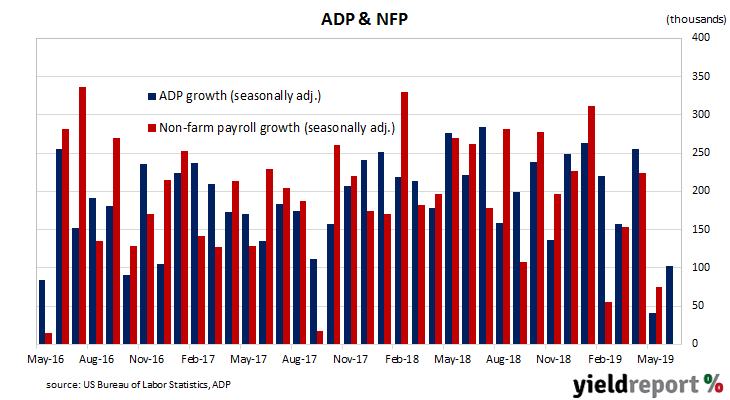
The ADP National Employment Report is published monthly by the ADP Research Institute. The report provides an estimate of US non-farm employment based in the private sector. Since the report began to be published in 2006, its total private sector non-farm employment figures have exhibited a high correlation with the Bureau of Labor Statistics (BLS) non-farm payroll figures.
The latest June figures indicate private sector employment grew by 102,000, below the expected figure of 140,000 but a solid improvement on May’s revised increase of 41,000.
NAB Head of FX Strategy Ray Attrill referred to the report’s “chequered track record as a guide to payrolls” even though the May report had “accurately foreshowed the subsequent weak May non-farm payrolls report”. He noted forecasts for the upcoming non-farm payroll report on Friday night had not been changed as a result of the ADP report.
01 July 2019
US purchasing managers’ indices (PMIs) have been sliding since August 2018, albeit from elevated levels. After reaching a cyclical peak in September 2017, manufacturing PMI readings went sideways for a year before they started a downtrend. The latest reading has continued this trend with geopolitical issues uppermost in managers’ minds.
US manufacturing activity slowed in June to below-average levels. According to the latest Institute of Supply Management (ISM) survey, its Purchasing Managers Index recorded a reading of 51.7, down from May’s reading of 52.1 but above the market’s expected figure of 51.0. The average reading since 1948 is 52.9, so the latest reading can be described as being under the long-term average.
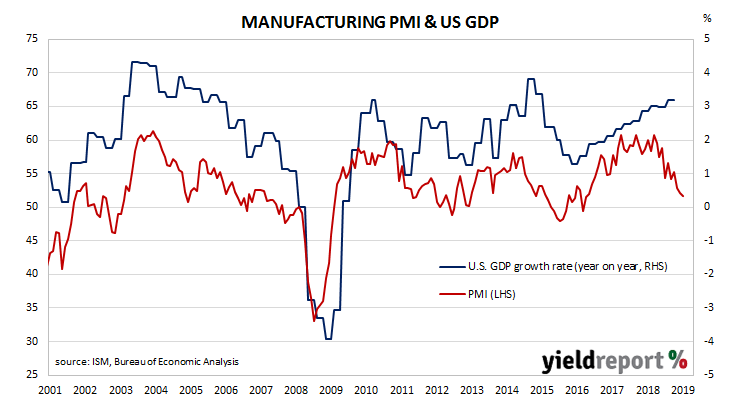 ANZ economist Kishti Sen said the report indicated tariffs had complicated life for businesses. “Respondents frequently cited tariffs as an issue, noting havoc with supply chains and how they were affecting planning and forecasting. Mexican tariffs, which haven’t gone ahead, were also cited. With talks now back on with China and the Mexican issues resolved there’s a chance sentiment improves from here but new orders suggest activity may not, at least in the near term.”
01 July 2019
The RBA’s stated objective is to achieve an inflation rate of between 2% and 3%, “on average, over time.” Since the GFC, Australia’s inflation rate has been trending lower and lower and, for some years now, it has been below the RBA’s target band. Despite the RBA’s desire for a higher rate, its attempts to drive up the rate through record-low interest rates have failed to move Australia’s inflation rate to its target band. The latest unofficial measurement of the inflation rate has given no indication the RBA will meet its objective any time soon.
The Melbourne Institute’s Inflation Gauge is an attempt to replicate the ABS consumer price index (CPI) on a monthly basis. It has turned out to be a reliable leading indicator of the CPI, although there are periods in which the Inflation Gauge and the CPI have diverged for as long as twelve months. On average, the Inflation Gauge’s annual rate tends to overestimate changes in CPI inflation by an average of about 0.1% per quarter.
The Inflation Gauge index remained unchanged in June after a flat result in May and a 0.2% increase in April. On an annual basis, the index increased by 1.6%, slowing from May’s comparable rate of 1.7%. Given the Inflation Gauge’s tendency to overestimate, the latest figures imply an official CPI reading of 0.6% (seasonally adjusted) for the June quarter or 1.6% in annual terms. However, it is worth noting the annual CPI rate to the end of March was 1.3% while the inflation Gauge had implied a 2.0% annual rate at the time.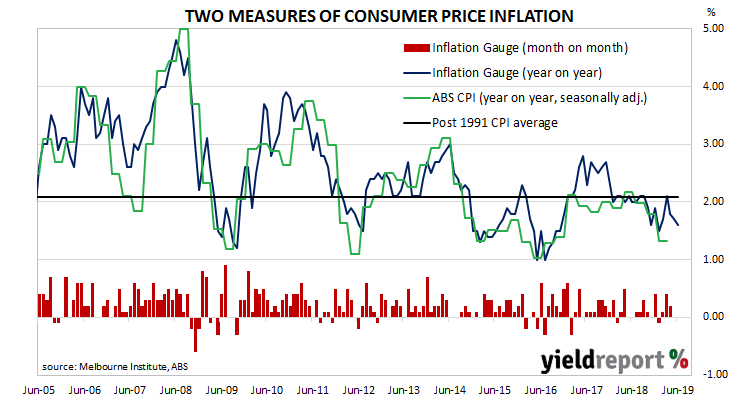
28 June 2019
One of the US Fed’s favoured measures of inflation is the change in the core personal consumption expenditures (PCE) price index. After hitting the Fed’s target at 2.0% in mid-2018, the annual rate then hovered in a range between 1.8% and 2.0% through to the end of 2018. Since then, the annual rate has fallen back to around 1.5%.
The latest figures have now been published by the Bureau of Economic Analysis as part of the May personal income and expenditures report. Core PCE inflation was +0.2% for the month, the same rate as in April and in line with what had been expected. On a 12-month basis, the core PCE inflation rate remained at 1.6%.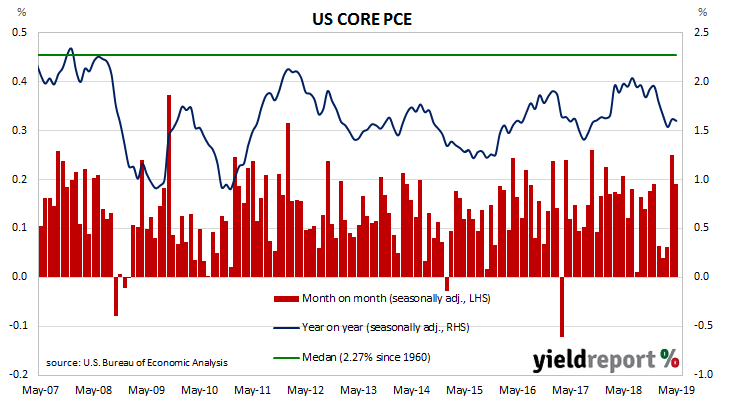
28 June 2019
The pace of lending to the non-bank private sector by financial institutions in Australia has been trending down since October 2015. It appeared to have stabilised in the September quarter of 2018 but credit figures in the December quarter put paid to that idea. The latest figures showed no sign of a change.
According to the latest RBA figures, private sector credit grew by 0.2% in May, the same as April’s growth rate and in line with the consensus estimate. The annual growth rate slipped from April’s figure of 3.7% to 3.6% as home lending slowed while business lending and personal lending contracted again.
Andrew Hanlon, a Westpac senior economist, said recent figures were not just a symptom of tighter bank lending in the property market. “Credit growth has slowed to a sluggish pace as the housing sector weakened in response to tighter lending conditions and a softening of demand. In April and May, another factor was broadly flat results for business credit.
The figures were largely as expected but the local market took its lead from the US markets and finished with lower yields across the curve. By the end of the day, the yield on 3-year Treasury bonds had slipped 1bp lower to 0.92%, 10-year yields had shed 2bps to 1.33% and the 20-year yield had dropped by 4bps to 1.74%.
27 June 2019
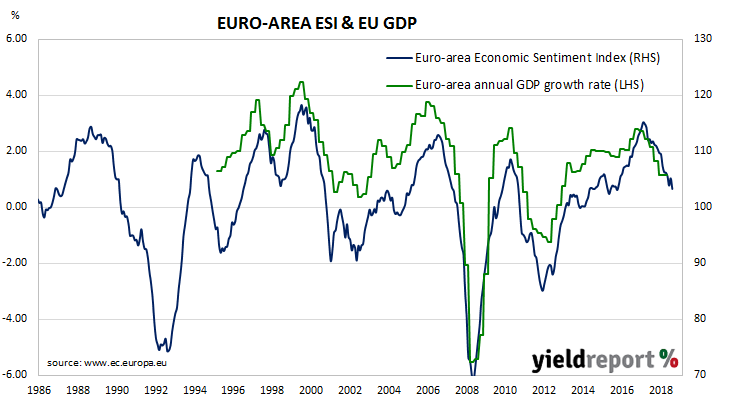
The EU’s Economic Sentiment Indicator (ESI) is a composite index made up of five confidence indicators from the industrial, services, consumer, construction and retail trade sectors. As such, the index covers most parts of an economy. It is produced monthly and it has a high correlation with euro-area GDP.
From 2016, four years after the sovereign debt disaster of 2012, the ESI moved higher and higher until late 2017. It then reversed direction and began a downtrend which lasted all through 2018 and into 2019. The latest June figures indicate the trend has continued.
According to the figures released by the European Commission, the index registered 103.3 in June, less than the consensus figure of 104.6 and lower than May’s comparable figure of 105.3.
The lower-than-expected figures had a dampening effect on European sovereign bond yields and they finished a couple of basis points lower. By the end of the day, yields on German 10-year bunds and French 10-year ATS both closed 2bps lower to -0.32% and 0.00% respectively.

