25 June 2019
US consumer confidence collapsed in late 2007 as the US housing bubble burst and the US economy went into recession. By 2016, it had clawed its way back to neutral and then went from strength to strength until late 2018. After a dramatic drop through December and January, index values then oscillated at historically high levels. The latest report is a continuation of this pattern.
The latest Conference Board survey indicates US consumers are still quite optimistic despite trade and geo-political tensions. The latest reading came in at 121.1, a considerable amount below May’s final figure of 131.3 but still at an elevated level. Consumers’ views of business and labour market conditions and their short-term outlook for income, business and employment market conditions all deteriorated.
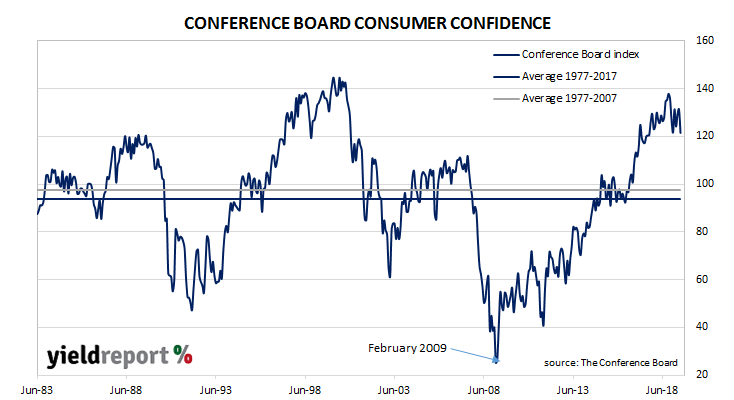
Lynn Franco, The Conference Board’s Director of Economic said, “The escalation in trade and tariff tensions earlier this month appears to have shaken consumers’ confidence. Although the Index remains at a high level, continued uncertainty could result in further volatility in the Index and, at some point, could even begin to diminish consumers’ confidence in the expansion.”
19 June 2019
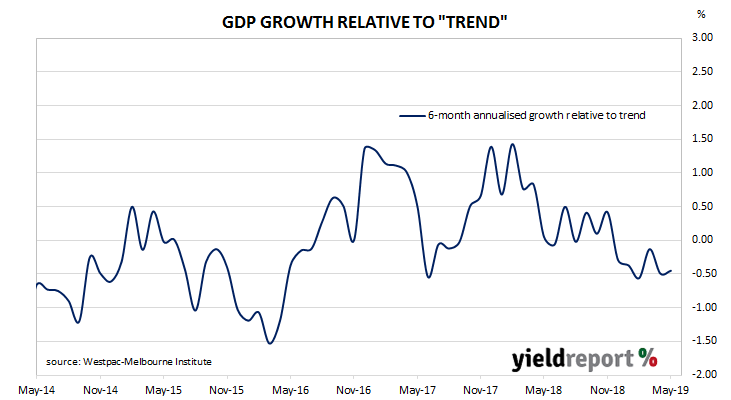
Westpac and the Melbourne Institute describe their Leading Index as a composite measure which attempts to estimate the likely pace of Australian economic activity relative to trend over the next three to six months. Since its peak in early 2018, the index had progressively headed lower through 2018 and into 2019. The latest figures have stabilised but they still indicate GDP is likely to remain at a sub-trend pace which will provide an incentive for the RBA to further reduce the cash rate.
The six-month annualised growth rate of the indicator fell back from April’s revised figure of -0.49% to -0.45% in May. These figures represent rates relative to trend-GDP growth, which is generally thought to be around 2.75% per annum. The Index is said to lead GDP by 3 months to 6 months, so theoretically the current reading represents an annualised GDP growth rate of around 2.2% in late-2019.
18 June 2019
The RBA cut the official cash rate by 25bps at its board meeting in June, the first such change since August 2016.
Statements from RBA officials through 2018 had indicated at the time the Bank’s next move was “more likely to be an increase”. Around February of this year, the RBA then changed its tune and stated “the probabilities around these scenarios were now more evenly balanced than they had been over the preceding year…”
Two months later, the RBA’s April minutes stated nothing was likely in the foreseeable future. “Given this outlook for further progress towards the Bank’s goals, members agreed that there was not a strong case for a near-term adjustment in monetary policy.” However, the minutes also stated a cut in the cash rate would be appropriate “where inflation did not move any higher and unemployment trended up…”
By May, the shift of the RBA’s outlook from “hawkish” to “dovish” was complete. “Members considered the scenario where there was no further improvement in the labour market in the period ahead, recognising that in those circumstances a decrease in the cash rate would likely be appropriate.”
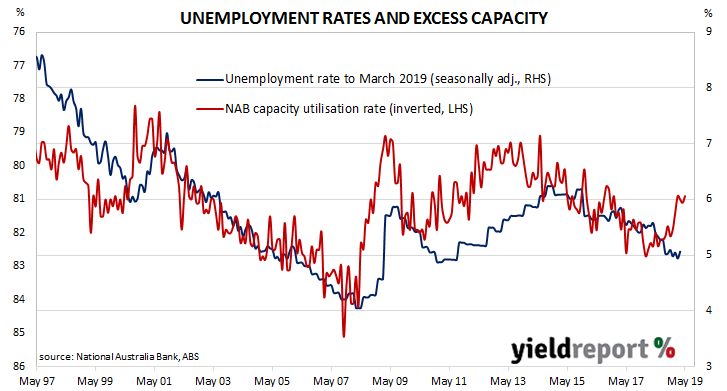
The minutes of the RBA Board’s June meeting have now been released. In the meeting, the Board’s deliberations focussed on spare capacity in the labour market and the various ways which indirectly indicate the extent of utilisation.
14 June 2019
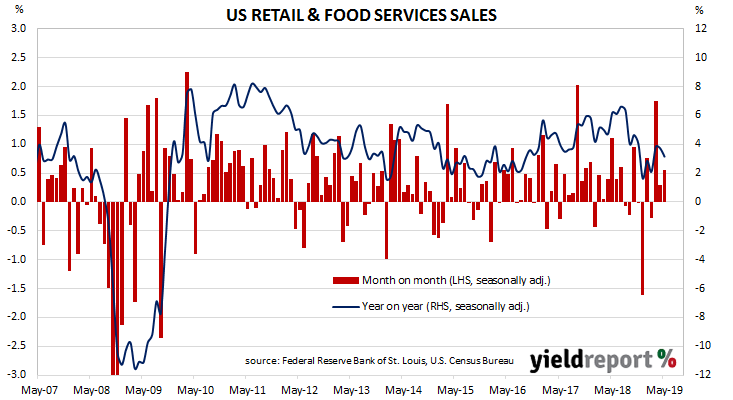
US retail sales had been trending up since late 2015 but, beginning in late-2018, a series of weak or negative monthly results led to a drop-off in the annual growth rate. Subsequent sales figures formed a downtrend which brought the annual rate below 2.0% by the end of the year. Growth in the March quarter was quite strong and, so far, the June quarter is looking positive.
According to the latest “advance” sales numbers released by the US Census Bureau, total retail sales increased by 0.5% in May, just under the +0.6% which had been expected and an improvement on April’s revised figure of +0.3%. On an annual basis, the growth rate slowed to 3.2% from April’s revised rate of 3.7%.
ANZ economist Kishti Sen said the report’s latest figures, along with revisions to April’s figures, “will help to stabilise anxiety about the outlook for the consumer during these turbulent times.”
14 June 2019
US consumer confidence had started 2019 at well above average levels in a longer-term context, although it was markedly lower than the more buoyant readings which typified most of 2018. After rebounding from the falls of January and February, US households have pretty much maintained a historically-high level of confidence.
The latest survey conducted by the University of Michigan indicates the average confidence level of US households has remained at an elevated level despite a slip. The University’s preliminary estimate of its Index of Consumer Sentiment dropped back from May’s revised figure of 100.0 to 97.9 in June, a little more than the market estimate of 97.0.
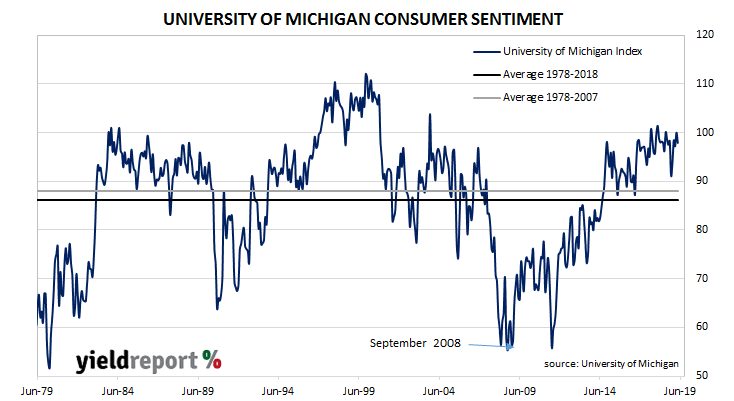
The University’s chief economist (Surveys of Consumers), Richard Curtin said tariffs and jobs were uppermost in the minds of US consumers. “In early June, consumer sentiment reversed the May gain due to tariffs as well as slowing gains in employment. Some of the decline was due to expected tariffs on Mexican imports, which may be reversed in late June, but most of the concern was with the 25% tariffs on nearly half of all Chinese imports.”
12 June 2019
The annual rate of US consumer inflation halved from nearly 3% in the period from July 2018 to February 2019, before it quickly increased back to 2%. However, “headline” inflation is known to be volatile and so the reference is often made to “core” inflation figures. This measure has mostly ranged between 2.00% and 2.30% in recent years, although its long term (since 1958) median has been 2.8%.
The latest consumer price index (CPI) figures released by the Bureau of Labor Statistics indicated seasonally-adjusted consumer prices increased on average by 0.1% in May, in line with the consensus figure but lower than April’s 0.3% increase. On a 12-month basis, the inflation rate slowed from April’s annual rate of 2.0% to 1.8%. The primary driver of the result was another increase in gasoline prices, with shelter costs (rents) the next largest factor.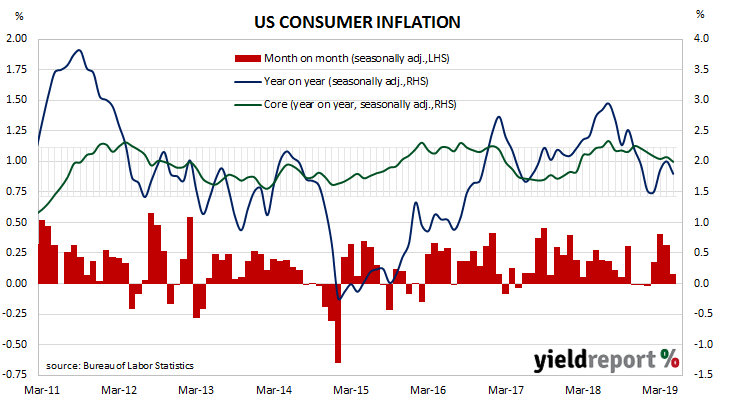 Core inflation, a measure of inflation which strips out the volatile food and energy components of the index, also increased on a seasonally-adjusted basis by +0.1% for the month. As a result, the annual rate slipped to 2.0%, less than the 2.1% consensus figure and a little slower than April’s 2.1%.
12 June 2019
After a lengthy divergence between consumer sentiment and business confidence in Australia which began in 2014, the two sectors converged again around July 2018. Currently, both measures are around neutral or slightly negative levels. The latest reading of consumer sentiment has not really changed anything, although one particular aspect may be a cause for concern.
According to the latest Westpac-Melbourne Institute survey conducted in early June, average household optimism has continued to remain close to neutral levels. The Consumer Sentiment Index reversed May’s modest increase as it moved back to 100.7 from 101.3. Any reading above 100 indicates the number of consumers who are optimistic is greater than the number of consumers who are pessimistic. The long-term average reading is just over 101.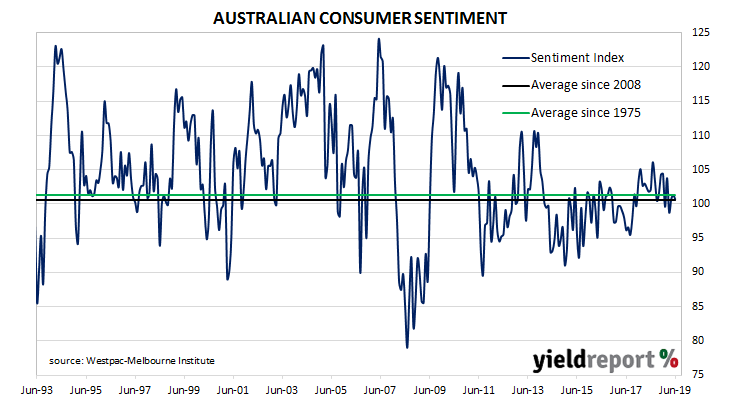
11 June 2019
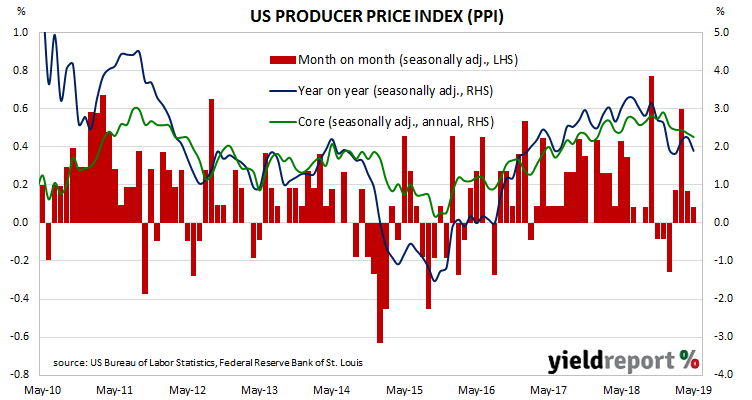
The producer price index (PPI) is a measure of prices charged by producers for domestically produced goods, services, and construction. In the US, it is constructed by the Bureau of Labor Statistics in a fashion similar to the consumer price index (CPI) except it measures prices received from the producer’s perspective. It is another one of the various measures of inflation tracked by the US Fed, along with core personal consumption expenditure (PCE) data.
The latest figures for May have been published by the Bureau and they indicate producer prices increased by just 0.1% during the month after seasonal adjustments. The result was in line with the expected figure but a notch down from April’s +0.2%. On a 12-month basis, the rate of producer price inflation after seasonal adjustments slowed to 1.9% after recording 2.3% in April and 2.2% in March. “Core” PPI inflation accelerated slightly from April’s 0.1% to 0.2% in May although the rate of annual increase slipped from 2.4% to 2.3%.
11 June 2019
Australian business conditions were robust in the first half of 2018 and a cyclical-peak was reached in April of that year. Although they remained well above average for some months, readings began to slip and by the end of 2018, they had dropped to below-average levels. Recent readings have been less than promising.
According to NAB’s latest monthly business survey of 400 firms conducted around the middle of May, business conditions have deteriorated to their worst levels since September 2014. Since the latter part of 2018, NAB’s conditions index had bounced between 3, which is on the low side of normal and 7, which is about average. However, the latest index reading of 1 is definitely at the bottom of normal territory.
 The latest reading of the confidence index jumped from April’s figure of 0 to 7, slightly above the long-term average reading of 6. Typically, NAB’s confidence index leads the conditions index by approximately one month, although some divergences appear from time to time.
10 June 2019
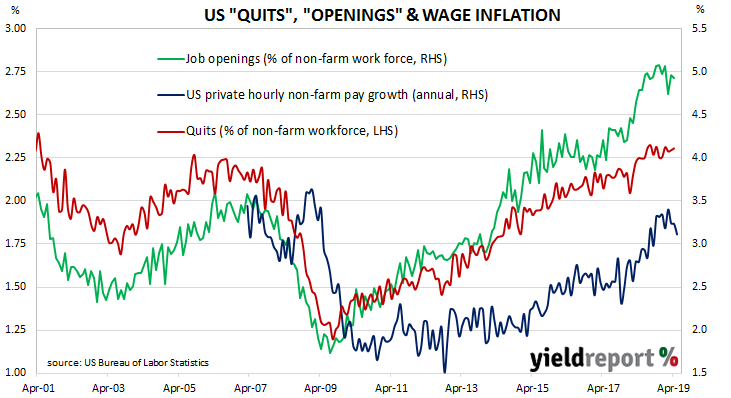
The quit rate as a percentage of total US non-farm employment had been rising slowly but steadily since the end of the GFC. It peaked in August 2018 and then stabilised, with total quits roughly increasing at the same rate as non-farm employment.
Figures released as part of the most recent JOLTS report show the quit rate has remained unchanged at a historically high level. During April, 2.3% of the non-farm workforce left their jobs voluntarily, the same rate as it has been since June 2018 after revisions to estimates of the total non-farm workforce. Quit numbers were highest in the real estate rental/leasing, “other services” and accommodation/food sectors while the healthcare and professional/business services sectors recorded the largest falls. Overall, the total number of quits slipped from March’s revised figure of 3.461 million to 3.482 million.