07 June 2019
The US economy continues to produce more jobs despite being close to full employment. The unemployment rate has remained at or under 4% since April 2018 while annual increases in hourly pay have remained above 3% for eight consecutive months. However, the latest monthly increase was less than expected and hourly pay rates slowed.
According to the US Bureau of Labor Statistics, the US economy created 75,000 jobs in the non-farm sector in May, considerably less than April’s revised increase of 224,000 and less than half of the 190,000 additional positions expected by economists. The unemployment rate remained steady at 3.6% despite an increase in the total number of unemployed by 64,000 to 5.888 million while the total number of people employed in both the farm and non-farm sectors increased by 113,000 to 156.758 million.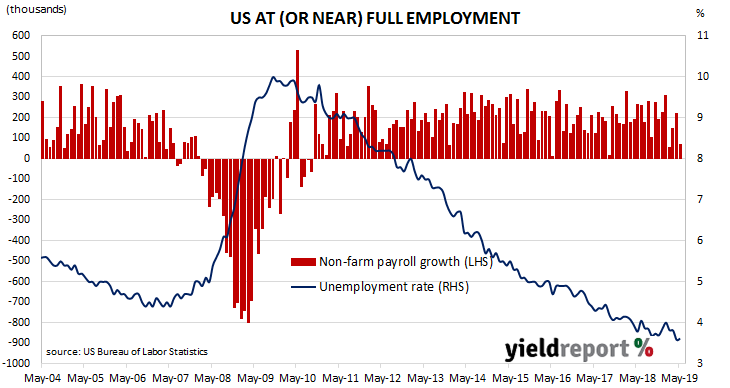
07 June 2019
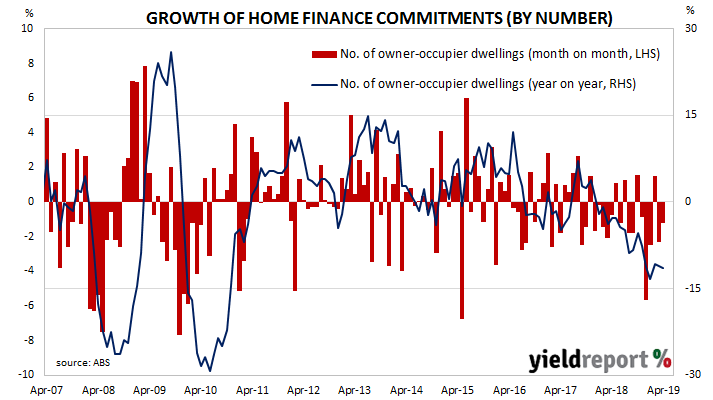
Since late 2017/early 2018, a very clear downtrend has been evident in the monthly figures of both the number and value of home loan commitments. After the figures from February were released, some economists speculated the worst may have been over. The latest numbers have not contradicted that assertion but nor have they really bolstered the case.
The ABS has released April’s housing finance commitment figures and they were less than expected. The total number of loan commitments to owner-occupiers fell by 1.2%, a larger contraction than the expected -0.3% and a continuation of March’s revised figure of -2.3%. On an annual basis, the growth rate further deteriorated from March’s revised figure of -11.0%, recording -11.5%. When “re-financings” are removed, the number of loan commitments fell by 1.1% over the month and by 13.5% when compared to commitments from April 2018.
Westpac senior economist Matthew Hassan described the result as “disappointing” but understandable given “the material improvement that has occurred since the Federal election and the prospective shift that is likely to come following the recent interest rate cut.”
ANZ economist Adelaide Timbrell went a little further, stating the figures represented “green shoots”. While she acknowledged “annual results are still showing substantial declines…” she noted “…these declines have been shrinking in the last few months.” She also suggested the federal election and the timing of holidays may have had some bearing on investor figures.
UBS economist George Tharenou agreed in part, at least with “the worst is over” approach. However, he saw some reasons to be cautious. “Looking forward we still see headwinds of tight credit from higher HEM (Household Expenditure Measure) benchmarks and increased verification, the roll out of Comprehensive Credit Reporting and potential Debt-To-Income limits, meaning we don’t expect a sharp reflation of housing in the near-term.”
05 June 2019
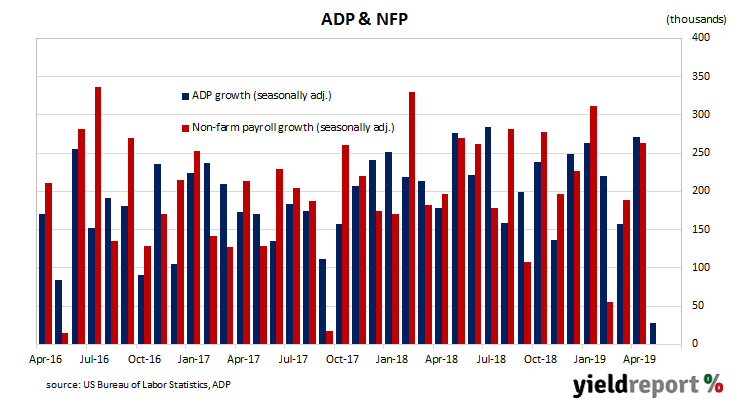
The ADP National Employment Report is published monthly by the ADP Research Institute. The report provides an estimate of US non-farm employment based in the private sector. Since the report began to be published in 2006, its total private sector non-farm employment figures have exhibited a high correlation with the Bureau of Labor Statistics (BLS) non-farm payroll figures.
The latest May figures indicate private sector employment grew by 27,000, well below the expected figure of 178,000 and drastically less than April’s revised increase of 271,000. Westpac described the figures as “the weakest reading since March 2010…”
US bond yields finished the day lower at the short end and market expectations of a rate cut firmed. 2-year Treasury bond yields finished 3bps lower at 1.85% while the 10-year and 30-year yields both remained unchanged at 2.13% and 2.65% respectively. The probability of a July rate cut implied by federal funds futures moved a little higher, from 66% to 70%, at a level where such a move by the US Fed would not come as a surprise.
04 June 2019
Growth figures of domestic retail sales have been declining since 2014 and they hit a low point in September 2017. Annual growth rates then began increasing for about a year, only to stabilise at around 3.0% to 3.5% through late-2018 and early-2019. The previous three months’ reports had provided some encouraging figures but this latest report may represent a return to a weakening trend.
According to the latest ABS figures, total retail sales contracted by 0.1% in April on a seasonally-adjusted basis, less than the +0.2% increase expected and well under March’s increase of +0.3%. On an annual basis, retail sales increased by 2.8%, down from March’s comparable figure of 3.5%.
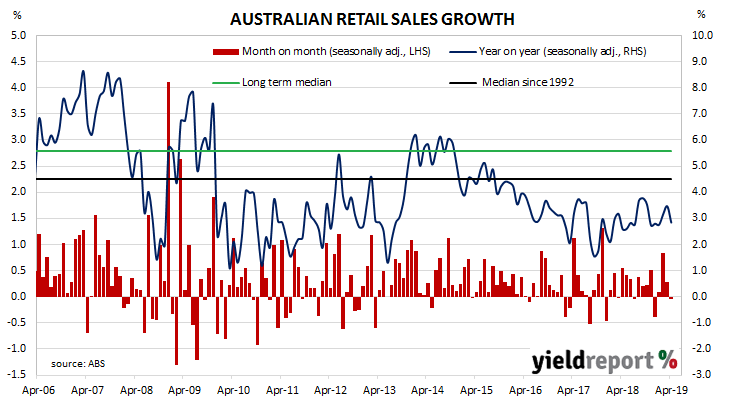 Westpac senior economist Matthew Hassan said, “While the timing of public holidays may have been a factor in April, both the sub-category and state detail point to wealth-effect spillovers from the Sydney and Melbourne led housing market corrections weighing on sales.” He described the result as “clearly soft” and also said there were signs “wealth effect drags may be intensifying.”
03 June 2019
US purchasing managers’ indices (PMIs) have been sliding since August 2018, albeit from elevated levels. After reaching a cyclical peak in September 2017, manufacturing PMI readings went sideways for a year before they started a downtrend. The latest reading has not done anything to end this.
US manufacturing activity slowed in May to a level last seen in late 2016. According to the latest Institute of Supply Management (ISM) survey, its Purchasing Managers Index recorded a reading of 52.1, down from April’s reading of 52.8 and below the market’s expected figure of 53.0. The average reading since 1948 is 52.9, so the latest reading is not far below the long-term average.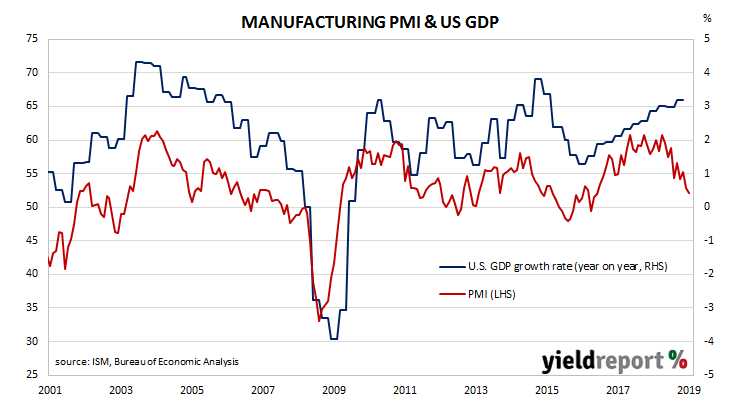 US bond yields finished the day considerably lower, especially at the short end, while market expectations of a rate cut were increased markedly. Whether this was purely the result of US domestic factors or, in part, a reaction to China’s “unreliable entities” list is debatable. In any event, by the end of the day, 2-year Treasury bond yields had plunged 11bps to 1.83%, the 10-year yield dropped by 6bps to 2.07% while 30-year yields were 4bps lower at 2.53%. The probability of a July rate cut implied by federal funds futures increased from 53% to 63%, up from 31% at the start of May.
03 June 2019
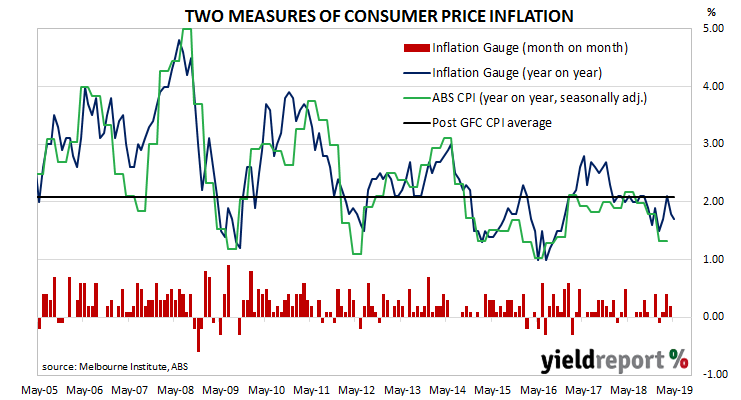
The Melbourne Institute’s Inflation Gauge is an attempt to replicate the ABS consumer price index (CPI) on a monthly basis. It has turned out to be a reliable leading indicator of the CPI, although there are periods in which the Inflation Gauge and the CPI have diverged for as long as twelve months. On average, the Inflation Gauge’s annual rate tends to overestimate changes in CPI inflation by an average of about 0.1% per quarter.
The Inflation Gauge index remained unchanged during May after a 0.2% increase in April and a 0.4% increase in March. On an annual basis, the index increased by 1.7%, down from April’s comparable rate of 1.8%. To date, this implies the headline CPI rate is around 1.6%. For the purpose of comparison, the annual CPI rate to the end of March was 1.3%.
03 June 2019
From mid-2017 onwards, year-on-year growth rates in the total number of job advertisements consistently exceeded 10%. That was until mid-2018 when the annual growth rate fell back markedly and then tracked lower for the remainder of 2018 and into 2019. The latest figures mark a continuation, perhaps even acceleration, of this trend.
May’s figures have now been released by ANZ and, after revisions and seasonal adjustments, total advertisements dropped by 8.4% to 152,689. On a 12-month basis, total job advertisements fell by 14.9%, a sharp deterioration from April’s comparable figure of -5.6% after revisions.
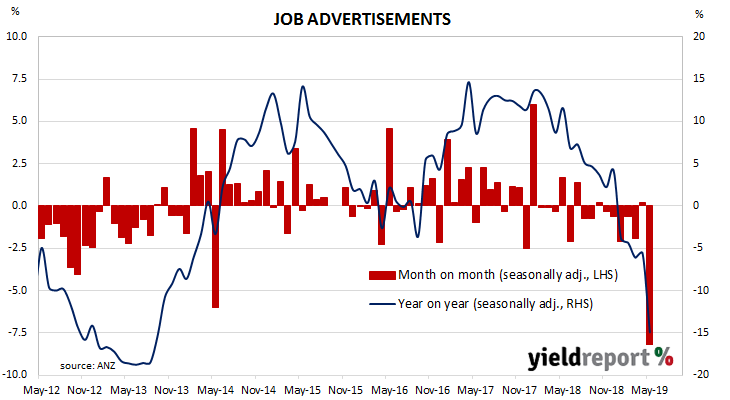 ANZ’s Head of Australian Economics, David Plank said the timing of certain holidays may have had a sizable effect on the figures this year. “Job ads were down sharply in May, which at face value points to a sharp slowing in employment growth. But we think there is a good reason why this decline is not representative of reality. Job ads plunged in the last week of April, which we think was due to the ‘holiday year’ effect that happens when ANZAC Day and Easter are close together.”
03 June 2019
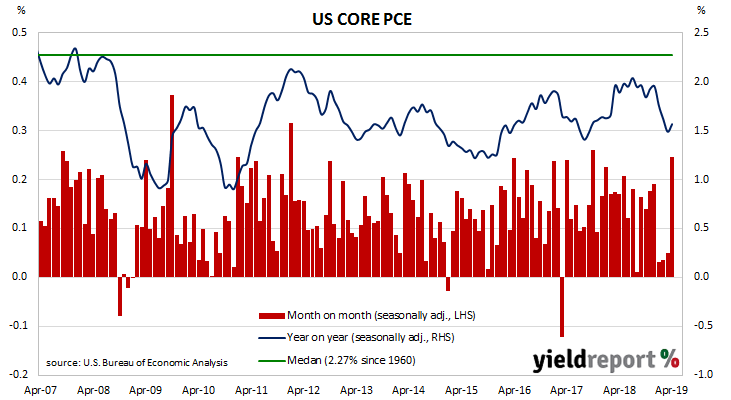
One of the US Fed’s favoured measures of inflation is the change in the core personal consumption expenditures (PCE) price index. After hitting the Fed’s target at 2.0% in mid-2018, the annual rate then hovered in a range between 1.8% and 2.0% through to the end of 2018. Since then, the annual rate has fallen back to around 1.5%.
The latest figures have now been published by the Bureau of Economic Analysis as part of the April personal income and expenditures report. Core PCE inflation was +0.2% for the month, up from March’s flat result and higher than the flat result which had been expected. On a 12-month basis, the core PCE inflation rate inched up from March’s revised figure of 1.5% to 1.6%.
31 May 2019
The pace of lending to the non-bank private sector by financial institutions in Australia has been trending down since October 2015. It appeared to have stabilised in the September quarter of 2018 but credit figures in the December quarter put paid to that idea and the latest figures have just continued the downtrend.
According to the latest RBA figures, private sector credit grew by 0.2% in April, down from March’s growth rate of 0.3% but in line with the consensus estimate. The annual growth rate slipped from March’s figure of 3.9% to 3.7% as home lending grew at a mediocre rate while business lending and personal lending further contracted.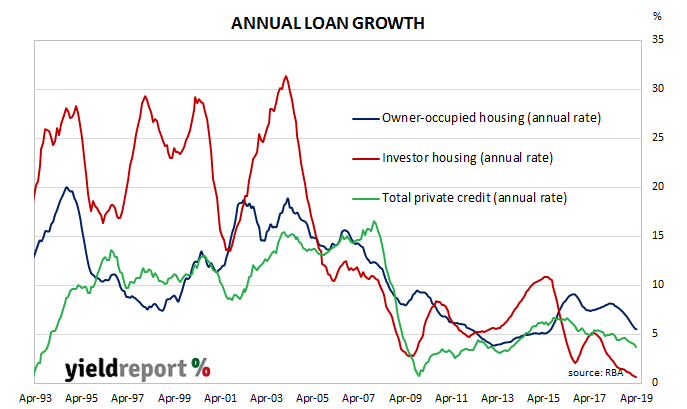 ANZ economist Hayden Dimes said recent regulatory amendments, expectations of interest rate cuts and the election outcome would cushion credit growth in the short term. “Although we do not expect a sharp rebound in housing credit, we do expect it to improve over the coming months. This reflects the changes to the mortgage affordability floor made by APRA, the boost in housing sentiment from the election outcome and the anticipated interest rate cuts by the RBA. The housing credit impulse has flattened slightly consistent with house price falls stabilising.”
30 May 2019
Approvals figures for dwellings, that is apartments and houses, have been heading south since mid-2018. As an indicator of investor confidence, falling approval figures represent a worrying signal, not just for the building sector but for the overall economy. However, some economists think the bottom of the cycle may be approaching.
The Australian Bureau of Statistics have now released the latest building approval figures and they indicate total approvals have fallen again. Seasonally-adjusted, total approvals fell by 4.7% in April, which is below the market consensus figure of a flat result but not as bad as March’s revised figure of -13.4%. On an annual basis, total approvals fell by 24.2%, as compared to March’s comparable figure of -25.4% after revisions.
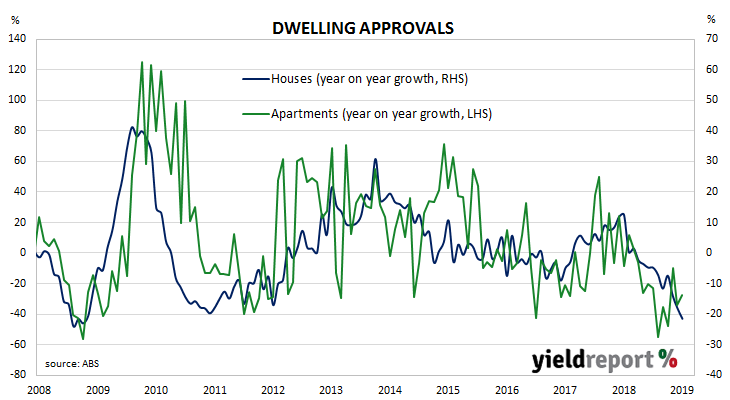 David Plank, ANZ’s Head of Australian Economics, thinks the approvals trough may be close. “Given the modest turn in the credit cycle, indicated by the ANZ-Property Council of Australia survey and recent events, we think we are getting close to the bottom of the downturn in residential approvals. The strong rise in non-residential approvals is encouraging.”

