01 May 2019
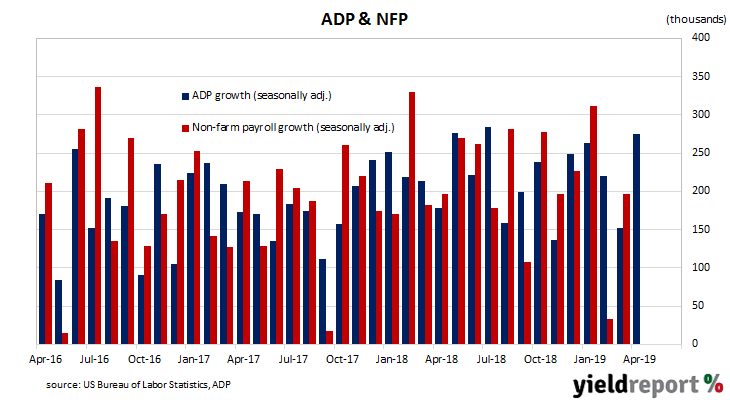
The ADP National Employment Report is published monthly by the ADP Research Institute. The report provides an estimate of US non-farm employment based on payroll data. Since the report began to be published in 2006, its total private sector non-farm employment figures have exhibited a high correlation with the Bureau of Labor Statistics (BLS) non-farm payroll figures.
The latest April figures indicate private sector employment grew by 275,000, well above the expected figure of 180,000 and not quite double March’s revised increase of 151,400. Westpac’s Finance AM team described the figures as “well above expectations” while ANZ economist Kishti Sen said the figures, in conjunction with weekly initial jobless claims data, indicates “a strong NFP report” at the end of this week. However, the Westpac team noted the survey’s “chequered track record in predicting non-farm payrolls…”
US bond yields finished the day higher and market expectations of a rate cut were wound back. 2-year Treasury bond yields finished 5bps higher at 2.31%, the 10-year yield remained unchanged at 2.50% while 30-year yields had lost 3bps to 2.90%. The probability of a December rate cut implied by federal funds futures slipped a little further away from the heights reached at the beginning of May to finish the day at 61%.
01 May 2019
US purchasing managers’ indices (PMIs) have been sliding since August 2018, albeit from elevated levels. After reaching a cyclical peak in September 2017, manufacturing PMI readings went sideways for a year before they started a downtrend. The latest reading has kept that downtrend intact.
US manufacturing activity slowed in April to a rate last seen in October 2016. According to the Institute of Supply Management (ISM) April survey, its Purchasing Managers Index recorded a reading of 52.8, down from March’s reading of 55.3 and below the market’s expected figure of 55.0.
The average reading since 1948 is 52.9, so the current reading is just below the long-term average. However, strong ADP figures were also released on the same day and they may have counteracted any negative assessments of the ISM figures.
US bond yields finished the day higher at the short end and lower at the long end while market expectations of a rate cut were wound back. 2-year Treasury bond yields finished 5bps higher at 2.31%, the 10-year yield remained unchanged at 2.50% but 30-year yields were 3bps lower at 2.90%. The probability of a December rate cut implied by federal funds futures slipped a little further away from the heights reached at the beginning of May to finish the day at 61%.
US bond yields finished the day higher at the short end and lower at the long end while market expectations of a rate cut were wound back. 2-year Treasury bond yields finished 5bps higher at 2.31%, the 10-year yield remained unchanged at 2.50% but 30-year yields were 3bps lower at 2.90%. The probability of a December rate cut implied by federal funds futures slipped a little further away from the heights reached at the beginning of May to finish the day at 61%.
30 April 2019
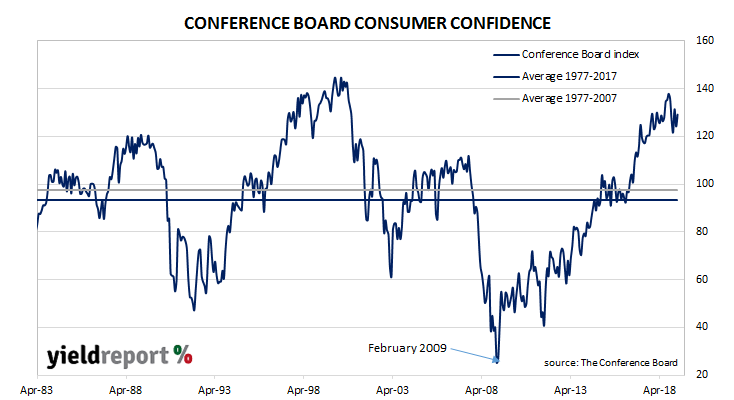
US consumer confidence collapsed in late 2007 as the US housing bubble burst and the US economy went into recession. By 2016, it had clawed its way back to neutral and then went from strength to strength until late 2018. After a dramatic drop through December and January, confidence levels then recovered in February. However, an element of volatility has been introduced in recent months.
The latest Conference Board survey indicates US consumers have recovered their optimism, at least in the short term. The latest reading came in at 129.2, up from March’s final figure of 124.2, thus reversing most of the 7.2 point fall from the previous month. From a historical perspective, readings around the current level are at well-above average levels.
The consensus expectation prior to the report was for a reading of around 126. Even so, US bond yields still finished the day consistently lower across the curve. 2-year, 10-year and 30-year Treasury bond yields all finished 3bps lower at 2.26%, 2.50% and 2.93% respectively.
30 April 2019
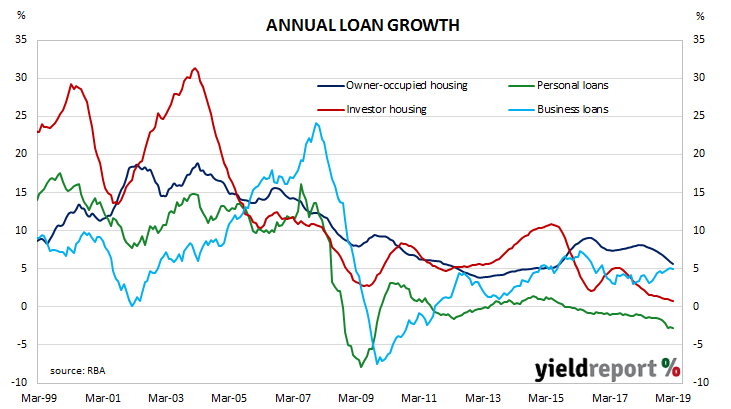
The pace of lending to the non-bank private sector by financial institutions in Australia has been trending down since October 2015. It appeared to have stabilised in the September quarter of 2018 but credit figures in the December quarter put paid to that idea. The latest figures confirm the first quarter of calendar 2019 has provided more of the same.
According to the latest RBA figures, private sector credit grew by 0.3% in March, the same growth rate as in February and in line with the 0.3% consensus estimate. However, the annual growth rate slipped from February’s revised figure of 4.1% to 3.9% as home and business lending continued to slow and personal lending further contracted.
The figures were largely as expected and the reaction of markets was minimal. By the end of the day, the yield on 3-year Treasury bonds had slipped 1bp to 1.26%, the 10-year yield remained unchanged at 1.80% and 20-year yields had inched up 1bp to 2.26%, largely ignoring an overnight increase of US Treasury bonds. Expectations of a rate cut remained largely unchanged. The implied probability of a rate cut at the RBA’s May Board meeting remained at 36% while an August cut is entirely factored in. By November, one rate cut is expected with another cut on top viewed as an 84% chance.
ANZ senior economist Cherelle Murphy said, “The housing credit impulse fell further in March, consistent with further declines in house prices. We expect housing credit to continue to be weak, as tighter credit conditions which led to the decline in house prices pass through the system. Although business credit growth saw a slight bounce in March, based on forward-looking loan approvals, we expect business credit to remain subdued.”
Andrew Hassan, a senior economist at Westpac, was in general agreement. “For private sector credit, it’s a case of another month, another soft update. Credit growth has moderated to a slow pace led by the housing downturn.” However, he noted “the pace of decline for the housing sector appears to have eased early in 2019.”
29 April 2019
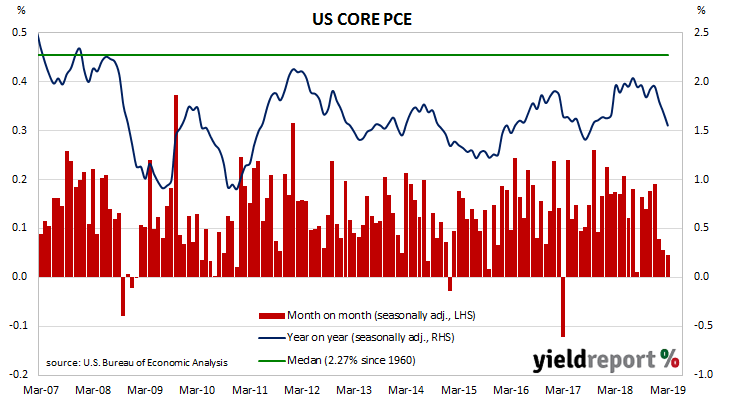
One of the US Fed’s favoured measures of inflation is the change in the core personal consumption expenditures (PCE) price index. After hitting the Fed’s target at 2.0% in mid-2018, the annual rate then hovered in a range between 1.8% and 2.0% through to the end of 2018. However, since then the annual rate has fallen quite noticeably.
The latest figures have now been published by the Bureau of Economic Analysis as part of the March personal income and expenditures report. Core PCE inflation was zero for the month, less than February’s +0.1% and lower than the expected +0.2% increase. On a 12-month basis, the core PCE inflation rate fell from February’s figure of 1.7% to 1.6%.
26 April 2019
The producer price index (PPI) is a measure of prices charged by producers for domestically-produced goods, services and construction. In Australia, it is constructed by the Australian Bureau of Statistics on a quarterly basis and without seasonal adjustments. It is similar to the consumer price index (CPI) except it measures prices received from the producer’s perspective.
The latest figures for the March quarter have been published and they indicate producer prices increased by 0.4% after seasonal adjustments, a minor slowing from the December quarter’s 0.5%. On a 12-month basis, the rate of producer price inflation slowed to 1.9% after previously recording 2.0% in the December quarter.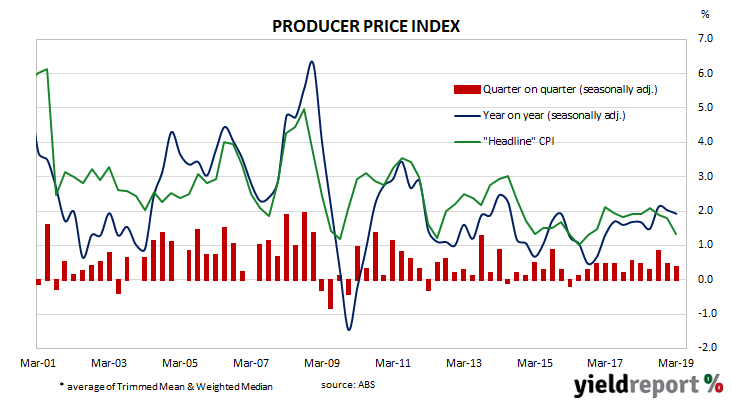
26 April 2019
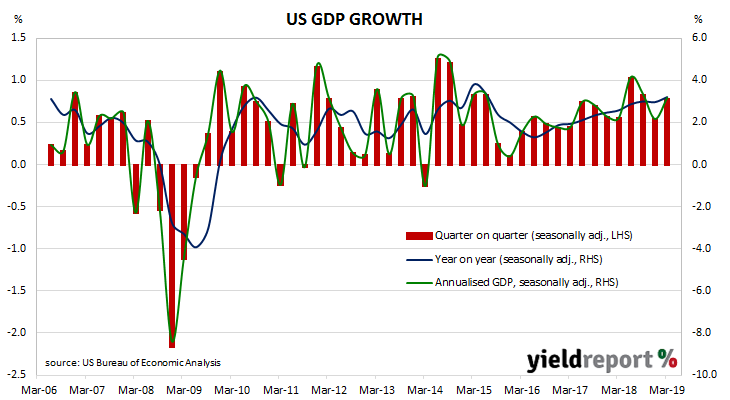
While the US has a historically low unemployment rate and strong GDP growth, bond yields suggest growth in the future will be less than what it is now. A rate cut is partially priced into December federal funds futures and the yield curve is fairly flat and almost bordering on inversion. However, the latest US GDP figures for the March quarter have not provided any hint of coming weakness, at least on the surface.
The US Commerce Department has released March quarter “advance” GDP estimates and they indicate the US economy grew at an annualised growth rate of 3.2%.
The growth figure was almost double the 1.8% median of market estimates and a jump from the December quarter’s 2.2%. However, Westpac’s AM Finance team noted “more than half the increase came from volatile inventories and trade…consumer spending and business investment slowed; final sales to private domestic purchasers, a better gauge of underlying momentum…cooled to a 1.3% annual pace, the slowest since 2013.” In other words, the “quality” of what would otherwise be seen as a strong growth figure was debatable.
18 April 2019
US retail sales have been trending up since late 2015. While there have been patches of weakness along the way, later months’ figures have rebounded to higher levels. After reaching an annual growth rate of 6.6% in July 2018, subsequent sales figures formed a downtrend which brought the annual rate below 2.0% by the end of the year. Since then, growth across the March quarter has generally been quite strong.
According to the latest “advance” sales numbers released by the US Census Bureau, total retail sales jumped by 1.6% in March, or double to +0.8% which had been expected and a marked reversal from February’s figure of -0.2%. On an annual basis, the growth rate increased to 3.6% from 2.2%.
Financial markets reacted in a subdued fashion but, by the end of the day, yields on 2-year were unchanged at 2.39% while 10-year and 30-year Treasury bonds had each lost 3bps to 2.56% and 2.96% respectively. Prices in the futures market for federal funds were not largely affected but the likelihood of a rate cut at the FOMC’s December meeting were trimmed from 43% to 41%.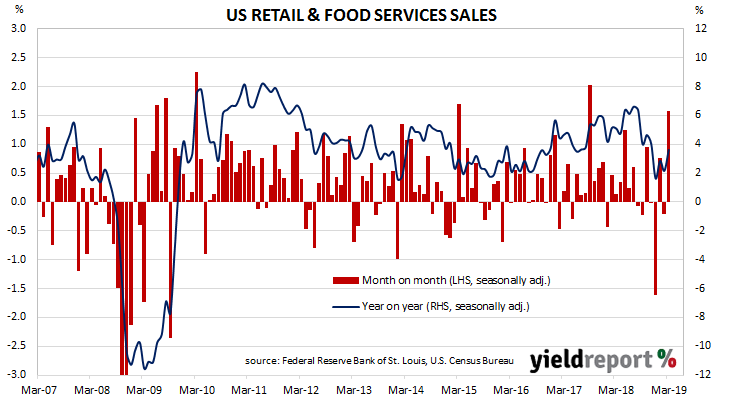
The “motor vehicle and parts dealers” segment had the largest influence during the month by far. It increased by 3.1% over the month but only managed a 12-month growth rate of 3.8%. The next largest influence came from the “gasoline station” segment with a 3.5% increase over the month. The non-store segment grew again, this time by 1.2% over the month and 11.65 over the last year. This segment includes vending machine sales, door-to-door sales and mail order sales but nowadays this segment has become dominated by online sales.
17 April 2019
Westpac and the Melbourne Institute describe their Leading Index as a composite measure which attempts to estimate the likely pace of economic activity relative to trend in Australia. The index combines certain economic variables which are thought to lead changes in economic growth into a single variable. Westpac views this variable as a reliable cyclical indicator for the Australian economy and an indicator of swings in Australia’s overall economic activity.
The six-month annualised growth rate of the indicator recovered from February’s figure of -0.56% to -0.09% in March. These figures represent rates relative to trend-GDP growth, which is generally thought to be around 2.75% per annum. The Index is said to lead GDP by 3 months to 6 months, so theoretically the current reading represents an annualised GDP growth rate of around 2.65% in mid-2019.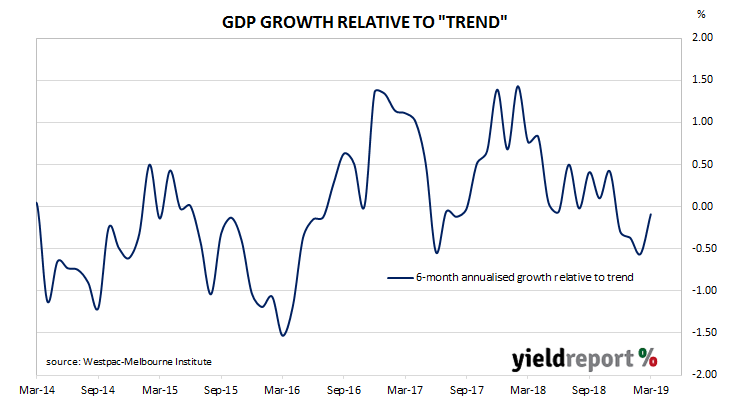
Westpac chief economist Bill Evans said, “Despite this recent lift the Index has still registered four consecutive months in which the growth rate has been negative. This continues to support the signal that growth through the first two to three quarters of 2019 is likely to be below trend.”
16 April 2019
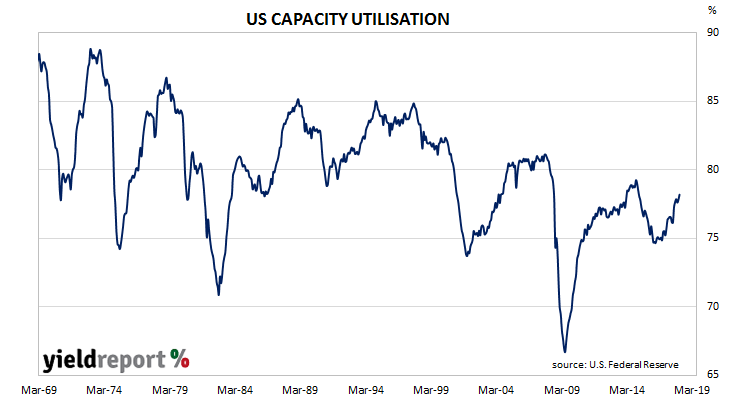
US industrial production eased a little in March, falling back to January’s level. According to the Federal Reserve’s March industrial production index, production slipped by 0.1%, reversing February’s +0.1% and missing the market’s expected figure of +0.3%.
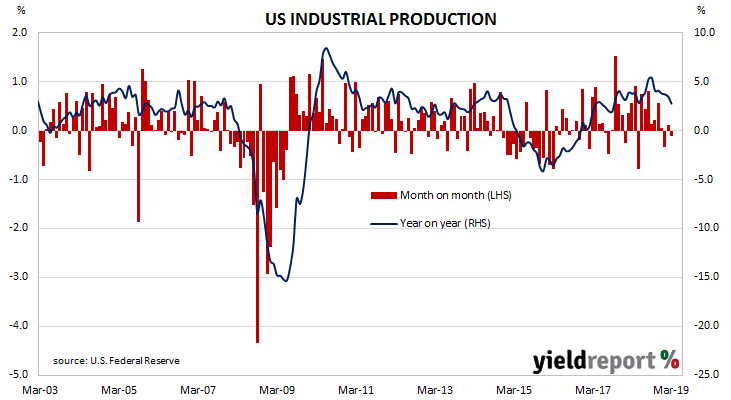
The same report includes US capacity utilisation figures which are generally accepted as an indicator of future investment expenditure and/or inflationary pressures. In the US, capacity utilisation had been trending up since mid-2016 after a sudden dip in 2015. However, since December 2018, utilisation rates have been slipping. March’s reading maintained this trend as it fell from 79.0% to 78.8%.