16 April 2019
The RBA held the official cash rate steady at its board meeting in April, as it had for every meeting since the cash rate was reduced to 1.50% in August 2016. Statements from RBA officials through 2018 had indicated the next move was “more likely to be an increase” until February of this year. Then, the RBA changed its tune and stated “the probabilities around these scenarios were now more evenly balanced than they had been over the preceding year…”
This perceived change in bias led confirmed market expectations regarding monetary policy. Whereas a rate increase had been largely expected until the end of last year, prices then rapidly moved to neutralise any idea of an increase. Shortly thereafter, they moved to price in a rate cut.
After the February meeting, a rate cut was almost totally factored into prices of interest-rate securities. As weeks passed, this expectation became a certainty as far as the collective wisdom of the market was concerned and by the time the March meeting had taken place, futures contracts implied a second rate cut had been significantly factored in.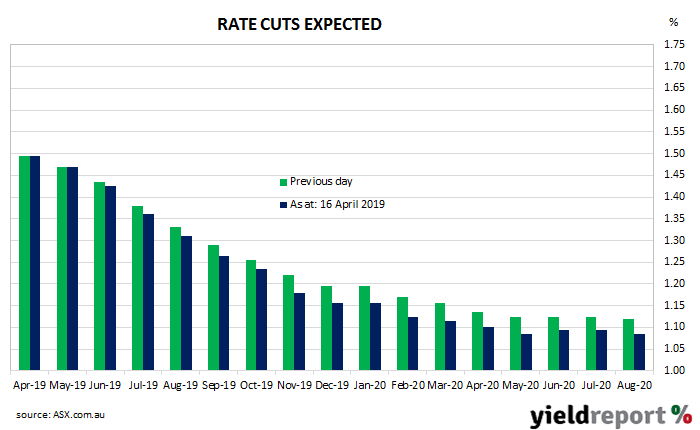
Most of the time, the RBA Board meeting’s minutes are used to clarify previous statements made by RBA officials or to pinpoint the issues on which the RBA has a current focus. However, economists had noted a change to the concluding paragraph of the statement which followed the April board meeting. The latest meeting’s minutes offered a chance to further understand the RBA’s thinking.
12 April 2019
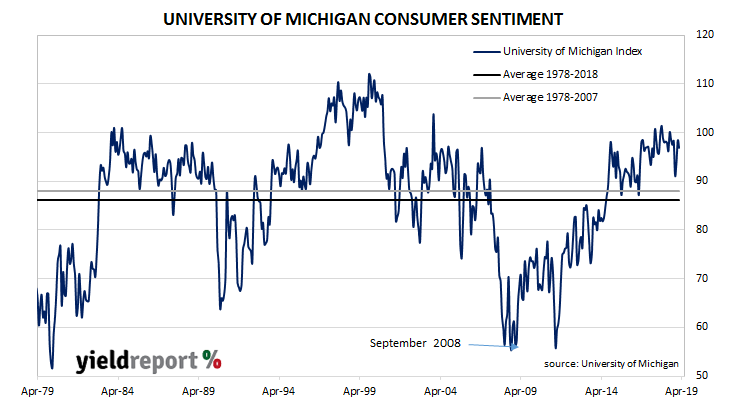
US consumer confidence had been under pressure in recent months, at least until recently, and less-confident households are generally inclined to spend less and save more. As private consumption expenditures account for a majority of GDP in advanced economies, household spending is a major determinant of a country’s overall expenditure/income. While fears regarding US growth prospects are prevalent, the latest consumer survey indicates household confidence has stabilised after a short, sharp drop and subsequent recovery in the first months of 2019.
The latest survey conducted by the University of Michigan indicates confidence levels of US households remain at elevated levels. The University’s Index of Consumer Sentiment result dropped back from March’s revised figure of 98.4 to 96.9 in April, less than the market estimate of 98. Westpac’s Finance AM team described the index at “still overall very healthy levels”.
The University of Michigan’s index is one of two monthly US consumer sentiment indices, the other being the Conference Board’s Consumer Confidence Survey. The University’s survey covers personal finances, business conditions and buying conditions.
11 April 2019
The producer price index (PPI) is a measure of prices charged by producers for domestically produced goods, services, and construction. In the US, it is constructed by the Bureau of Labor Statistics in a fashion similar to the consumer price index (CPI) except it measures prices received from the producer’s perspective. It is another one of the various measures of inflation tracked by the US Fed, along with core personal consumption expenditure (PCE) data.
The latest figures for March have been published by the Bureau and they indicate producer prices jumped by 0.6% during the month after seasonal adjustments. The result was greater than the expected 0.3% increase and noticeably above February’s 0.1% increase. On a 12-month basis, the rate of producer price inflation after seasonal adjustments accelerated to 2.2% after recording 1.8% in February and 2.5% in January.
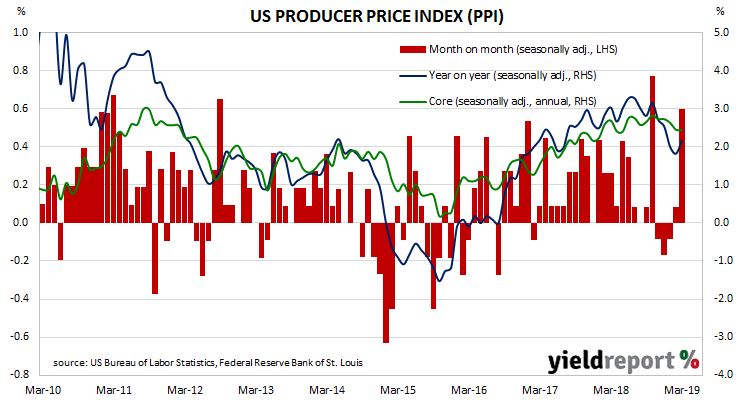
ANZ economist Jack Chambers said, “US PPI delivered its strongest increase in five months, up 0.6% in March, on the back of stronger petrol prices. Core measures were softer, suggesting a lack of underlying pipeline inflationary pressures.”
10 April 2019
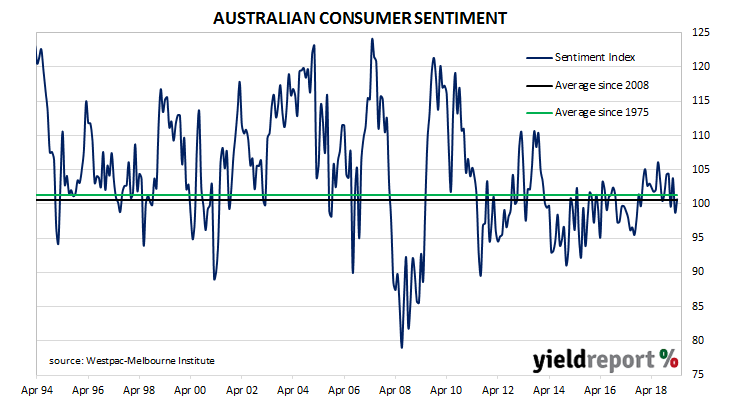
After a lengthy divergence between consumer sentiment and business confidence in Australia which began in 2014, around July 2018, the two sectors converged again to be largely in line with each other. Currently, both measures are around neutral or slightly negative levels. While the latest reading of consumer sentiment may have moved to a slightly optimistic one, it’s still a little below its long-term average.
According to the latest Westpac-Melbourne Institute survey conducted in the first week of April, average household optimism continued to bounce around neutral levels. The Consumer Sentiment Index moved up to just above 100 once again, this time from March’s reading of 98.8 to 100.7. Any reading above 100 indicates the number of consumers who are optimistic is greater than the number of consumers who are pessimistic. The long-term average reading is just over 101.
Westpac chief economist Bill Evans said, “The survey was conducted over the period April 1 to 5 and captures consumer reactions to the Federal Budget. While the month-to-month rise in sentiment is fairly muted, the survey detail suggests the Budget was well-received.”
Local bond yields finished the day lower, although they may have just moved in line with US changes overnight. By the end of the day, 3-year ACGB yields were unchanged at 1.40%, the 10-year yield had fallen by 3bps to 1.88% and the 20-year had lost 2bps to 2.31%.
10 April 2019
The annual rate of US consumer inflation halved from nearly 3% in the period from July 2018 to February 2019, before it then increased to just under 2%. At the same time, core inflation has been much less volatile and it has ranged between 2.00% and 2.30%. In recent times, differences between the two measures has mostly been caused by changes in gasoline (petrol) prices.
Consumer price index (CPI) figures released by the Bureau of Labor Statistics indicated seasonally-adjusted consumer prices increased on average by 0.4% in March, above the 0.4% consensus figure and higher than February’s 0.2% increase. On a 12-month basis, the inflation rate jumped from February’s annual rate of 1.5% to 1.8%. The primary driver of the increase was another move in gasoline prices.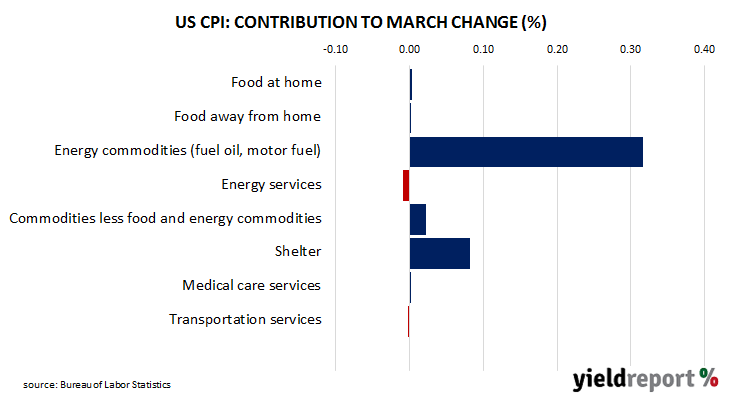 “Core” inflation, a measure of inflation which strips out the volatile food and energy components of the index, increased on a seasonally-adjusted basis by +0.1% for the month, under the 0.2% increase expected. The annual rate slipped from 2.1% to 2.0%.
09 April 2019
Since late 2017/early 2018, a very clear downtrend has been evident in the monthly figures of both the number and value of home loan commitments. The latest numbers have not done anything concrete to alter this picture, although some economists have speculated the worst may be over.
The ABS has released February’s housing finance commitment figures* and they were just a little more than expected. The total number of loan commitments to owner-occupiers increased by 2.0%, a bit more than the expected 0.5% increase and an improvement on January’s revised figure of -2.5%. On an annual basis, the deterioration in the growth rate slowed to -10.7% from -13.4% in January after revisions. When “re-financings” are removed, the number of loan commitments increased by 0.8% over the month while they contracted by 14.8% when compared to commitments from February 2018.
In dollar terms, total loan approvals excluding refinancing increased by 2.7% for the month, ending the string of consecutive months in which falls had taken place. However, on a year-on-year basis, total approvals excluding refinancing fell by 18.6%. Even so, this figure was still an improvement on January’s comparable figure -20.3% after revisions.

09 April 2019
The quit rate as a percentage of total US non-farm employment had been rising slowly but steadily since the end of the GFC. It approached its series peak in August 2018 but, since then, it has not increased any further.
Figures released as part of the most recent JOLTS report show the quit rate has remained effectively unchanged. During February, 2.3% of the non-farm workforce left their jobs voluntarily, the same rate as it has been since August after revisions to estimates of the total non-farm workforce. Quit numbers were highest in the education/health services and transportation, warehousing and utilities sectors while the professional/business services and “other services” sectors recorded the largest falls. Overall, the total number of quits slipped ever-so-slightly from January’s revised figure of 3.483 million to 3.480 million.
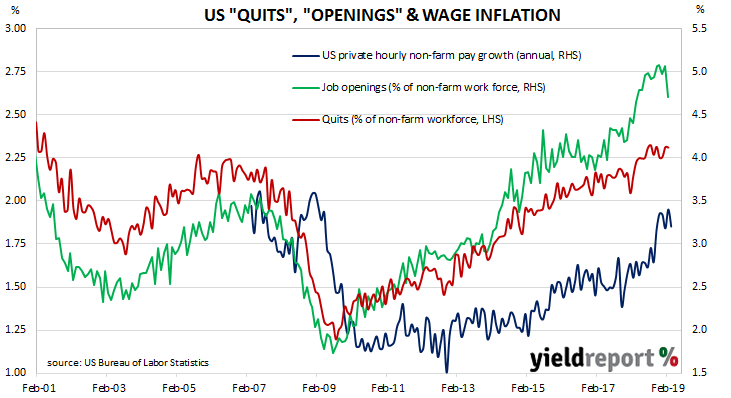
Job openings fell as well but the change was much more noticeable. Total vacancies during February dropped from January’s revised figure of 7.625 million to 7.087 million, well below market estimates of 7.566 million. Reduced openings in the accommodation and food services, real estate and health care and social assistance sectors led the way. The “other services” (maintenance and servicing) and the manufacturing of durable and non-durable goods sectors were the only ones to report increased openings.
08 April 2019
From mid-2017 onwards, year-on-year growth rates in the total number of job advertisements consistently exceeded 10%. That was until mid-2018 when the annual growth rate fell back markedly and then tracked lower for the remainder of 2018. Figures at the beginning of 2019 continued that trend and the latest figures have continued to do so.
March’s figures have now been released by ANZ and, after revisions and seasonal adjustments, total advertisements fell by 1.7% to 166,509. On a 12-month basis, total job advertisements shrank by 6.0%, a further deterioration from February’s comparable figure of -4.4% after revisions.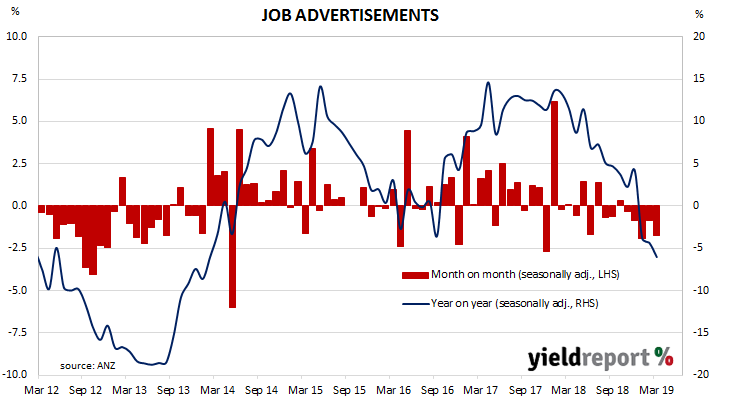 ANZ’s Head of Australian Economics, David Plank said, “Job ads are not showing any signs of reversing the weakness seen for some time.”
Reactions in local financial markets were consistent in their message, although bond yields may have been just following US movements from Friday night. In any case, by the end of the Australian trading day 3-year, 10-year and 20-year Treasury bond yields were all 3bps lower at 1.39%, 1.88% and 2.30% respectively.
05 April 2019
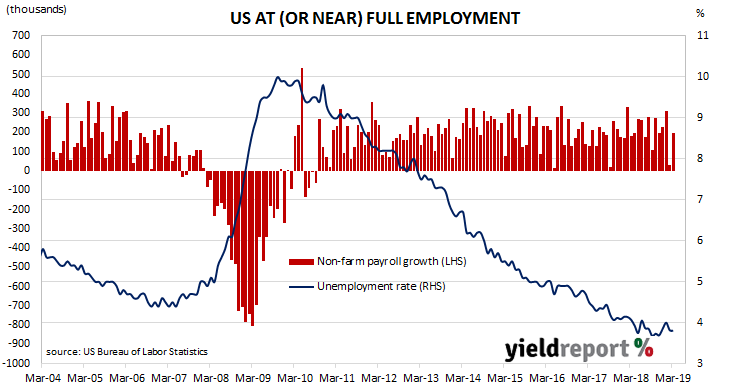
The US economy continues to produce more jobs despite being close to full employment. The unemployment rate has remained at or under 4% since April 2018 while annual increases in hourly pay have remained above 3% for the past six months.
According to the US Bureau of Labor Statistics, the US economy created 196,000 jobs in the non-farm sector in March. Economists had been expecting around 180,000 additional positions.
US bond yields finished a little lower across the curve while the US dollar was largely unchanged against other major currencies. By the end of the day, 2-year Treasury bond yields had lost 2bps to 2.31%, 10-year yields had fallen by 3bps to 2.49% and 30-year yields had lost 2bps to 2.91%.
 The figures may have had some impact on expectations of future Federal Reserve policy as the implied probability of a December rate cut was pruned back again, although this process has been taking place each day since the end of March. By the end of the day, federal funds futures implied a 51% chance of a rate cut at the FOMC’s December meeting, down from the previous day’s figure of 55%.
After revisions to previous months’ figures, the unemployment rate remained unchanged at 3.8% as the total number of unemployed people fell by 24,000 to 6.211 million while the total number of people employed in both the farm and non-farm sectors fell by 201,000 to 156.748 million.
04 April 2019
The ADP National Employment Report is published monthly by the ADP Research Institute. The report provides an estimate of US non-farm employment based on payroll data. Since the report began to be published in 2006, its total private sector non-farm employment figures have exhibited a high correlation with the Bureau of Labor Statistics (BLS) non-farm payroll figures.
The figures for March indicate private sector employment grew by 128,000, well under the expected figure of 180,000 and considerably lower than February’s increase of 197,000.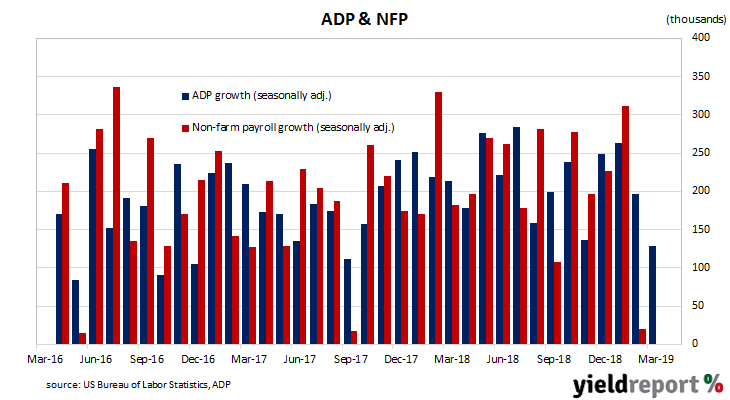
Westpac described the figures as indicative of “a loss of hiring momentum” but US bond yields finished the day higher and market expectations of a rate cut at the FOMC’s December meeting slipped. 2-year bond yields finished 3bps higher at 2.33% while 10-year and 30-year yields had each increased by 5bps lower to 2.52% and 2.93% respectively. The probability of a December rate cut implied by federal funds futures slipped further from its late-March peak of 73% and finished the day at 57%.

