07 March 2019
Retail sales figures have been lacklustre for the past couple of years but in 2018 the annual growth rate showed some signs of stabilising, albeit at a low rate. Annual growth rates started trending up in early 2018 and growth rates of individual months exceeded expectations on several occasions. However, December’s figures were substantially under market expectations and the latest batch of figures have missed as well.
According to the latest ABS figures, total retail sales increased by 0.1% over January on a seasonally-adjusted basis, below the expected +0.3% increase but a marked recovery from December’s revised figure of -0.4%. On an annual basis, retail sales increased by 2.7%, just under December’s revised figure of 2.8%.
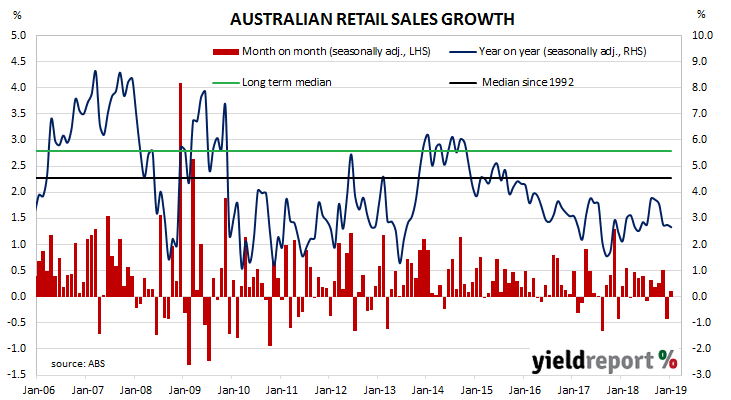 Westpac senior economist Matthew Hassan said, “Overall, the slight gain in January confirms retail spending remains very soft; not quite contracting in nominal terms but likely to be down in volume terms once price changes are excluded.”
Reactions in local financial markets was subdued. By the end of the day, the yield on 3-year Treasury bonds had ticked up 1bp to 1.62%, 10-year yields had shed 2bps to 2.08% while 20-year 2.61% remained unchanged at 2.47%. The Aussie dollar dipped from 70.35 US cents on the release and then climbed to 70.50 US cents before it finished the afternoon session at 70.45 US cents.
06 March 2019
The ADP National Employment Report is published monthly by the ADP Research Institute. The report provides an estimate of US non-farm employment based on payroll data. Since the report began to be published in 2006, its total private sector non-farm employment figures have exhibited a high correlation with the Bureau of Labor Statistics (BLS) non-farm payroll figures.
The figures for February indicate private sector employment grew by 183,000, a figure which is just under the expected figure of 185,000 but considerably lower than January’s comparable increase of 300,000.
US financial markets reacted in a muted fashion. Treasury bond yields finished the day a little lower; 2-year bond yields were 2bps lower at 2.52%, 10-year yields were 3bps lower at 2.69% and 30-year bond yields slipped 1bp to 3.07%. Federal funds futures barely moved and the implied likelihood of a change during 2019 remained close to zero.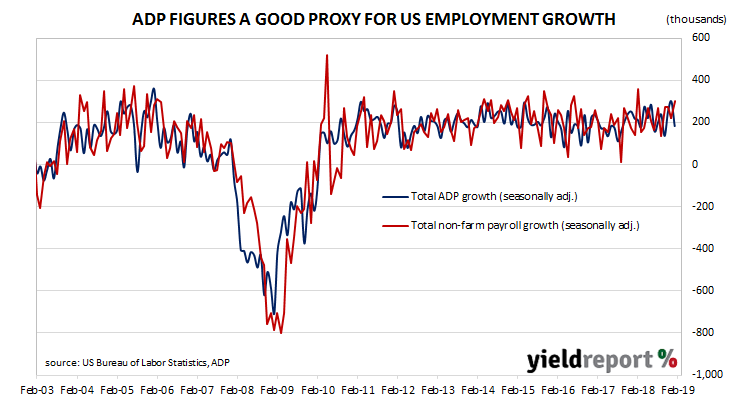
05 March 2019
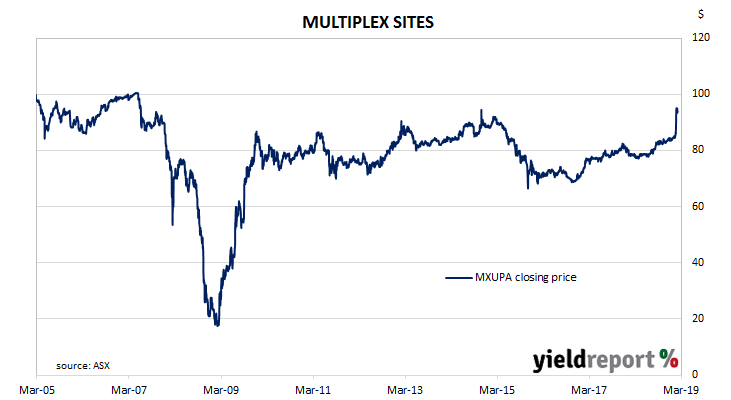
Don’t be surprised if Multiplex SITES (ASX code: MXUPA) are redeemed later this year. In a recent investor update, Brookfield, the Canadian parent company of Multiplex, said a sale of properties held by the Brookfield Australia Property Trust (BAPT), the downstream recipient of the funds raised by the SITES issue, may result in their redemption.
Multiplex’s Step-up Income-distributing Trust-issued Exchangeable Securities (SITES) were issued in 2005. The proceeds were loaned by the issuer, the Multiplex Hybrid Investments Trust, to the Multiplex Property Trust, now known as the BAPT.
Brookfield stated once the sale proceeds were received, the SITES responsible entity (the trustee) “will assess BAPT’s net asset position and cash-flow in determining what, if any action, to take (which may include redemption of SITES at Face Value…plus unpaid distributions at that time, if any).”
04 March 2019
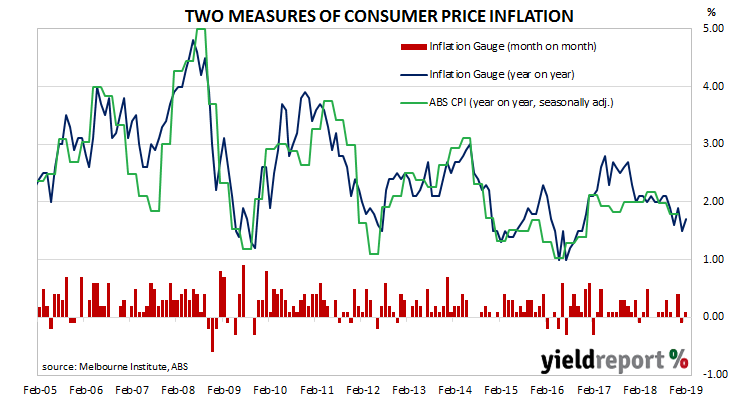
The Melbourne Institute’s Inflation Gauge is an attempt to replicate the ABS consumer price index (CPI) on a monthly basis. It has turned out to be a reliable leading indicator of the CPI, although there are periods in which the Inflation Gauge and the CPI have diverged for as long as twelve months. On average, the Inflation Gauge’s annual rate tends to overestimate changes in CPI inflation by an average of about 0.10% in any given quarter.
The Inflation Gauge increased by 0.1% during February after a 0.10% fall in January and a 0.40% increase in December. On an annual basis, the index increased by 1.7%.
04 March 2019
ANZ’s job advertisement survey is well-known as a leading indicator of employment numbers in Australia. As such, it is inversely related to the unemployment rate. ANZ’s survey reflects changes in demand for labour and it provides another measure of activity in the economy. There is also a fairly good inverse relationship between changes in Australia’s unemployment rates and changes in the RBA cash rate. Understanding the path of Australia’s unemployment rate has historically provided a reliable indicator of RBA rate changes.
From mid-2017 onwards, year-on-year growth rates in the total number of advertisements consistently exceeded 10%. That was until mid-2018 when the annual growth rate fell back markedly and then tracked lower for the remainder of 2018. Figures from the beginning of 2019 have continued that trend.
February’s figures have now been released and, after revisions and seasonal adjustments, total advertisements fell by 0.9% to 169,568. On a 12-month basis, total job advertisements shrank by 4.3%, a further deterioration from January’s comparable figure of -3.8% after revisions.
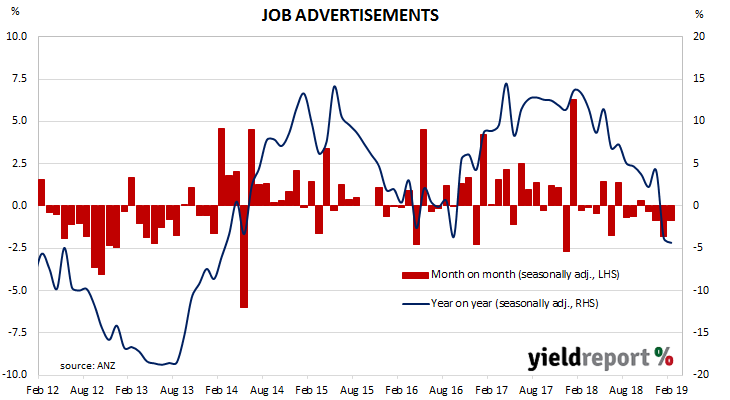 This latest fall comes on top of January’s 1.8% drop. ANZ’s Head of Australian Economics, David Plank said, “The year ahead looks to be more challenging on the employment front, with ANZ’s Australian Job Ads series declining for the fourth month in a row.”
04 March 2019
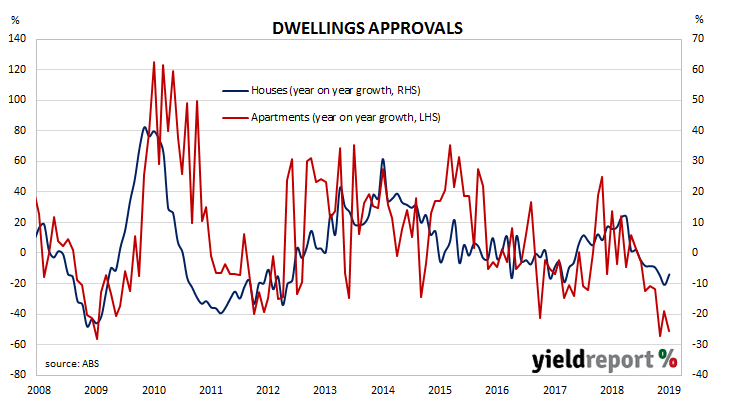
Aside from engineering and architectural design, one of the earliest requirements of a building project is to obtain approval from the relevant statutory body. While not all projects which have been approved are completed, all completed projects have been granted approval. Approvals data thus provides a useful indicator of future construction activity.
The latest building approval figures have been released by the Australian Bureau of Statistics and they indicate the downtrend which started in July has paused. Seasonally-adjusted, total approvals increased by 2.5% in January, which is over the market consensus figure of +1.5% and an improvement on December’s revised figure of -8.1%. However, on an annual basis, total approvals fell by 28.6%, as compared to December’s comparable figure of -22.0% after revisions.
Westpac senior economist Matthew Hassan said January’s figures should be treated with some caution. “As a rule, January housing data should be taken with a large grain of salt – the low flows through the holiday period mean any month to month noise is amplified by seasonal adjustment.”
01 March 2019
Purchasing Managers’ Indices (PMIs) are economic indicators derived from monthly surveys of purchasing and supply executives in private sector companies. They are diffusion indices, which means a reading of 50% represents no change from the previous period, while a reading under 50% implies respondents on average reported a deterioration. Their usefulness lay in being a leading indicator of GDP.
US manufacturing activity softened a little in February, falling back to the same level reached after December’s noticeable fall. According to the Institute of Supply Management (ISM) February survey, its Purchasing Managers Index recorded a reading of 54.2, down from January’s reading of 56.6 and under the market’s expected figure of 56.4.
The average reading since 1948 is 52.9, so the current reading is still above the long-term average. However, the reaction amongst observers to the report has not been favourable.
Personal consumption expenditure figures were released on the same day, so the individual reaction of financial markets to each of the reports is difficult to discern. In any case, US markets reacted by sending Treasury bond yields higher, with expectations of tighter monetary policy (in a technical sense) and a stronger US dollar.
01 March 2019
One of the US Fed’s favoured measures of inflation is the change in the core personal consumption expenditures (PCE) price index. After hitting the Fed’s target at 2.0% in July, the annual rate then slipped a little and then hovered around 1.9% until the end of 2018.
The latest figures have now been published by the Bureau of Economic Analysis as part of the December personal income and expenditures report. Note this report has been delayed by the US federal shutdown and it would have normally been released at the end of January rather than the end of February. At +0.2% for the month, core PCE inflation was the same as November’s +0.2% but more than the flat result expected. On a 12 month basis, the core PCE inflation rate registered 1.9%, the same as November’s comparable rate.
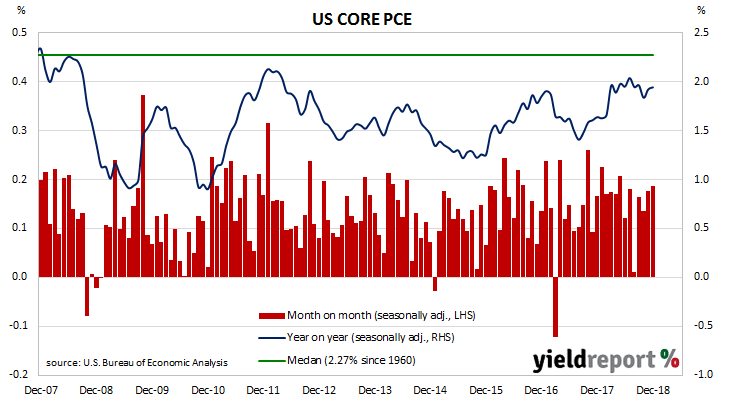
The core version strips out energy and food components, which are volatile from month to month, in an attempt to identify the prevailing trend. It’s not the only measure of inflation used by the Fed; it also tracks the Consumer Price Index (CPI) and Producer Price Index (PPI) from the Department of Labor.
The ISM February PMI was released on the same day, so the individual reaction of financial markets to each of the reports is difficult to discern. In any case, US markets reacted by sending Treasury bond yields higher, with expectations of tighter monetary policy (in a technical sense) and a stronger US dollar.
28 February 2019
Australia’s capital expenditure (capex) slump may have come to an end but stabilisation is probably all Australia can hope for in the near-term. Mining investment has continued to struggle and manufacturing investment is now a small portion and uninfluential portion of the overall total. Increased investment in the services sector is currently offsetting falling levels of investment elsewhere.
According to the latest ABS figures, seasonally-adjusted private sector capex in the December quarter increased by 2.0%, an improvement on the September quarter’s flat result after revisions but more than the 1.0% increase which was expected. On a year-on-year basis, the growth rate rebounded to +1.9% after recording a revised figure of +0.1% in the September quarter.
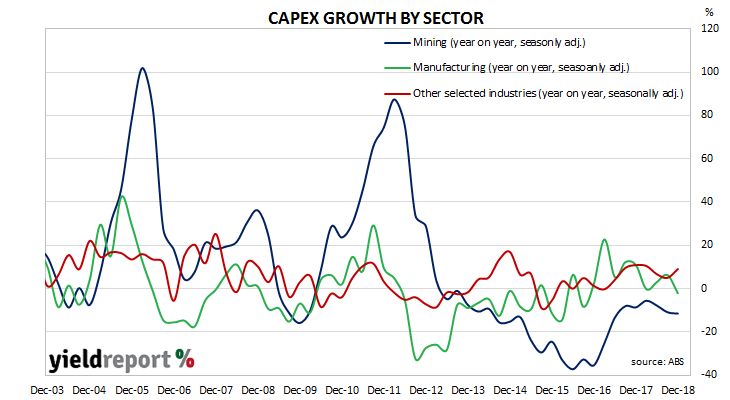 ANZ senior economist Felicity Emmett said the capex figures compared favourably with the construction figures from the previous day. “In complete contrast to the construction work done data, there was a solid rise in capex in Q4, driven by both construction and equipment. More important was the upgrade to business investment plans, with a non-mining firms planning a further solid expansion of investment in 2019-20, and mining firms now also more upbeat.”
28 February 2019
The pace of lending to the non-bank private sector by financial institutions in Australia has been trending down since it peaked in October 2015. It appeared to have stabilised in the September quarter of 2018 but credit figures in the December quarter put paid to that idea. January’s figures have provided more of the same.
According to the latest RBA figures, private sector credit grew by 0.2% in January, the same as December’s figure but less than the 0.3% consensus estimate. The annual growth rate slipped from December’s revised figure of 4.4% to 4.3% as investor lending continued to stagnate and personal lending contracted at a quicker pace.
Westpac senior economist Andrew Hanlan said the housing market was the prime determinant. “Key to this trend has been the housing sector. Housing credit growth has slowed over recent years: from 7.4% in 2015; 6.3% in both 2016 and 2017; to 4.7% in 2018. The latest annual reading is 4.4%.”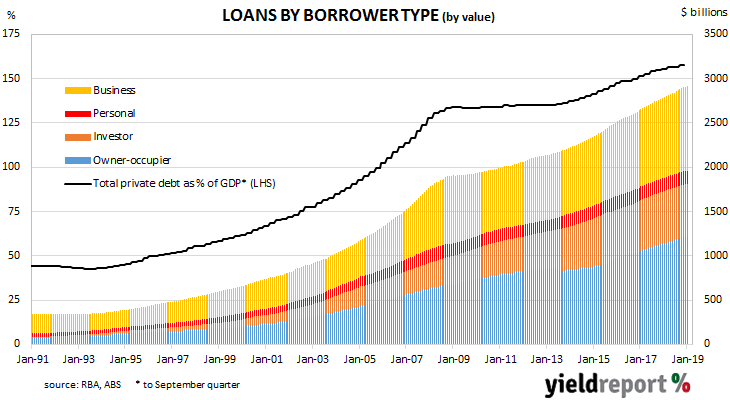 The figures were not terribly surprising and there were also December quarter capex figures with which to contend. By the end of the day, the yield on 3-year Treasury bonds remained unchanged at 1.64% while 10-year and 20-year yields had both increased by 3bps to 2.10% and 2.49% respectively, broadly following higher US bond yields, especially at the long end. Cash futures were also largely unaffected, with a rate cut 80% priced in by the end of November and fully factored in by February 2020.

