31 January 2019
The pace of lending to the non-bank private sector by financial institutions in Australia has been trending down since it peaked in October 2015. It appeared to have stabilised in the September quarter of 2018 but credit figures in the December quarter put paid to that idea.
According to the latest RBA figures, private sector credit grew by 0.2% in December, lower than November’s 0.3% and less than the 0.3% consensus estimate. The year-to-December growth rate slipped from 4.4% to 4.3% as investor lending continued to stagnate and personal lending contracted further.
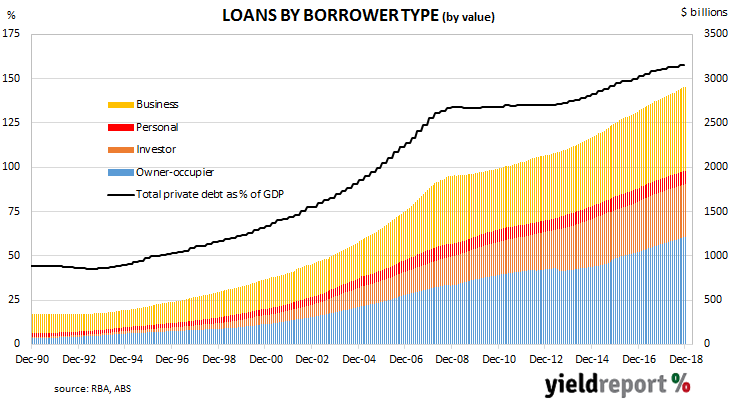 Economists expect the figures to continue to deteriorate on the back of lower house prices. Typical of the response to the figures was the one from ANZ economist Jack Chambers. “The focus remains on the continued slowdown in housing credit, with investor credit growth low and owner-occupier credit slowing. Critically, the housing credit impulse declined further in December.”
Reactions of financial markets was subdued. Australian Government bond yields finished the day ever-so-slightly higher, holding up despite sizable falls in US yields. 3-year and 10-year Treasury bond yields both finished unchanged at 1.74% and 2.24% respectively, while the 20-year yield crept up 1bp to 2.62%. The local currency was largely unchanged by the report and finished the afternoon session at 72.60 US cents.
30 January 2019
The January meeting of the US Fed’s Open Market Committee (FOMC) was not expected to produce any change in the federal funds rate range. However, there was also an expectation the FOMC may indicate an alteration to the number of rate increases expected in 2019. There was also some talk of a slowing of the pace of the Fed’s balance sheet reduction which comes about from the maturity of the Fed’s holding of bonds and RMBS.
The meeting was held and the public statement was released. The federal funds target range would be maintained at 2.25% to 2.50%, as expected. The US labour market “has continued to strengthen” and “economic activity has been rising at a solid rate”. However, the FOMC felt it was time for a pause.
The FOMC decided to delete the sentence which referred to the necessity of “some further gradual increases”. It was replaced with a reference to the maintenance of the current federal funds range as “most likely” to achieve the expected growth, employment and inflation outcomes. This reference to ‘further gradual increases” or “further gradual adjustments” has been present in the statements from previous meetings in 2018, including those in which rates were held steady.
Then there was the reference to patience. “In light of global economic and financial developments and muted inflation pressures, the Committee will be patient as it determines what future adjustments to the target range for the federal funds rate may be appropriate to support these outcomes.”
30 January 2019
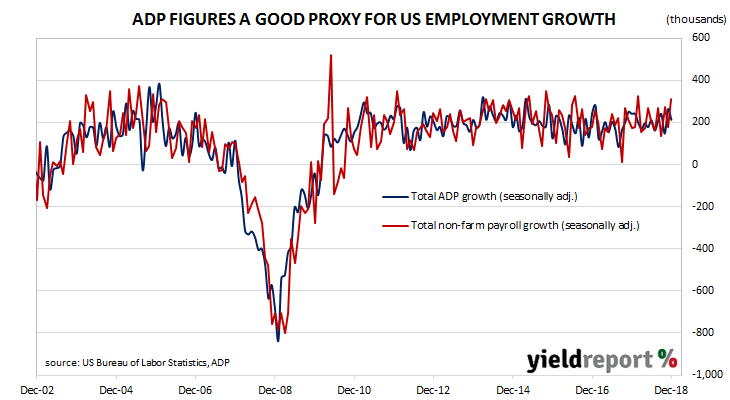
The ADP National Employment Report is published monthly by the ADP Research Institute. The report provides an estimate of US non-farm employment based on payroll data. Since the report began to be published in 2006, its total private sector non-farm employment figures have exhibited a high correlation with the Bureau of Labor Statistics (BLS) non-farm payroll figures.
The figures for January indicate private sector employment grew by 213,000, a figure which was higher than the expected figure of 190,000 but lower than December’s comparable increase of 263,000.
The report was overshadowed by the FOMC meeting and its subsequent rate-pause message and the report’s effect on bond yields was thus unclear. Treasury bond yields finished the day lower, especially at the short end. US 2-year Treasury bond yields were 6bps lower at 2.51%, 10-year yields were 4bps lower at 2.67% and 30-year bond yields slipped 1bp to 3.03%.
29 January 2019
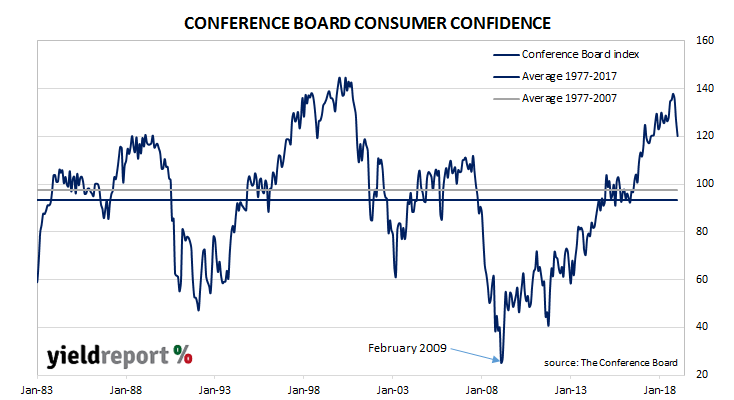
US consumer confidence collapsed in late 2007 as the US housing bubble burst and the US economy went into recession. By 2016, it had clawed its way back to neutral. Since then, American household confidence has gone from strength to strength. However, the latest figures may cause investors to wonder if the period of US consumer optimism is over.
The latest Conference Board survey indicates US consumers remain quite optimistic but not quite to the same degree as the heady levels in December. The latest came in at 120.2, down from December’s reading of 126.6 and lower than January 2018’s comparable figure of 124.3. However, this figure is still well above average.
US bond yields finished the day a touch lower. 2-year and 30-year Treasury bond yields were both unchanged at 2.60% and 3.07% respectively while 10-year yields slipped 1bp to 2.75%.
29 January 2019
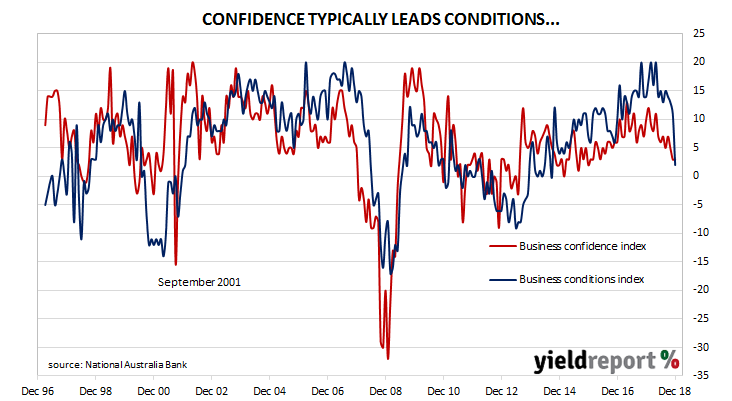
Australian business conditions were robust in the first half of 2018, especially so in April when one index registered an all-time high. Readings then slipped back but they were still well above average. Businesses reported some further slippage in the November survey but the figures were still on the positive side of the normal range. However, the latest report now marks a dramatic change.
According to NAB’s latest monthly business survey of 400 firms conducted in the second week of January, business conditions have fallen back sharply to below-average levels after four months of consecutive falls. After revisions, the index fell from 11 in November to 2 in early-January. NAB chief economist Alan Oster said, “Business conditions fell sharply in December and, while caution should be taken when interpreting data around the Christmas/New Year period, this outcome continues the downward trend in conditions over the second half of 2018.”
Westpac senior economist Andrew Hanlan agreed with his NAB colleague regarding the interpretation of Christmas-period data. However, he is also open to the idea the numbers may indeed be legitimate when he posed the question “is the December update a ‘false read’ or a watershed moment?” If it is a false read then the next report will produce a bounce of some sort. If not, then this latest report and “the fall in business conditions over the second half of 2018 suggests a significant slowing in the economy.”
23 January 2019
Westpac and the Melbourne Institute describe their Leading Index as a composite measure which attempts to estimate the likely pace of economic activity relative to trend in Australia. The index combines certain economic variables which are thought to lead changes in economic growth into a single variable. This variable is claimed to be a reliable cyclical indicator for the Australian economy and an indicator of swings in Australia’s overall economic activity.
The six-month annualised growth rate of the indicator fell back from a revised November figure of +0.42% to -0.27% in December. These figures represent rates relative to trend-GDP growth, which is generally thought to be around 2.75% per annum for Australia. The Index is said to lead GDP by 3 months to 6 months, so theoretically the current reading represents an annualised GDP growth rate of around 2.50% in March and/or June quarters.
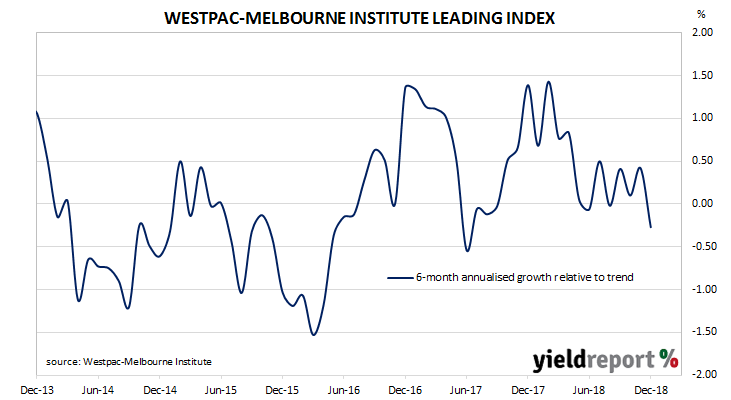
A month ago, Westpac chief economist Bill Evans said the Index growth rate pointed to “slowing momentum into the new year” despite a bounce in the index. After this latest report, he has continued to hold this view. “However, despite these choppy results, the major trend is consistent with our view that growth has slowed from a solid above-trend pace to at- or below-trend going forward.”
18 January 2019
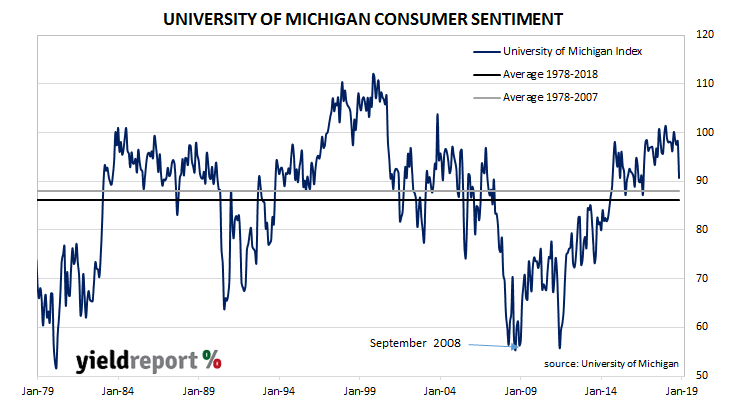
The University of Michigan’s Index of Consumer Sentiment is one of two monthly US consumer sentiment indices, the other being the Conference Board’s Consumer Confidence Survey. It covers personal finances, business conditions and buying conditions. As private consumption accounts for a majority of GDP growth in advanced economies, consumer sentiment surveys present a picture of the economy well in advance of official reports.
The latest survey conducted by the University indicates US consumers have been alarmed by increased uncertainties spanning US monetary, fiscal and trade policies as well as others. The result was a hefty drop in the index from 98.3 in December to 90.7 in January. However, it is still just above the long-term average (see chart below).
17 January 2019
The Australian Bureau of Statistics (ABS) collects data on housing finance commitments made by significant lenders. These figures include mortgage commitments for the construction or purchase of owner-occupied dwellings and investment properties. It has some overlap with the RBA’s monthly private sector credit statistics which also includes investor lending and owner-occupier lending. Since late 2017 / early 2018, a very clear downtrend has emerged in the monthly figures of both the number and value of home loans approved.
The ABS has released housing finance figures for November which, while better than expected, are still quite lacklustre. Total approvals decreased by 0.9%, down from October’s revised figure of +2.1%. On an annual basis, the growth rate recovered a little from October’s revised rate of -8.5% to record -7.9 in November. When refinancing approvals are removed, approvals fell by 0.6% over the month and by 10.0% since November 2017.
 The figures had little effect on financial markets. By the end of the day, the 3-year ACGB yield had slipped by 1bp to 1.76% while 10-year and 20-year yields remained unchanged at 2.28% and 2.67% respectively. The Aussie dollar finished the afternoon session down about 0.4 US cents at 71.60 US cents.
16 January 2019
During most of the period between 2014 and 2018 a divergence between consumer sentiment and business confidence in Australia was evident. Normally, the two sectors could be expected to generally track the same path, so an extended difference between the two was somewhat unusual. However, around July 2018, the two sectors converged again only to go their separate ways again in September. In December the business sector began to show some signs of weakness and now measures of consumer confidence have pulled back as well.
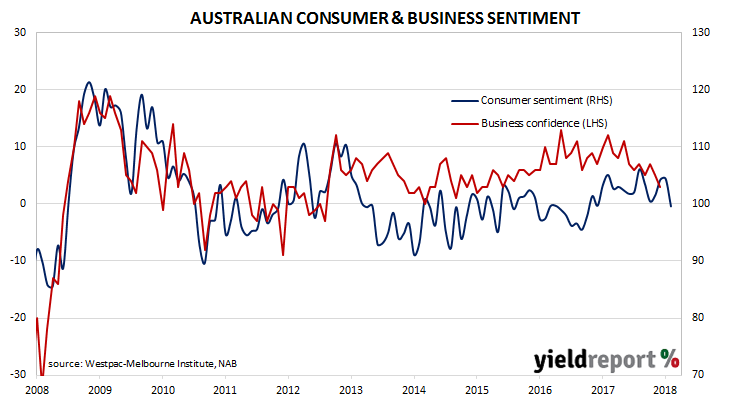 According to the latest Westpac-Melbourne Institute survey conducted in early-January, average household optimism fell away as the Consumer Sentiment Index dropped back under 100 from December’s reading of 104.4 to 99.6. Any reading above 100 indicates the number of consumers who are optimistic is greater than the number of consumers who are pessimistic. The long-term average reading is just over 101.
15 January 2019
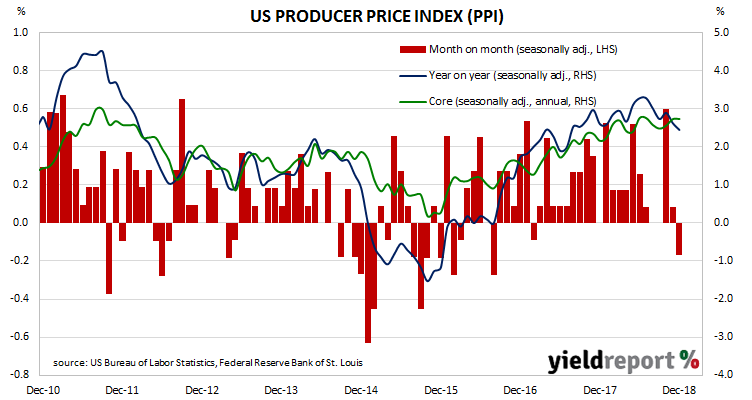
The producer price index (PPI) is a measure of prices charged by producers for domestically produced goods, services, and construction. In the US it is constructed by the Bureau of Labor Statistics in a fashion similar to the consumer price index (CPI) except it measures prices received from the producer’s perspective. It is another one of the various measures of inflation tracked by the US Fed, along with core personal consumption expenditure (PCE) data.
The latest figures for December have been published by the Bureau and they indicate producer prices fell by 0.2% during the month after seasonal adjustments. The result was under market expectations and it was lower than November’s 0.1% increase. On a 12-month basis, the rate of producer price inflation after seasonal adjustments fell back to 2.4% after recording 2.6% in November and 2.9% in October.