10 December 2018
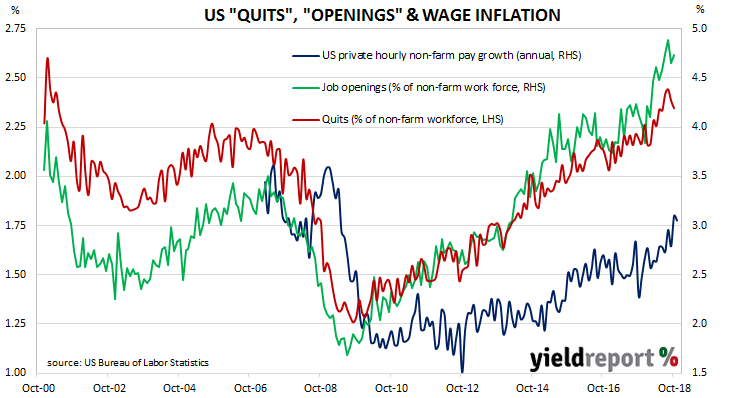
The “quits” rate time series produced by the Job Openings and Labor Turnover Survey (JOLTS) is a leading indicator of US hourly pay. As wages account for around 55% of a product’s or service’s price in the US, wage inflation and overall inflation rates tend to be closely related. Former Federal Reserve chief Janet Yellen was known to pay close attention to the quit rate.
Figures released as part of the most recent JOLTS report show the quit rate slipped a little as the total number of employees leaving their jobs during the month fell back. During October, 2.3% of the non-farm workforce left their jobs voluntarily, a lower rate than September’s comparable figure of 2.4%. Quit rates were highest in the health care and transport sectors while the retail and “other services” sectors recorded the largest falls. Overall, the total number of quits fell from 3.56 million to 3.51 million.
10 December 2018
The Australian Bureau of Statistics (ABS) collects data on housing finance commitments made by significant lenders and their figures include secured (mortgage) finance commitments for the construction or purchase of owner-occupied dwellings and investment properties. It has some overlap with the RBA’s monthly private sector credit statistics which also includes investor lending and owner-occupier lending.
The ABS has released housing finance figures for October which are better than expected. Total approvals increased by 2.2%, up from September’s 1.0% fall after revisions. On an annual basis, the growth rate recovered for a second consecutive month from a revised figure of -8.4% in September to -4.8% in October. When refinancing approvals are removed, approvals increased by 2.3% over the month while they were 7.3% lower than in October 2017.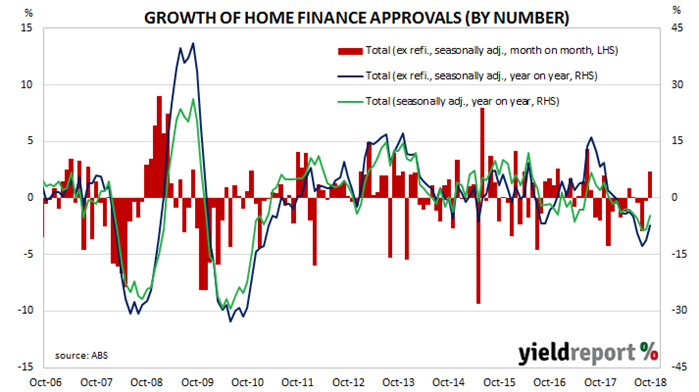
07 December 2018
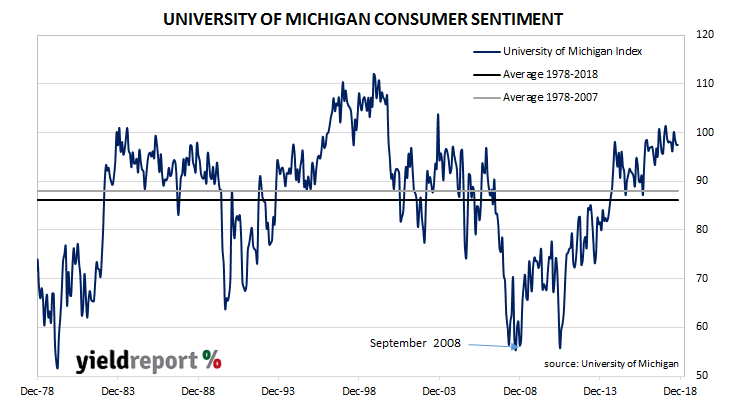
The University of Michigan’s Index of Consumer Sentiment is one of two monthly US consumer sentiment indices, the other being the Conference Board’s Consumer Confidence Survey. It covers personal finances, business conditions and buying conditions. As private consumption accounts for a majority of GDP growth in advanced economies, consumer sentiment surveys present a picture of the economy well in advance of official reports. However, as leading indicators, they are no more useful than other widely-available data.
The latest survey conducted by the University indicates US consumers view their overall prospects favourably despite their awareness of the aims of the Fed in raising interest rates. The result was there was no change in the index from November’s reading of 97.5, a reading which is still well above the long-term average (see chart below).
07 December 2018
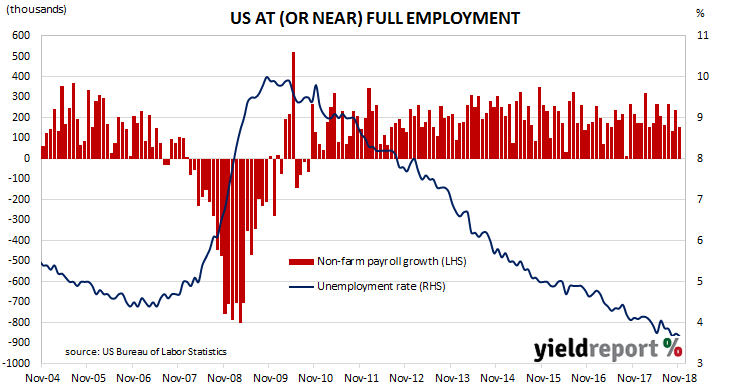
The US economy continued to produce more jobs in November, keeping the US unemployment rate at a level comparable with the 1960s. There have been some recent signs of accelerating wage growth, something which is likely to have implications for US monetary policy. However, the latest report lends little in the way of further support to the theme of growing wage inflation.
According to the US Bureau of Labor Statistics, the US economy created 155,000 jobs in the non-farm sector in November. Economists had been expecting around 200,000 additional positions and US markets reacted by sending bond yields lower. By the close of business, yields on US 2-year bonds had dropped by 7bps to 2.70%, 10-year bonds had shed 4bps to 2.85% and 30-year bonds had lost 2bps to 3.14%, although the 2% sell-off of the S&P 500 had something to do with it as well. Reactions in the currency markets were less consistent and the US dollar increased against the yen and sterling but fell against the euro.
03 December 2018
Aside from engineering and architectural design, one of the earliest requirements of a building project is to obtain approval from the relevant statutory body. As a result, building approvals data is a leading economic indicator of future construction. While not all projects which have been approved are completed, all completed projects have been granted approval. Approvals data thus provides a useful indicator of future construction activity.
The latest building approval figures have been released by the Australian Bureau of Statistics and figures for October indicated a return to the declines of July and August after a small bounce in September. Seasonally-adjusted, total approvals fell by 1.5% in October, in line with expectations and a partial reversal of September’s revised increase of 5.5%. On an annual basis, total approvals fell by 13.4%, a further deterioration from September’s comparable figure of -12.8% after revisions.

03 December 2018
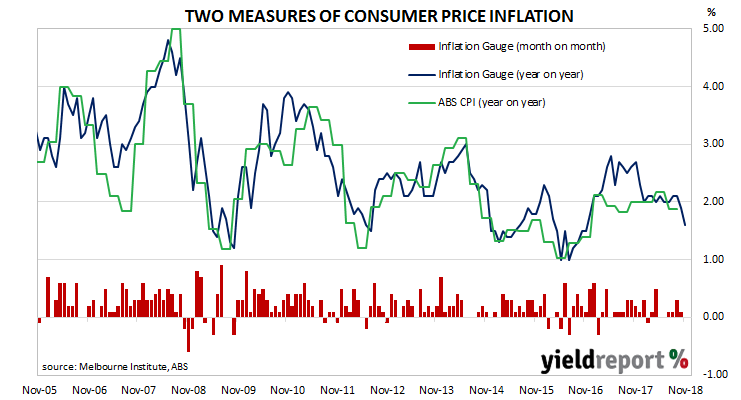
The Melbourne Institute’s Inflation Gauge is an attempt to replicate the ABS consumer price index (CPI) on a monthly basis instead of quarterly. It has turned out to be a reliable leading indicator of the CPI, although there are periods in which the Inflation Gauge and the CPI have diverged for as long as twelve months. On average, the Inflation Gauge’s annual rate tends to overestimate changes in CPI inflation by an average of about 0.10% in any given quarter.
The Inflation Gauge remained unchanged during November after a 0.10% increase in October and a 0.30% increase in September. On an annual basis, the index increased by 1.6%, the lowest annual rate since November 2016.
03 December 2018
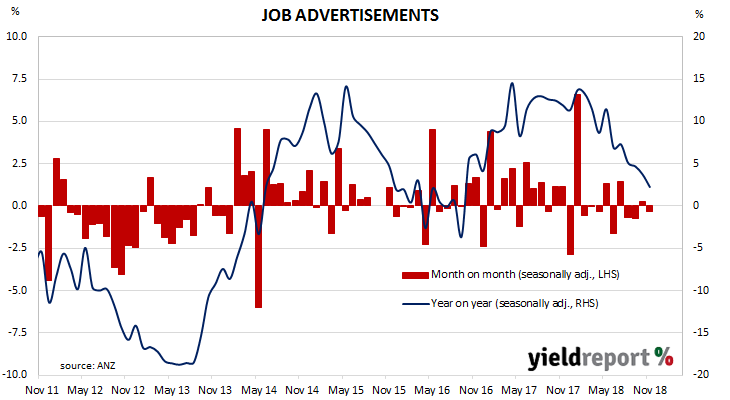
ANZ’s job advertisement survey is well-known as a leading indicator of employment numbers in Australia. As such, it is inversely related to the unemployment rate. ANZ’s survey reflects changes in demand for labour and it provides another measure of activity in the economy. There is also a fairly good inverse relationship between changes in Australia’s unemployment rates and changes in the RBA cash rate. Understanding the path of Australia’s unemployment rate has historically provided a reliable indicator of RBA rate changes.
From mid-2017 onwards, year-on-year growth rates in the survey’s total number of advertisements exceeded 10%. That was until recently; figures from August onwards generally indicated falls in the number of advertisements on a monthly basis. Now the annual growth is not much above zero.
November’s figures have now been released and, after revisions and seasonal adjustments, total advertisements decreased by 0.3% to 175,726. On a 12-month basis, total job advertisements grew by 2.3%, a fall from October’s comparable annual growth rate of 3.7%.
03 December 2018
Purchasing Managers’ Indices (PMIs) are economic indicators derived from monthly surveys of purchasing and supply executives in private sector companies. They are diffusion indices, which means a reading of 50% represents no change from the previous period, while a reading under 50% implies respondents on average reported a deterioration. Their usefulness lay in being a leading indicator of GDP.
US manufacturing activity rebounded in November after a minor fall in October. According to the Institute of Supply Management (ISM) November survey, its Purchasing Managers Index recorded a reading of 59.3, up from October’s reading of 57.7 and more than the expected figure of 58. Readings at these levels are very much in the elevated range.
US bond yields reacted in a mixed way. While 2-year Treasury bond yields increased by 4bps to 2.82%, 10-year yields fell by 2bps to 2.97% and 30-year yields dropped by 4bps to 3.25%. The US dollar was weaker against the euro but stronger against the yen and sterling.
30 November 2018
The pace of lending to the non-bank private sector by financial institutions in Australia has been trending down since it peaked in October 2015. It stabilised in July and picked up a little in August and September but some economists expect the downward trend to continue unless business lending can take over from lending to purchase homes.
According to the latest RBA figures, private sector credit grew by 0.4% in October, the same rate as for September’s revised figure and in line with the consensus estimate. The year-to-October growth rate remained unchanged for a second consecutive month at 4.6% as lending to owner-occupiers and the business sector offset lower growth rates elsewhere.
ANZ economist Jack Chambers described the result as a “soft” one, with the combined growth rate of the owner-occupier and investor segments lower than September’s combined rate. As a result, he expects “that house prices will continue to decline through 2019.”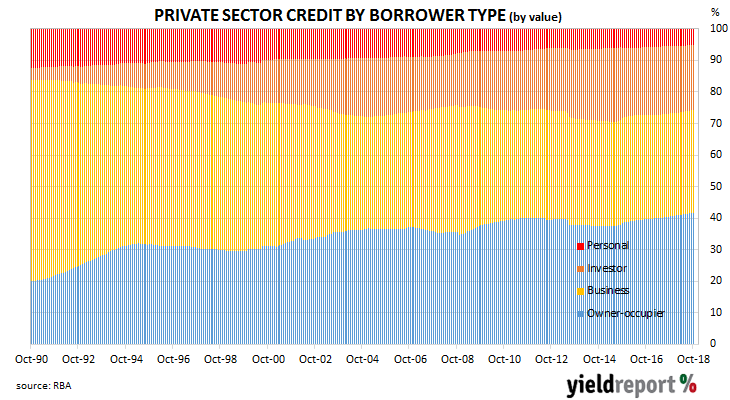
30 November 2018
One of the US Fed’s favoured measures of inflation is the change in the core personal consumption expenditures (PCE) price index. After hitting the Fed’s target at 2.0% in July, the annual rate then slipped a little in August and September.
The latest figures have now been published by the Bureau of Economic Analysis as part of the October personal income and expenditures report. At +0.1% for the month, core PCE inflation was lower than September’s +0.2% and lower than the +0.2% consensus expectation. On a 12 month basis, the core PCE inflation rate registered 1.8%, a fall from September’s comparable rate of 1.9%.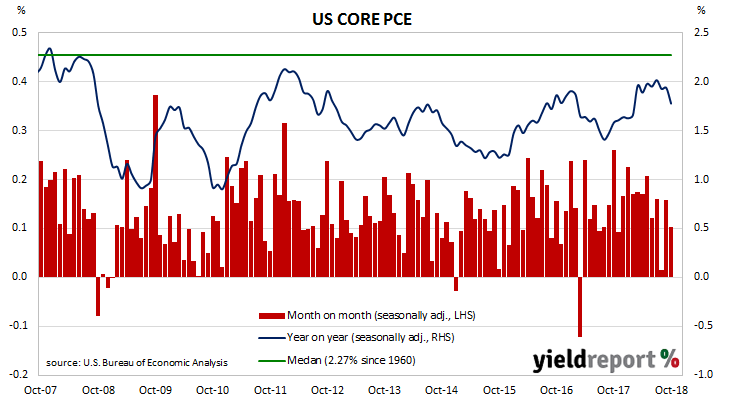 ANZ Head of FX Strategy Daniel Been said the figures confirmed a lack of inflationary pressure in the US. “Despite the tight labour market and recent lift in wages, there is little evidence that inflation is accelerating.”
The core version strips out energy and food components, which are volatile from month to month, in an attempt to identify the prevailing trend. It’s not the only measure of inflation used by the Fed; it also tracks the Consumer Price Index (CPI) and Producer Price Index (PPI) from the Department of Labor.

