09 November 2018
The producer price index (PPI) is a measure of prices charged by producers for domestically produced goods, services, and construction. In the US it is constructed by the Bureau of Labor Statistics in a fashion similar to the consumer price index (CPI) except it measures prices received from the producer’s perspective. It is another one of the various measures of inflation tracked by the US Fed, along with the CPI and core personal consumption expenditure (PCE).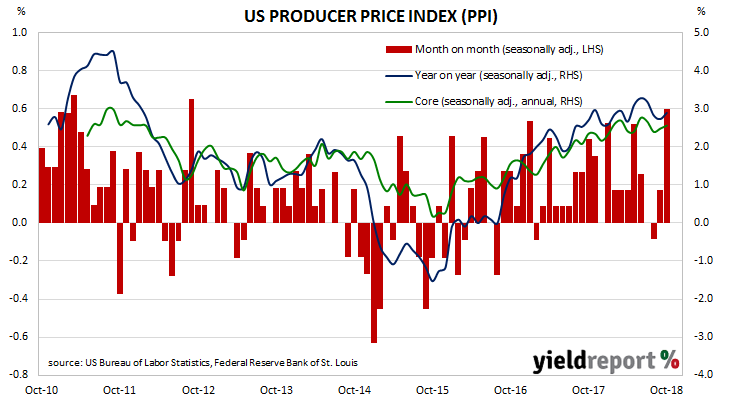
The latest figures for October have been published by the Bureau and they indicate producer prices increased by +0.6% during the month. The result was more than the expected +0.2% and the highest since September 2012. On a 12-month basis, the rate of producer price inflation moved to 2.9% after recording 2.7% in September and 2.8% in August.
06 November 2018
The “quits” rate time series produced by the Job Openings and Labor Turnover Survey (JOLTS) is a leading indicator of US hourly pay. As wages account for around 55% of a product’s or service’s price in the US, wage inflation and overall inflation rates tend to be closely related. Former Federal Reserve chief Janet Yellen was known to pay close attention to the quit rate.
Figures released as part of the most recent JOLTS report show the quit rate remained unchanged after revisions. During September, 2.4% of the non-farm workforce left their jobs voluntarily, the same rate as in August. Quit rates were highest in the “accommodation and food services” and “educational services” sectors while the “wholesale trade” and transportation, warehousing, and utilities” sectors recorded the largest falls. Even though the quit rate remained unchanged, the total number of quits actually fell from 3.65 million to 3.60 million.

Total job openings also fell. Total vacancies during September fell back from August’s revised figure of 7.293 million to 7.009 million, led by falls in the “professional and business services” and “finance and insurance” sectors. Increased openings in the “health care and social assistance” and “accommodation and food services” sectors provided some offset. As a percentage of the non-farm workforce, job openings increased from August’s revised figure of 4.9% to 4.7% in September.
05 November 2018
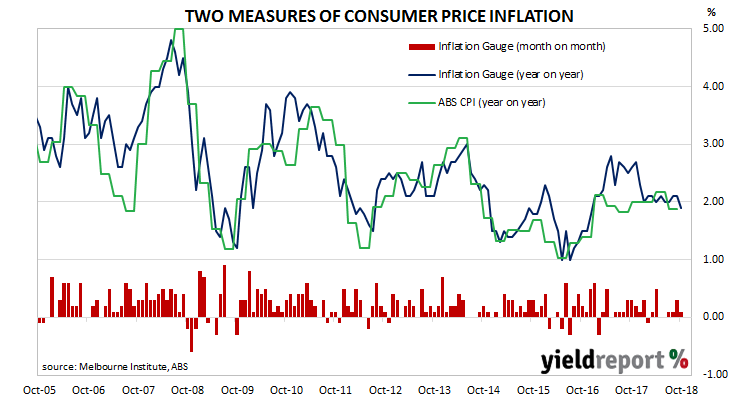
The Melbourne Institute’s Inflation Gauge is an attempt to replicate the ABS consumer price index (CPI) on a monthly basis instead of quarterly. It has turned out to be a reliable leading indicator of the CPI, although there are periods in which the Inflation Gauge and the CPI have diverged for periods as long as twelve months. On average, the Inflation Gauge’s annual rate tends to overestimate changes in CPI inflation by an average of about 0.10% in any given quarter.
The Inflation Gauge increased by 0.10% during October after a 0.30% increase in September and a 0.10% increase in August. On an annual basis, the index increased by 1.9%, the first time since December 2016 the index’s annual rate has fallen below 2.0%.
Bond yields finished the day higher. Yields on 3-year ACGBs were 3bps higher at 2.15%, 10-year yields had increased by 4bps to 2.75% and 20-year ACGBs gained 6bps to 3.11%. The Aussie dollar was broadly unchanged at 71.90 US cents.
05 November 2018
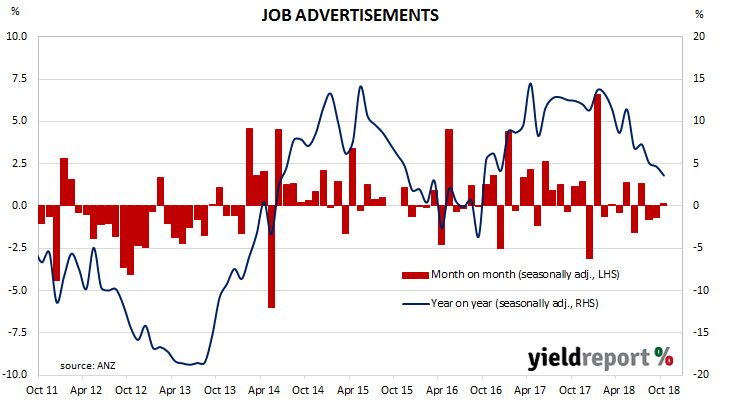
ANZ’s job advertisement survey is well-known as a leading indicator of employment numbers in Australia. As such, it is inversely related to the unemployment rate. ANZ’s survey reflects changes in demand for labour and it provides another measure of activity in the economy. There is also a fairly good inverse relationship between changes in Australia’s unemployment rates and changes in the RBA cash rate. Understanding the path of Australia’s unemployment rate has historically provided a reliable indicator of RBA rate changes.
From mid-2017 onwards, year-on-year growth rates in the survey’s total number of advertisements exceeded 10%. That was until recently; figures from August and September indicated a reduction in the number of employment advertisement and the annual growth rate fell back markedly.
October’s figures have now been released and, after revisions and seasonal adjustments, total advertisements increased by 0.2% to 175,905. On a 12 month basis, total job advertisements grew by 3.6%, a fall from September’s comparable growth rate of 4.7%.
 Bond yields finished the day higher. Yields on 3-year ACGBs were 3bps higher at 2.15%, 10-year yields had increased by 4bps to 2.75% and 20-year ACGBs had gained 6bps to 3.11%. The Aussie dollar was broadly unchanged at 71.90 US cents despite a move above 72.00 US cents shortly after the report’s release.
02 November 2018
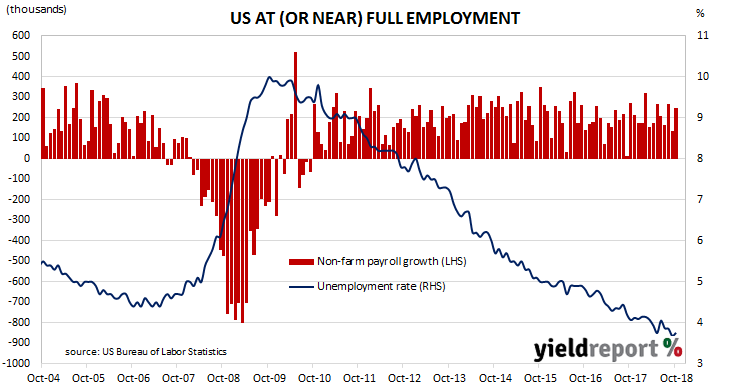
The US economy continued to produce more jobs in October and the US unemployment rate has not been this low since the 1960s. More importantly, there are some signs of accelerating wage growth, something which is likely to have implications for US monetary policy.
According to the US Bureau of Labor Statistics, the US economy created 250,000 jobs in the non-farm sector in October. Economists had been expecting around 190,000 additional positions and US financial markets reacted by sending bond yields and the US dollar noticeably higher. At the close of business, yields on US 2-year bonds, 10-year bonds and 30-year bonds were all 8bps higher at 2.92%, 3.21% and 3.46% respectively.
31 October 2018
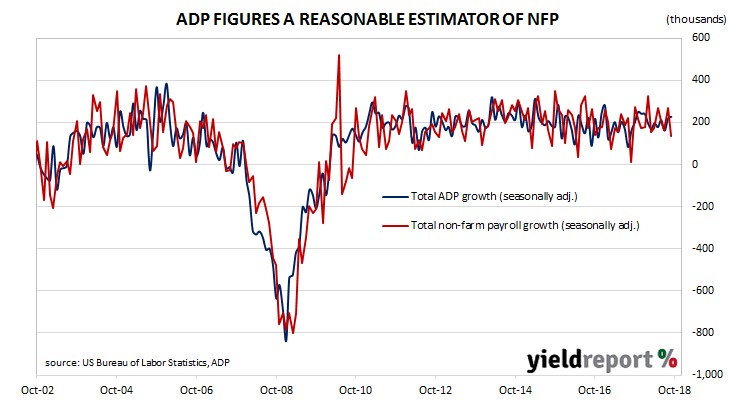
The ADP National Employment Report is published monthly by the ADP Research Institute. The report provides an estimate of US non-farm private employment based on actual payroll data. Since the report began to be published in 2006, its total private sector non-farm employment figures have exhibited a high correlation with BLS NFP employment figures.
The October figures have now been released. Private sector employment grew by 227,000, a figure which was higher than the expected figure of 190,000. Of these new jobs, 17% were in the manufacturing sector, with most of the increase evenly shared between mid-sized businesses with 50-499 employees and large businesses with 500 or more employees.
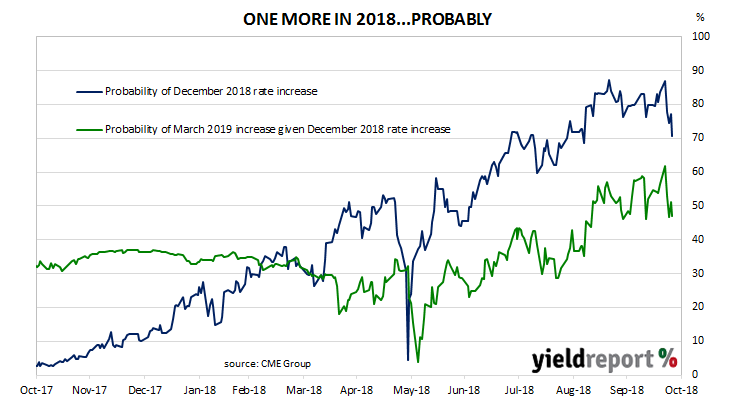
Market reaction to the figures was subdued but generally positive. US 2-year Treasury bond yields finished the day 3bps higher at 2.88%, while 10-year and 30-year bond yields each finished 2bps higher at 3.14% and 3.38% respectively. According to CME Group, the probability of a 25bps rate rise before the end of 2018 was unchanged at around 74% after the report’s release. However, cash futures prices implied an increase in the chance of an additional 25bps increase at the FOMC’s March meeting to back over 50%.
31 October 2018
The pace of lending to the non-bank private sector by financial institutions in Australia has been trending down since it peaked in October 2015. It stabilised in July and picked up a little in August but some economists expect the downward trend to continue as lending institutions tighten their standards and potential borrowers respond to perceptions of less attractive asset markets.
According to the latest RBA figures, private sector credit grew by 0.4% in September, down from the 0.5% growth rate in August but in line with the 0.4% consensus estimate. The year-to-September growth rate crept up for a second consecutive month from 4.5% to 4.6% on the back of increased lending to the business sector.
Westpac senior economist Andrew Hanlon said a month ago he did not expect the rebound to continue. He is still of that view. “Credit growth has been slowing as the housing sector cools in response to tighter lending conditions. However, in the September quarter, a burst of strength in the business segment provided some temporary respite.”
Historically, “owner-occupier” loans and, to a lesser extent, business loans have been the largest influences on total credit growth as they account for nearly 75% of outstanding loans.
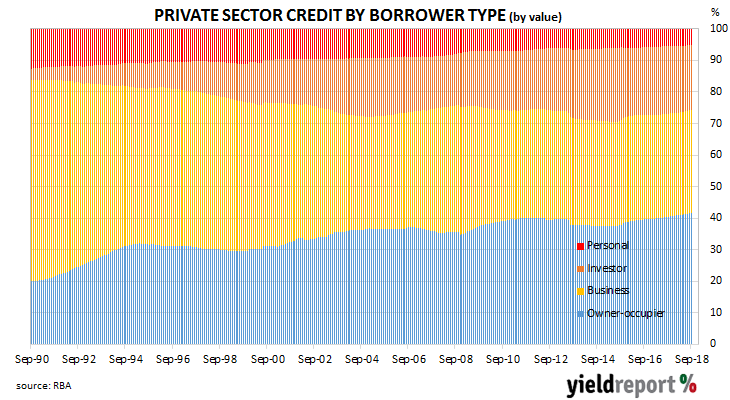
The “owner-occupier” segment has been responsible in the past for the bulk of lending in dollar terms, but in September, the business segment took the lead, despite a fall in its monthly growth rate. According to Westpac’s Andrew Hanlon, if it were not for funding alternatives, lending to the business sector may well have grown by more. “Currently, business credit growth is undershooting growth in non-mining business investment, the reverse of the experience in recent years, suggesting a greater reliance by businesses on other sources of funding, including retained earnings.” Business credit growth fell back from a growth rate of +0.8% in August to +0.6% in September but its annual growth rate accelerated from 3.8% to 4.4%.
30 October 2018
Aside from engineering and architectural design, one of the earliest requirements of a building project is to obtain approval from the relevant statutory body. As a result, building approvals data is a leading economic indicator of future construction. While not all projects which have been approved are completed, all completed projects have been granted approval. Approvals data thus provides a useful indicator of future construction activity.
The latest building approval figures have been released by the Australian Bureau of Statistics and figures for September indicated a small bounce occurred after falls in July and August. Seasonally-adjusted, total approvals increased by 3.3% in September, a little under the 3.8% increase expected and a significant turnaround from August’s revised figure of -8.1%. However, on an annual basis, total approvals fell by 14.1%, which is lower than August’s comparable figure of -12.6% after revisions.
Chris Read, Morgan Stanley Australia’s equity strategist, said the underlying components of the figures was a cause for concern. “The mix is also concerning; strength in the month was driven by a 10.7% increase in apartment approvals, only partially reversing August’s sharp decline. However detached house approvals, which are typically more stable, fell for the third straight month, only the second time this has happened since 2011.”

29 October 2018
One of the US Fed’s favoured measures of inflation is the change in the core personal consumption expenditures (PCE) price index. The core version strips out energy and food components, which are volatile from month to month, in an attempt to identify the prevailing trend. It’s not the only measure of inflation used; the Fed also tracks the Consumer Price Index (CPI) and Producer Price Index (PPI) from the Department of Labor.
The latest figures have been published by the Bureau of Economic Analysis as part of the September personal income and expenditures report. At +0.2% for the month, core PCE inflation was up from August’s flat result and greater than the +0.1% consensus expectation.

29 October 2018
The focus of many investors was on the share market gyrations which were taking place in US, Europe and Asia and, as ANZ put it, not on the upcoming GDP data. The US Commerce Department has now released third quarter (Q3) 2018 “advance” GDP estimates on Friday night Australian time and they indicate the US economy grew at an annualised growth rate of 3.5%. This estimate is the first of four estimates and subject to three more revisions over the next two months.
The growth figure was above the 3.3% median of market estimates but below the revised second quarter figure of 4.2%. ANZ senior economist Cherelle Murphy was sceptical of the sustainability of the growth rate past the short-term. “Overall, the numbers indicate the economy continues to be supported by the sugar hit from the tax cuts and fiscal stimulus, but the effects from this may be short-lived, given the easing in investment.”
Reactions in various financial markets was clouded by a preference for low risk assets as equity markets were sold off. 2-year and 10-year bond yields each fell 5bps to 2.80% and 3.07% respectively while 30 year bond yields lost 3bps to 3.31%. The USD was a little weaker against the euro and sterling but 0.55 lower against the yen. In cash futures markets, the likelihood of a fourth rise of the federal funds rate for the year dropped back from 77% to 70%, the minimum-required level historically consistent with action from the US central bank.