25 October 2018
The US Federal Reserve began raising its official interest rate, known as the federal funds rate, in December 2015. Eighteen months later in July 2017, the Bank of Canada (BoC) also began to raise its official rate and it has done so three times since then. Now, it has raised its official rate again from 1.50% to 1.75%.
Statements from the BoC suggest more increases are to come in the short term. Recent references in the statement which accompany each decision to a “gradual approach” to tightening have disappeared and been replaced by the phrase “the policy interest rate will need to rise to a neutral stance to achieve the inflation target.”
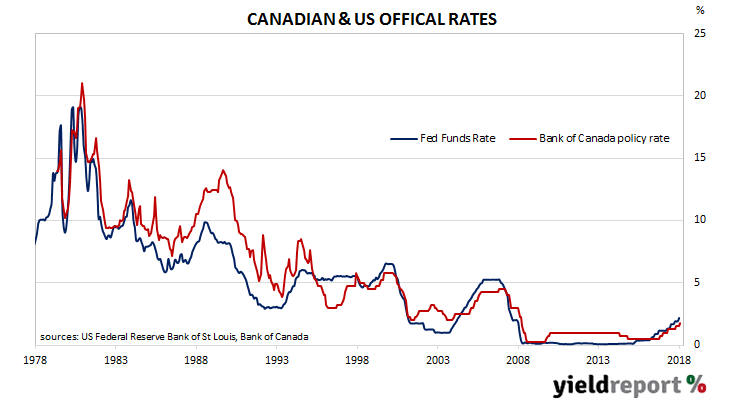
The Canadian official rate is often referred to as the Bank’s policy interest rate. It is the BoC’s target rate for overnight borrowing and lending between banks in the Canadian interbank market. As such, this rate operates in very much the same vein as the US federal funds rate or the RBA’s overnight cash rate.
17 October 2018
Westpac and the Melbourne Institute describe their Leading Index as a composite measure which attempts to estimate the likely pace of economic activity relative to trend in Australia. The index combines certain economic variables which are thought to lead changes in economic growth into a single variable. This variable is claimed to be a reliable cyclical indicator for the Australian economy and an indicator of swings in Australia’s overall economic activity.
The six-month annualised growth rate of the indicator partially rebounded and increased from -0.02% in August to 0.20% in September. These figures represent growth rates relative to trend-GDP growth, which is generally thought to be around 2.75% per annum for Australia. The Index is said to lead GDP by 3 months to 6 months, so theoretically the current reading represents an annualised GDP growth rate of just under 3.00% in the December or March quarters.
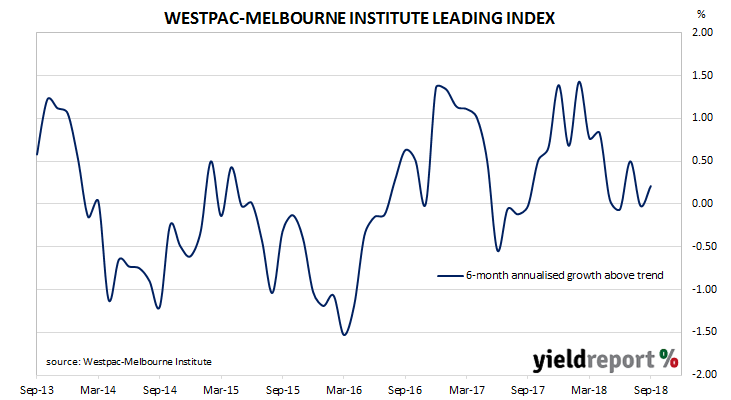
The largest positive effects over the previous six months have come from higher Australian equity prices and a steeper yield curve. The largest negative influence was in the form of lower dwelling approval figures.
17 October 2018
Apparently, some members of the FOMC may be advocating for a more hawkish approach to US monetary policy. The FOMC, or Federal Open Markets Committee, is a committee of the US Federal Reserve and its members vote on the stance of US monetary policy.
The Fed made its first rate increase of this cycle in December 2015. It then paused for one full year before it raised the rate another three times from late in 2016 to mid-2017. The federal funds target rate was then increased by 25bps on another four occasions in December 2017, March 2018, June 2018 and September 2018.
At the moment, the US Fed appears to be on a schedule to deliver 25bps interest rate increases every three months. The FOMC has been at pains to state repeatedly over time how US monetary policy would be normalised “at a gradual pace” and so a rate rise every three months would seem to qualify as “gradual” as per the Fed’s definition.
16 October 2018
The “quits” rate time series produced by the Job Openings and Labor Turnover Survey (JOLTS) is a leading indicator of US hourly pay. As wages account for around 55% of a product’s or service’s price, wage inflation and overall inflation rates tend to be closely related. Former Federal Reserve chief Janet Yellen was known to pay close attention to the quit rate but whether new Fed chief Jerome Powell regards the indicator with as much interest is as yet unknown.
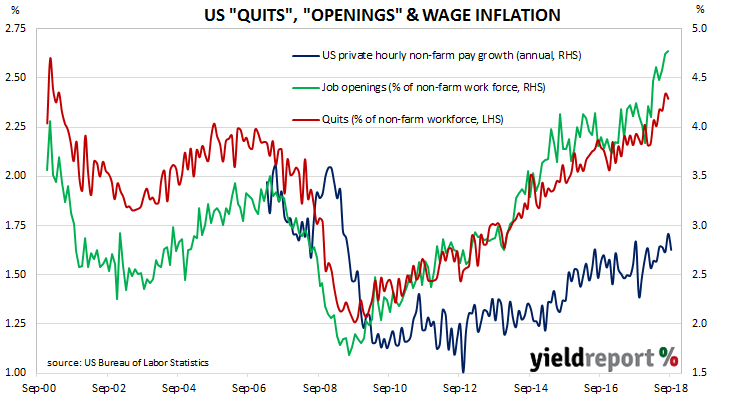
Figures released as part of the most recent JOLTS report show the quit rate remained unchanged after revisions at 2.4% of the non-farm workforce at the end of August. Quit rates were highest in the “wholesale trade” and “healthcare/social assistance” sectors while the “professional/business services” and “constructions” sectors each recorded the largest falls.
15 October 2018
Retail sales account for a large part of consumer spending, which itself is typically the largest segment of GDP in an advanced economy. Changes in retail sales have a large effect on GDP growth rates and thus they are of great interest to economists, policy makers and financial markets.
US retail sales had been robust from September 2017 onwards when annual growth rates started exceeding 5%. There has been the odd exception, such as in January 2018, when the annual growth rate dipped. However, August sales were barely larger than July’s total and now September sales figures have offered a similar lacklustre performance.
According to the latest “advance” sales numbers released by the US Census Bureau, total retail sales grew by just 0.1% over the month, which is less than the +0.7% expected and the same as August’s 0.1% increase. On an annual basis, sales increased by 4.7%, which is a significant fall from August’s comparable figure of 6.5% after revisions.
 Westpac’s Finance AM team described the result as “a big miss” but then went on to sound a lot more positive. “The retail control group, a subset that excludes food services, gasoline, auto and building materials and feeds directly in GDP, rose by a firmer looking +0.5%, in line with expectations net of small downward revisions to the prior month.”
15 October 2018
A report just released by S&P Global Ratings has warned of a rise in defaults by entities used by Chinese local governments to issue bonds.
These entities, known as local government financing vehicles (LGFVs), have been used by Chinese local governments to keep debt off their balance sheets while financing the building of infrastructure or the implementation of social projects.
S&P estimates between RMB30 trillion-RMB40 trillion (USD$4.5 trillion to USD$6 trillion) in local government debt may have been issued in this way. When this LGFV debt is added to official debt, S&P estimates total government debt to GDP may be around 60%, a figure which S&P referred to in the report as “alarming”.
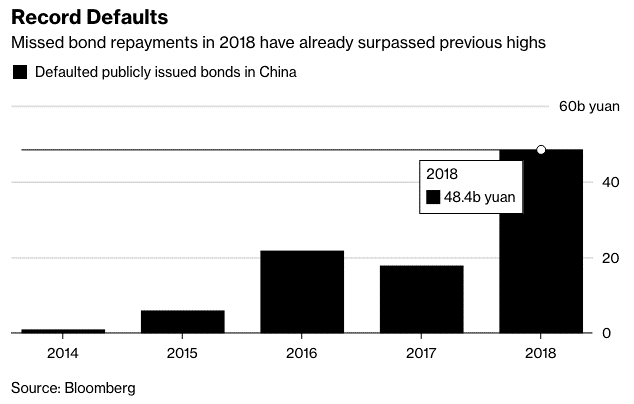
According to the Chinese State Council, all LGFV borrowings since 2015 are classified as corporate debt. S&P expects government support to be withdrawn over time in order to facilitate a transition to “more typical state-owned enterprises”. As such, it does not expect the central government or provincial governments to shore up LGFV deficiencies. “We believe the central government and the market have more tolerance for defaults by LGFVs and more will be on horizon.”
12 October 2018
The University of Michigan’s Index of Consumer Sentiment is one of two monthly US consumer sentiment indices, the other being the Conference Board’s Consumer Confidence Survey. It covers personal finances, business conditions and buying conditions. As private consumption accounts for a majority of GDP growth in advanced economies, consumer sentiment surveys present a picture of the economy well in advance of official reports. However, as leading indicators, they are only as useful as other widely available data.
The latest survey conducted by the University was carried out before the recent equity market turmoil. It indicates US consumers view their overall prospects favourably despite a modest fall in the index which was driven by a change in the general outlook for personal finances. The result was a small fall in the index from 100.1 in September to 99.0 in October, although it is still well above the long-term average (see chart below).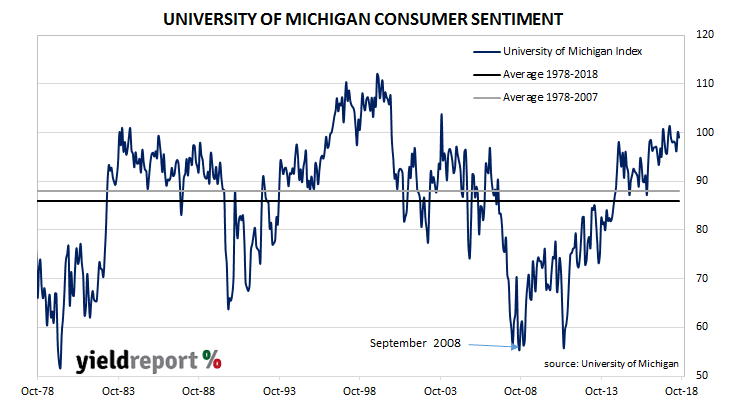
The chief economist of the Survey of Consumers unit, Richard Curtin, said the small decline came about because households are less positive regarding future income growth while they also expect inflation rates to rise. However, he also noted confidence in the overall economy is strong. “Indeed, confidence in the government’s economic policies rose in October to its highest level in the past fifteen years, reflecting the strong performance of the national economy.”
12 October 2018
The Australian Bureau of Statistics (ABS) collects data on housing finance commitments made by significant lenders and their figures include secured (mortgage) finance commitments for the construction or purchase of owner-occupied dwellings and investment properties. It has some overlap with the RBA’s monthly private sector credit statistics which also includes investor lending and owner-occupier lending.
The ABS has released housing finance figures for August and they were less than expected. Total approvals fell by 2.1%, which is less than the expected 1.0% fall and lower than July’s flat result after revisions. On an annual basis, the growth rate went even further into reverse, from a revised figure of -6.4% in July to -10.2% in August. When refinancing approvals are removed, approvals fell by 2.9% over the month and by 10.2% over the past 12 months.
 In dollar terms, total loan approvals excluding refinancing fell by 2.7% for the month, a larger fall than in July when approvals fell by 0.9% after revisions. On a year-on-year basis, total approvals excluding refinancing fell by 13.6%, a further deterioration from July’s revised 8.1% fall.
12 October 2018
The producer price index (PPI) is a measure of prices charged by producers for domestically produced goods, services, and construction. In the US it is constructed by the Bureau of Labor Statistics in a fashion similar to the consumer price index (CPI) except it measures prices received from the producer’s perspective. It is another one of the various measures of inflation tracked by the US Fed, along with core personal consumption expenditure (PCE) data.
The latest figures for September have been published by the Bureau and they indicate producer prices increased by 0.2% during the month after seasonal adjustments. The result was in line with expectations and a marked turnaround from August’s 0.1% decline. On a 12-month basis, the rate of producer price inflation after seasonal adjustments slipped back to 2.7% after recording 2.8% in August and 3.2% in July.
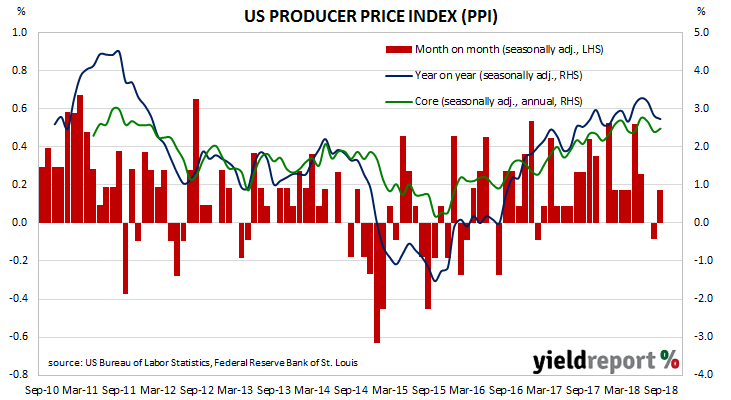
“Core” PPI inflation, increased on a seasonally-adjusted basis by +0.2% for the month. On an annual basis, the rate increased from 2.4% after revisions in August to 2.5% in September.
10 October 2018
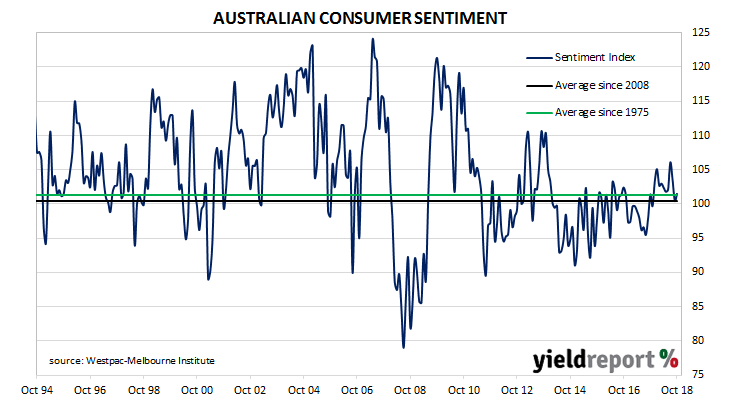
During most of the period between 2014 and 2018 there has been a divergence between consumer sentiment and business confidence in Australia. July’s consumer survey was thought to have marked the beginning of a convergence of the two sectors and August’s figures appeared to have provided confirmation. However, September’s survey indicated consumer sentiment had deteriorated while business sentiment had recovered slightly.
According to the latest Westpac-Melbourne Institute survey conducted early in October, households’ levels of optimism increased marginally as the Consumer Sentiment Index inched up from September’s reading of 100.5 to 101.5. Any reading above 100 indicates the number of consumers who are optimistic is greater than the number of consumers who are pessimistic. The long-term average reading is just over 101.