09 October 2018
Australian business conditions were robust in the first half of 2018, especially so in April when one index registered an all-time high. Readings then slipped back over the next couple of months but they still remained at above-average levels. While some other surveys recently suggested some weakening of demand in the business sector, NAB’s survey is still indicative of buoyant business conditions.
According to NAB’s latest monthly business survey of 400 firms conducted in the last week of September, business conditions remained at a very-healthy level. After revisions, the index crept up from a revised value of 14 at the end of August to 15 in September. NAB chief economist Alan Oster said, “Business conditions seem to have stabilised at high levels in recent months following some sharp falls earlier and the dip in confidence last month appears to have been temporary”.
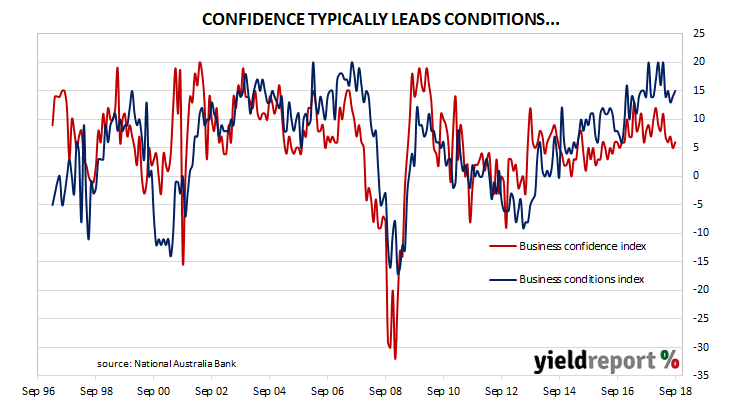 Typically, NAB’s confidence index leads the conditions index by approximately one month, although in recent months the two surveys have diverged and the condition index has led the confidence index higher in trend terms since late 2014. After revisions, the confidence index inched up by 1 point to register 6 on the index in September, which is around the long-term average reading but still a little below most 2018 readings.
08 October 2018
ANZ’s job advertisement survey is well-known as a leading indicator of employment numbers in Australia. It reflects changes in demand for labour and it provides another measure of activity in the economy. There is also a fairly good inverse relationship between changes in Australia’s unemployment rates and changes in the RBA cash rate. Understanding the path of Australia’s unemployment rate has historically provided a reliable indicator of RBA rate changes.
September’s figures have been released and, after revisions and seasonal adjustments, total advertisements fell by 0.8% to 175,555. August’s figure was also revised down and it was adjusted from 177,241 to 176,990. On a 12 month basis, total job advertisements grew by 4.7%, a fall from August’s comparable growth rate of 5.1% and well-down on the double-digit growth rates recorded in the first quarter of 2018.
 Bond yields finished the day higher but they may have just been following offshore leads from higher US and German yields on Friday night. Yields on 3-year ACGBs were 4bps higher at 2.13% while 10-year and 20-year ACGBs had each increased by 5bps to 2.79% and 3.11% respectively. The Aussie dollar was broadly unchanged.
05 October 2018
The US economy continued to produce more jobs in September and the US unemployment rate has not been this low since the 1960s. However, there is still little sign of any pressure pushing wage growth above 3%.
According to the US Bureau of Labor Statistics, the US economy created 134,000 jobs in the non-farm sector in September. However, the latest figures also include upward revisions to previous employment numbers and figures for July and August were revised up by a total of 105,000 positions.
ANZ head of Australian Economics David Plank, viewed the figures as broadly in line with expectations but noted the lack of growth in one particular area. “Although headline US non-farm payrolls undershot expectations, upward revisions to the previous two months left the figures around expectations in aggregate. Average hourly earnings were as expected at 2.8%…despite the booming economy, wages are still struggling to accelerate.”
 September ADP figures, which had come out a few days prior to this report, suggested September would be a strong month for employment growth. However, weather conditions during the month was expected to play some role. As the Finance AM team at Westpac put it, “Hurricane Florence held back payrolls with an elevated number of workers reporting they were unable to work due to bad weather.”
Economists were expecting around 188,000 additional positions but the revisions to previous months’ figures seemed to be enough to counteract any disappointment. US financial markets reacted by sending bond yields higher while the US dollar was weaker against other major currencies. At the close of business, US 2-year bond yields were 2bps higher at 2.88%, 10-year yields had increased by 4bps to 3.23% and the yield on 30-year Treasury bonds had gained 5bps to 3.40%.
03 October 2018
The ADP National Employment Report is published monthly by the ADP Research Institute. The report provides an estimate of US non-farm private employment based on actual payroll data. Since the report began to be published in 2006, its total private sector non-farm employment figures have exhibited a high correlation with BLS NFP employment figures.
It is for this very reason bond yields ran hard after the August figures were released. At 230,000, the number was considerably more than the expected figure of 185,000. US 2-year Treasury bond yields finished the day 7bps higher at 2.87%, while 10-year and 30-year bond yields each finished 12bps higher at 3.18% and 3.34% respectively.

The September non-farm payroll estimate was at 188,000 prior to the ADP report but one would now expect that figure to rise. The report will be released by the Bureau of Labor Statistics on Friday night (AEST).
03 October 2018
Aside from engineering and architectural design, one of the earliest requirements of a building project is to obtain approval from the relevant statutory body. As a result, building approvals data is a leading economic indicator of future construction. While not all projects which have been approved are completed, all completed projects have been granted approval. Approvals data thus provides a useful indicator of future construction activity.
The latest building approval figures have been released by the Australian Bureau of Statistics and figures for August extended July’s falls. Seasonally-adjusted, total approvals fell by 9.4% in August, which is well off the 1% increase expected and a larger fall than July’s revised figure of -4.6%. On an annual basis, total approvals fell by 13.6%, which is also down from July’s comparable figure of -5.4% after revisions and less than the expected -3.7% contraction.
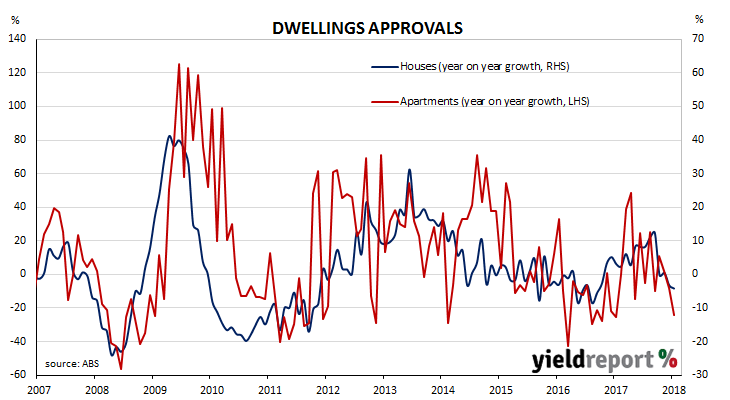
ANZ senior economist Felicity Emmett said tighter lending conditions were the likely culprit behind the lower figures. “Once again the weakness was concentrated in apartment approvals, which fell a sharp 18%, likely reflecting the more difficult financing conditions the sector is facing.” She also said not to expect any change soon. “Tighter credit conditions are the main reason we expect dwelling approvals to continue to trend lower in the near term, consistent with the near-term signal from the housing finance data.”
01 October 2018
The Melbourne Institute’s Inflation Gauge is an attempt to replicate the ABS consumer price index (CPI) on a monthly basis instead of quarterly. It has turned out to be a reliable leading indicator of the CPI, although there are periods in which the Inflation Gauge and the CPI have diverged for periods of as long as twelve months. On average, the Inflation Gauge’s annual rate tends to overestimate changes in CPI inflation by an average of about 0.10% in any given quarter.
The Inflation Gauge increased by 0.3% during September after 0.10% increases in each of July and August. On an annual basis, the index increased by 2.1%, the same rate as in July but a step up from July’s 2.0%.
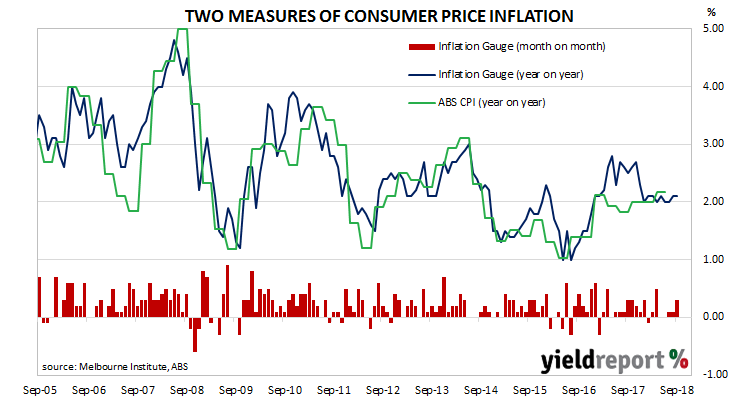
Given the Inflation Gauge’s tendency to overestimate, the latest figures imply an official CPI reading of 0.4% (seasonally adjusted) for the September quarter. In annual terms, this implies a CPI figure of around 2.0%, or 0.2% less than June’s comparable figure.
Bond yields finished the day a little lower while the local currency went in the opposite direction. The yield on 3-year ACGBs lost 2bps to 2.09% while 10-year ACGBs remained unchanged at 2.69% and 20-year ACGB yields slipped by 1bp to 3.00%. The Aussie dollar finished the day a little higher at 72.25 US cents.
01 October 2018
Purchasing Managers’ Indices (PMIs) are economic indicators derived from monthly surveys of purchasing and supply executives in private sector companies. They are diffusion indices, which means a reading of 50% represents no change from the previous period, while a reading under 50% implies respondents on average reported a deterioration. Their usefulness lay in being a leading indicator of GDP.
US manufacturing activity rebounded more than expected in August and the latest figure is very much at elevated levels. According to the Institute of Supply Management (ISM) September survey, its Purchasing Managers Index recorded a reading of 59.8, down from August’s reading of 61.3 and just under the expected figure of 60.1.

As NAB senior economist David de Garis put it, “Notwithstanding the tariffs and Hurricane Florence, the index remained high.” Over at ANZ, Daniel Been, who is ANZ’s Head of FX Strategy, agreed. “Overall, the ISM suggests economic activity is continuing to run hot, consistent with the FOMC’s interest rate profile.” Just last week, the US central bank’s Federal Open Markets Committee (FOMC) voted unanimously to raise the US official interest rate by 25bps in light of a strengthening labour market and robust business and household sectors.
US bond yields finished the day higher. 2-year, 10-year and 30-year bond yields all closed 2bps higher at 2.82%, 3.08% and 3.23% respectively. The US dollar was stronger against the euro and yen but a tad weaker against sterling.
28 September 2018
The pace of lending to the non-bank private sector by financial institutions in Australia stabilised in July and it has now picked up a little in August. However, some economists expect the downward trend to continue as lending institutions tighten their standards and potential borrowers respond to perceptions of lower returns in asset markets.
According to the latest RBA figures, private sector credit grew by 0.5% in August, up from the 0.4% growth rate in July and above the 0.4% consensus estimate. The year-to-August growth rate inched up from 4.4% to 4.5% on the back of home loans to owner-occupiers and, to a lesser extent, loans to the business sector. Westpac senior economist Andre Hanlon does not expect the rebound to continue. “This is likely to be only a temporary reprieve from the underlying slowdown.”
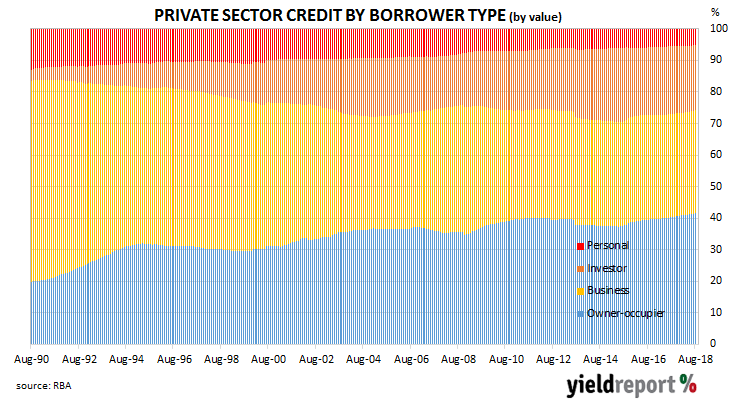 Historically, the “owner-occupier” and business loans segments have been the largest influences on total credit growth as they account for nearly 75% of outstanding loans.
28 September 2018
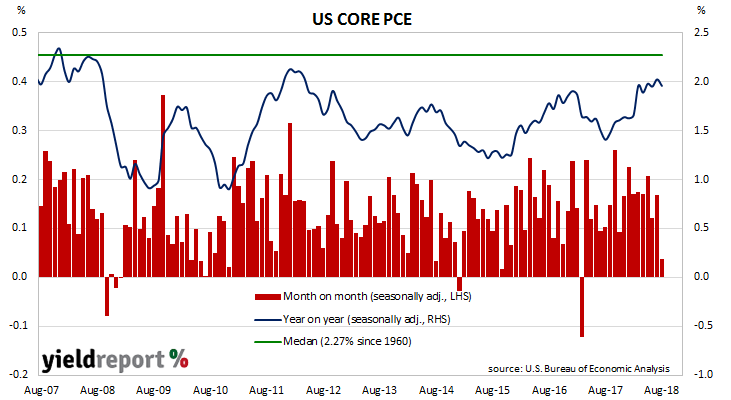
One of the US Fed’s favoured measures of inflation is the change in the core personal consumption expenditures (PCE) price index. The core version strips out energy and food components, which are volatile from month to month, in an attempt to identify the prevailing trend. It’s not the only measure of inflation used; the Fed also tracks the Consumer Price Index (CPI) and Producer Price Index (PPI) from the Department of Labor.
The latest figures have been published by the Bureau of Economic Analysis as part of the August personal income and expenditures report. At +0.0% for the month, core PCE inflation was down from July’s revised +0.2% but in line with expectations.
US financial markets let the figures pass without much comment and bond yields reacted in a somewhat inconsistent fashion. 2-year Treasury bond yields fell by 3bps to 2.80% but 10-year yields inched up 1bp to 3.06% and 30-year yields added 3bps to 3.21%. The US dollar was stronger against other major currencies.
25 September 2018
Consumer confidence surveys are important private sector surveys even though economists view them as lagging indicators. Their importance lies in the confirmation of spending patterns and as consumption in developed countries may amount to 60%-70% of GDP, knowing how it is behaving is important for financial markets’ forecasts for GDP growth rates, which in turn flow into demand for credit and inflation rates.
The Conference Board Consumer Confidence Index is one of two US consumer sentiment indices, the other being the University of Michigan’s Consumer Sentiment Index. The Conference Board’s index is based on perceptions of current business and employment conditions, as well as expectations of business conditions, employment and income six months into the future.

The latest release from the Conference Board’s September survey indicates US consumers are about as optimistic as they can possibly be. The reading came in at 138.4, up from August’s revised reading of 134.7 and well up on September 2017’s comparable figure of 120.6. It is the highest reading since October 2000 and it is not far from the highest reading recorded in the series.

