24 September 2018
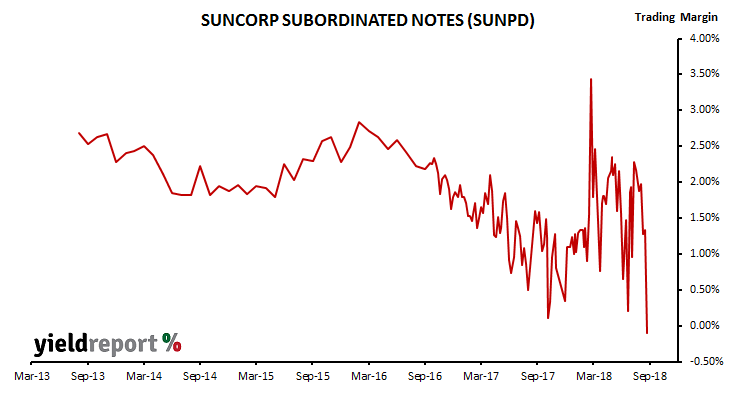
Suncorp Subordinated Notes (ASX code: SUNPD) were issued in May 2013. They pay a floating rate of interest equivalent to 3 month BBSW + 285bps, have a first call date of 22 November 2018 and their final maturity date is on 22 November 2023.
Suncorp has recently announced it will redeem all of these notes on the first (call) optional redemption date of 22 November 2018. Holders will receive the final interest payment of $1.2111 in addition to the $100.00 face value.
One common feature of notes, bonds and hybrid securities listed on the ASX is the increased volatility of their trading margins as the time to maturity approaches. Typically, trading margins decrease once a security passes a certain minimum time to maturity. Then, as its sensitivity to price changes increases in its final year, it moves to the point where a small price change will lead to a large change in yield, thus potentially producing wild swings.
19 September 2018
The Bank of England took a second step in normalising UK interest rates when it raised its Bank Rate from 0.50% to 0.75% in early August. It started the process in November 2017 as the UK’s unemployment rate moved further below 5% and core inflation moved above 2.5%. The UK’s latest inflation figures suggest the BoE is likely to continue on its current path despite some reservations arising from the approach of the March 2019 Brexit date.
The annual rate of UK consumer inflation jumped in August, the result of higher transport and housing costs. Consumer price index (CPIH) figures released by the Office of National Statistics (ONS) indicated seasonally-adjusted consumer prices increased by 0.6% over the month, which is more than the 0.5% increase which markets expected and quite a jump from the flat results in June and July. On a 12-month basis and after seasonal adjustments, the consumer inflation rate increased from July’s revised figure of 2.3% to 2.4%.
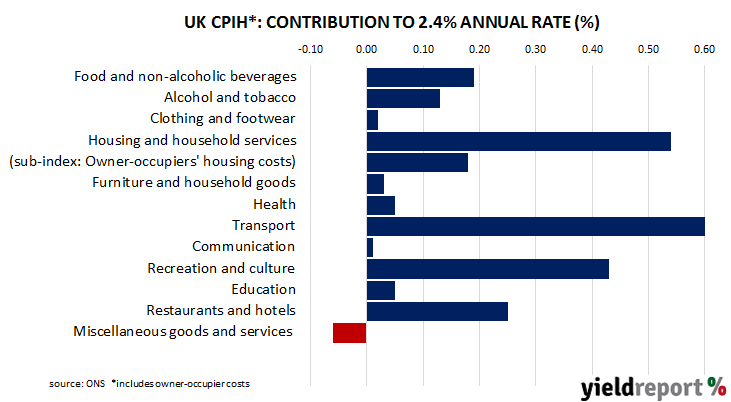
The figures were higher than expected and UK bond yields increased despite little movement in US and European markets. UK 5-year and 10-year bond yields each increased by 4bps to 1.19% and 1.46% respectively. However, sterling was essentially unmoved against other major currencies.
19 September 2018
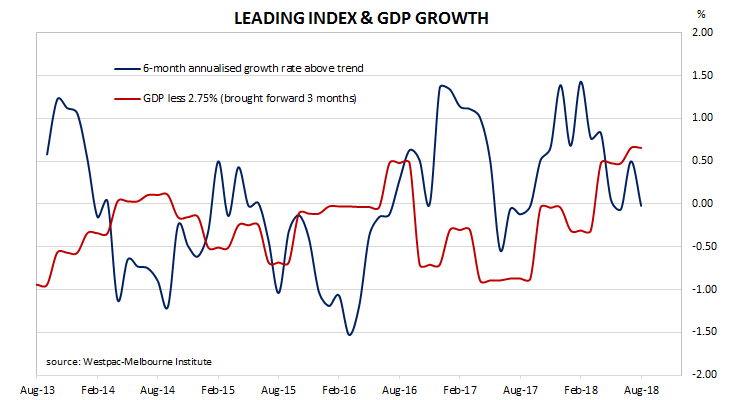
Westpac and the Melbourne Institute describe their Leading Index as a composite measure which attempts to estimate the likely pace of economic activity relative to trend in Australia. The index combines certain economic variables which are thought to lead changes in economic growth into a single variable. This variable is claimed to be a reliable cyclical indicator for the Australian economy and an indicator of swings in Australia’s overall economic activity.
The six-month annualised growth rate of the indicator gave back its July increase and fell to -0.02% in August from a revised +0.50 in July. These figures represent growth rates relative to trend-GDP growth, which is generally thought to be around 2.75% per annum for Australia. The Index is said to lead GDP by 3 months to 6 months, so theoretically the current reading represents an annualised GDP growth rate of around 2.75% in the September or December quarters.
18 September 2018
The RBA held the official cash rate steady at its board meeting on the first Tuesday in September, as it had for every meeting since the cash rate was reduced in August 2016.
The usual references were there. A future rate change is more likely to be an increase rather than a decrease. There is no strong case for a change in the near future. Gradual progress is being made towards a lower unemployment rate. Wages growth is expected to rise gradually. The next move in the cash rate is more likely to be an increase than a decrease. As the chief economist at Westpac put it, the minutes “for September show little significant change…”

Reactions from various financial markets was varied. Locally, bond yields ignored weak offshore leads and finished the day higher. 3-year and 10-year ACGB yields each gained 4bps to finish at 2.10% and 2.68% respectively. In cash futures markets, prices moved in a way which suggests traders dialled back the chance of a rate rise in any given month and contracts imply little chance of a rate rise before August 2019. The Aussie dollar finished the day up a little at 72.20 US cents.
14 September 2018
Retail sales account for a large part of consumer spending, which itself is typically the largest segment of GDP in an advanced economy. Changes in retail sales have a large effect on GDP growth rates and thus they are of great interest to economists, policy makers and financial markets.
Apart from a weak January, US retail sales had been robust from September 2017 onwards when annual growth rates started exceeding 5%. The annual growth rate has trended up since the beginning of 2018 but the latest August figures have presented a pause as car sales contracted.
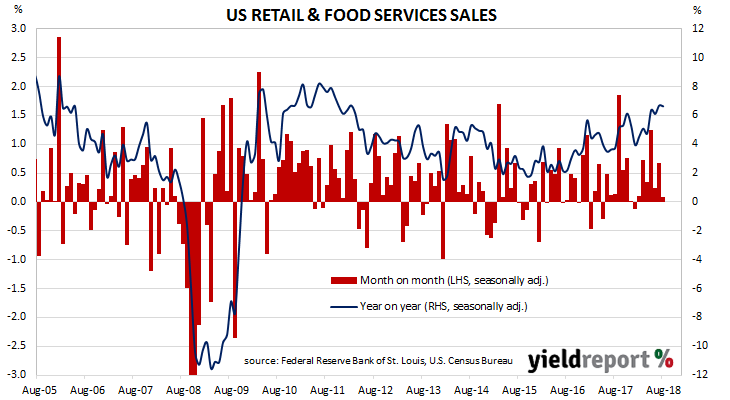 According to the latest “advance” sales numbers released by the US Census Bureau, total retail sales grew by just 0.1% over the month, which is less than the +0.6% expected and lower than July’s 0.7% increase after it was revised from 0.5%. On an annual basis, sales increased by 6.6%, which is slightly lower than July’s comparable figure of 6.7% after revisions.
14 September 2018
The University of Michigan’s Index of Consumer Sentiment is one of two monthly US consumer sentiment indices, the other being the Conference Board’s Consumer Confidence Survey. It covers personal finances, business conditions and buying conditions. As private consumption accounts for a majority of GDP growth in advanced economies, consumer sentiment surveys present a picture of the economy well in advance of official reports. However, as leading indicators, they are only as useful as other widely available data.
The latest survey conducted by the University indicates US consumers still think employment and pay prospects look favourable, with trade disputes a concern for an increasing number of respondents. The net result was a bounce in the index from 96.2 in August to 100.8 in September, which is well above the long-term average (see chart below).
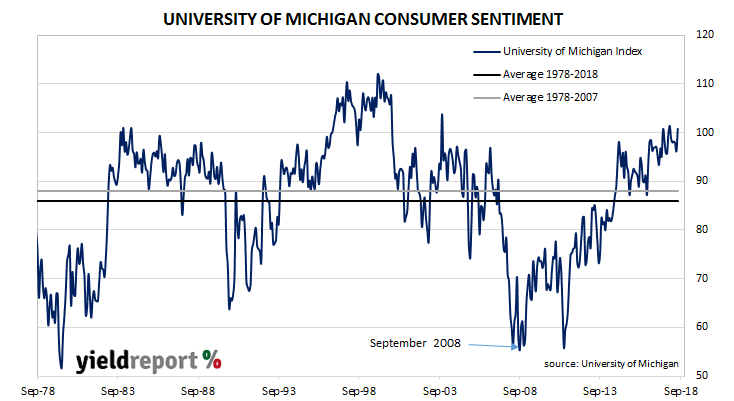
The chief economist of the Survey of Consumers unit, Richard Curtin, said households expect employment opportunities to be plentiful in the year ahead. However, almost as many people expect an economic downturn somewhere in the medium term as those which did not. “While consumers were somewhat more likely to anticipate that the economic expansion would continue uninterrupted over the next five years, nearly as many expect another downturn sometime in the next five years. The largest problem cited on the economic horizon involved the anticipated negative impact from tariffs.”
13 September 2018
The annual rate of US consumer inflation has fallen back in August after seven consecutive months of increases. Consumer price index (CPI) figures released by the Bureau of Labor Statistics indicated seasonally-adjusted consumer prices increased by +0.2%, less than the +0.3% expected by economists but the same as July’s +0.2%. However, on a 12-month basis, the consumer inflation rate slipped from July’s 2.9% back to 2.7%.
 “Core” inflation, a measure of inflation which strips out the volatile food and energy components of the index, increased on a seasonally-adjusted basis by +0.1% for the month, while the annual rate decreased from its post-GFC peak of 2.3% after revisions to 2.2% in August.
Reaction to the inflation figures was mixed up with responses to BoE and ECB policy meetings and the Turkish central bank’s 6.25% rate hike. 2-year Treasury yields increased by 2bps to 2.76% but 10-year yields slipped 1bp to 2.97% while 30-year yields crept up 1bps to 3.11%. The USD was weaker against the euro and sterling but stronger against the yen.
12 September 2018
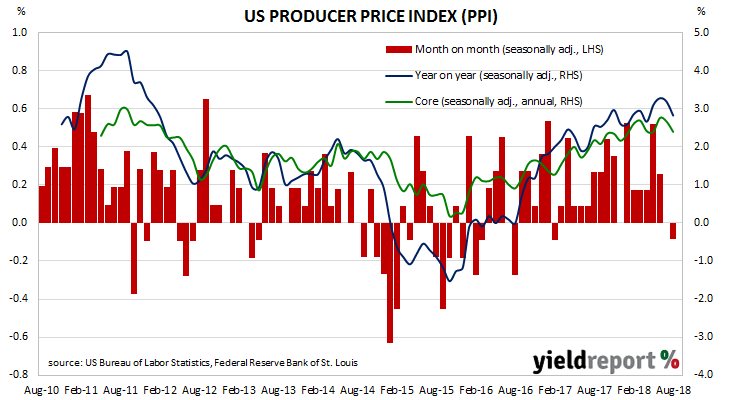
The producer price index (PPI) is a measure of prices charged by producers for domestically produced goods, services, and construction. In the US it is constructed by the Bureau of Labor Statistics in a fashion similar to the consumer price index (CPI) except it measures prices received from the producer’s perspective. It is another one of the various measures of inflation tracked by the US Fed, along with the CPI and core personal consumption expenditure (PCE).
The latest figures for August have been published by the Bureau and they indicate producer prices fell back by 0.1% across the month. The result was less than the expected +0.2% and lower than the July’s flat result. On a 12-month basis, the rate of producer price inflation dropped back to 2.8% after recording 3.2% in July and 3.3% in June.
Apart from the PPI figures, US financial markets were contending with the Trump administration’s suggestion of additional trade discussions with the Chinese government as well as the possible effects of Hurricane Florence on the US economy. US 2-year Treasury yields finished the day unchanged at 2.74% while 10-year and 30-year yields were each 2bps lower at 2.96% and 3.10% respectively. The US dollar was weaker against other major currencies.
12 September 2018
During most of the period between 2014 and 2018, there has been a divergence between consumer sentiment and business confidence in Australia. July’s consumer survey was thought to have marked the beginning of a convergence of the two sectors. It now appears the two sectors have converged but not in the manner expected. Both consumer and business sentiment indices have moved into line with each at just below their long-term respective averages.
According to the latest Westpac-Melbourne Institute survey conducted early in September, households’ levels of optimism slipped as the Consumer Sentiment Index fell back from August’s reading of 103.6 to 100.5. Any reading above 100 indicates the number of consumers who are optimistic is greater than the number of consumers who are pessimistic. The long-term average reading is just over 101.

Westpac’s chief economist Bill Evans said the combination of higher mortgage rates, political instability at the Federal level and household budget stresses were partially offset by favourable economic growth news and confidence. “It is also encouraging that respondents have boosted their confidence in the labour market with a significant improvement coming in the mining states.”
11 September 2018
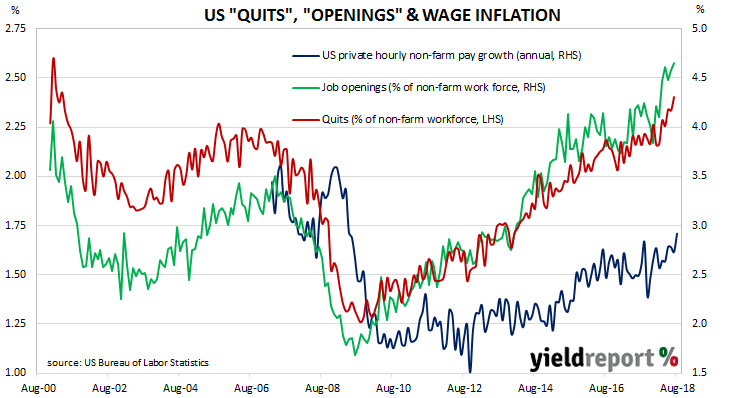
The “quits” rate time series produced by the Job Openings and Labor Turnover Survey (JOLTS) is a leading indicator of US hourly pay. As wages account for around 55% of a product’s or service’s price, wage inflation and overall inflation rates tend to be closely related. Former Federal Reserve chief Janet Yellen was known to pay close attention to the quit rate but whether new Fed chief Jerome Powell regards the indicator with as much interest is as yet unknown.
Figures released as part of the most recent JOLTS report show the quit rate edged up from 2.3% of the non-farm workforce at the end of June to 2.4% in July. Quit rates were highest in the “accommodation and food services” and “other services” sectors while the “retail trade” and “health care and social assistance” sectors each recorded falls.
Reactions by financial markets were indicative of higher future US interest rates. The yield on US 2-year Treasury bonds increased by 4bps to 2.74% while 10-year yields moved up 5bps to 2.98%. According to federal funds futures prices, the probability of a rate rise at the September FOMC meeting are close to a certainty at just under 100% while the likelihood of another increase in December moved from 77% to 79%. The US dollar was up against the yen but almost unchanged against sterling and the euro.

