06 August 2018
ANZ’s job advertisement survey is well-known as a leading indicator of employment numbers in Australia. It reflects changes in demand for labour and it provides another measure of activity in the economy. There is also a fairly good inverse relationship between changes in Australia’s unemployment rates and changes in the RBA cash rate. Understanding the path of Australia’s unemployment rate has historically provided a reliable indicator of RBA rate changes.
July’s figures have been released and, after revisions, total advertisements increased by 1.5% to 178,322 (seasonally adjusted) while June’s seasonally adjusted figures were revised up by an almost-insignificant amount to 175,762. On a 12 month basis, total job advertisements grew by 7.3%, an increase from June’s comparable growth rate of 6.9%.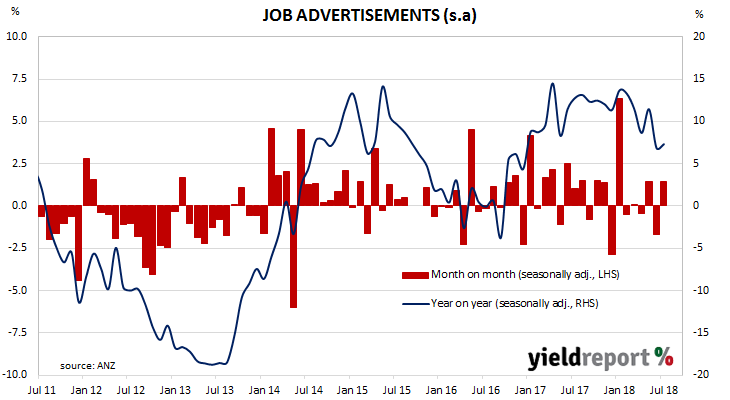 Bond yields finished the day lower but they have been following the lead from lower US yields on Friday night. Yields on 3-year ACGBs remained unchanged at 2.15% while 10-year ACGBs slipped 1bp lower to 2.73%. The Aussie was a little softer at 73.90 US cents.
06 August 2018
The Melbourne Institute’s Inflation Gauge is an attempt to replicate the ABS consumer price index (CPI) on a monthly basis instead of quarterly. It has turned out to be a reliable leading indicator of the CPI, although there are periods in which the Inflation Gauge and the CPI have diverged for periods of up to six-to-twelve months. On average, the Inflation Gauge’s annual rate tends to overestimate changes in the CPI inflation by an average of about 0.10% in any given quarter.
The Inflation Gauge increased by 0.1% during July after flat results in June and May. On an annual basis, the index is 2.0% higher, the same rate as in June but lower than the 2.1% rate which was recorded in May.
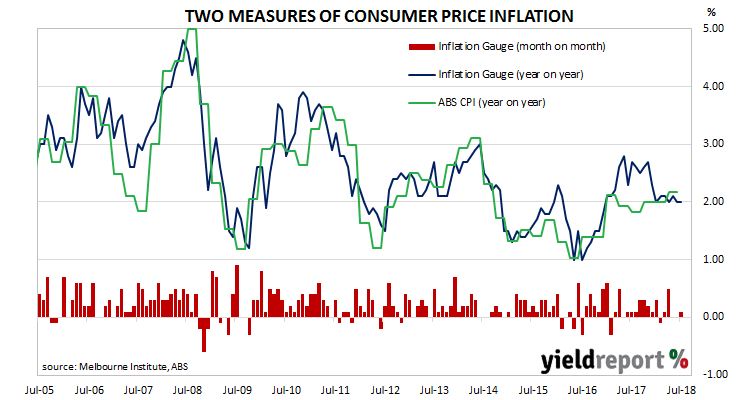
As a leading indicator, one would expect official CPI figures to follow the Melbourne Institute measure. However, “false starts” have occurred before, the most recent in the June and September quarters of 2017. In such cases the Inflation Gauge then fell back to converge with the official figure at the start of 2018.
31 July 2018
The pace of lending to the non-bank private sector by financial institutions in Australia has continued its three-year descent after reaching a post-GFC peak in October 2015. According to the latest RBA figures, private sector credit grew by 0.3% in June, up from the 0.2% growth rate in May and in line with the consensus estimate. However, the year-to-June growth rate fell from 4.8% to 4.5%, as personal loans stagnated and lending to property investors went backwards.
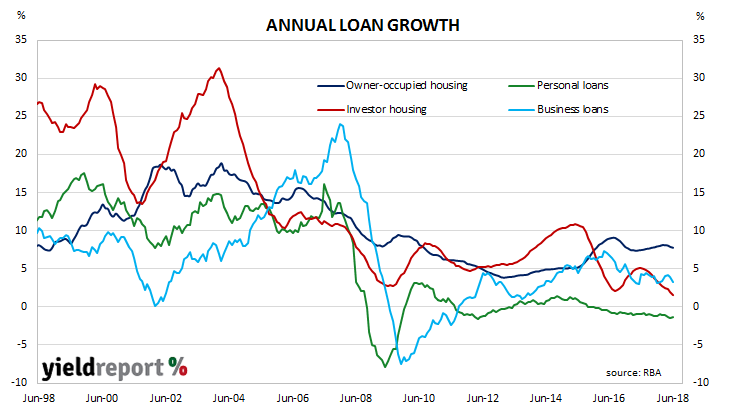
The overall increase was driven by “owner-occupier” and business loans. Historically, these two segments have been the largest influences on total credit growth, as they account for nearly 75% of outstanding loans. However, since mid-2016, business lending has been less and less influential.
Business credit growth rebounded from a growth rate of +0.0% in May to a +0.3% increase in June, while its annual growth rate slowed from a revised rate of 3.9% to 3.2%. The owner-occupier segment repeated the 0.6% growth rate present in March, April and May while the 12-month growth rate slipped back from 7.9% to 7.8%.
31 July 2018
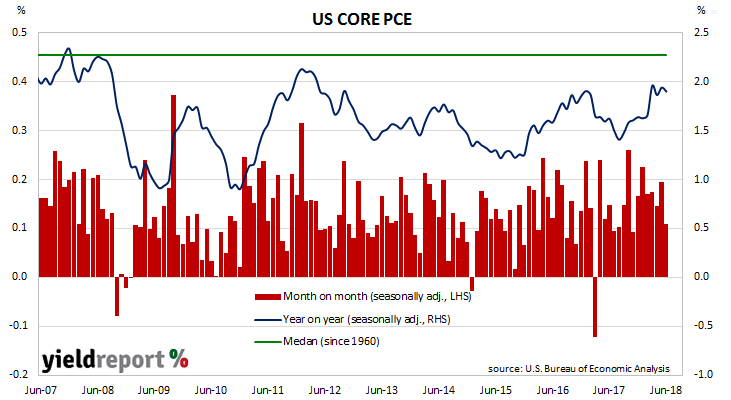
One of the US Fed’s favoured measures of inflation is the change in the core personal consumption expenditures (PCE) price index. The core version strips out energy and food components, which are volatile from month to month, in an attempt to identify the prevailing trend. It’s not the only measure of inflation used; the Fed also tracks the Consumer Price Index (CPI) and Producer Price Index (PPI) from the Department of Labor.
The latest figures have been published by the Bureau of Economic Analysis as part of the June personal income and expenditures report. At 0.1% for the month, core PCE inflation was lower than May’s figure and less than the +0.2% which was expected.
Reactions from financial markets were mixed. Bond yields at the front of the curve increased while yields at the long end fell and the USD was a touch stronger against sterling and the euro. 2 year bond yields increased by 2bps to 2.68% while 10 year yields slipped 1bp to 2.96% and 30 year bond yields fell by 3bps to 3.08%.
31 July 2018
Aside from engineering and architectural design, one of the earliest requirements of a building project is to obtain approval from the relevant statutory body. As a result, building approvals data is a leading economic indicator of future construction. While not all projects which have been approved are completed, all completed projects have been granted approval. Approvals data thus provides a useful indicator of future construction.
The latest building approval figures have been released by the Australian Bureau of Statistics and the month-to-month swings caused by volatile apartment numbers have continued. Total approvals increased by 6.4% in June after recording a revised growth rate of -2.5% in May, considerably higher than the median forecast of a 1% gain. On an annual basis, total approval grew by 1.6%, down from May’s comparable figure of 4.1% after revisions but more than the expected 3.5% contraction.
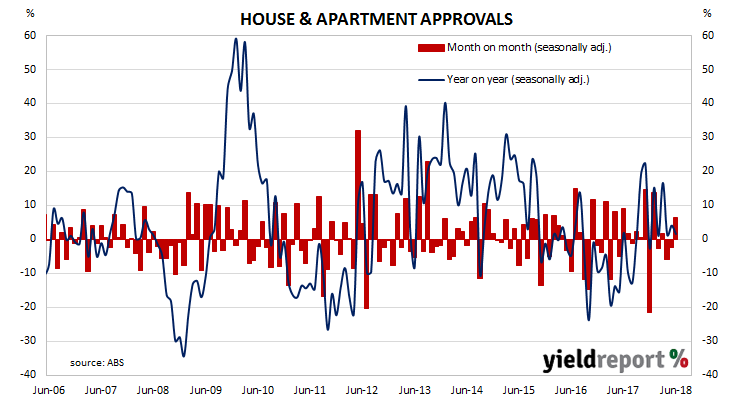
Despite higher yields in overnight markets, especially in Europe, local bond yields barely changed, either before the report’s release or afterwards. By the end of the day, the yield on 3 year bonds had increased by 1bp to 2.11% while 10 year bonds remained unchanged at 2.66%.
House approvals increased by +4.4% for the month, up from May’s 7.9% drop. On a 12-month basis, house approvals were just 0.9% higher. Apartment approvals are a lot more volatile (see chart below) but they increased for a second month in a row, this time by 8.9%. On a 12-month basis, apartment approvals were 2.4% higher.
27 July 2018
In a week less pre-occupied with trade disputes and geopolitics, the focus of the week for many bond market observers, investors and economists was the US June quarter GDP figures. The US Commerce Department has now released second quarter (Q2) 2018 “advance” GDP estimates on Friday night Australian time and they indicate the US economy grew at an annualised growth rate of 4.1%. This estimate is the first of four estimates and subject to three more revisions over the next two months.
The growth figure was below the 4.2% median of market estimates but well above than the revised first-quarter figure of 2.2%. NAB Head of FX Strategy, Ray Attrill, said while the figures were only just below expectations, some of the details of the report suggested some third quarter weakness was to be expected. “Consumers and exports led the gains during the quarter, but with soybeans leading the rise in exports and tax cuts behind the consumer, the sense of payback in Q3 (September quarter) took some of the gloss off the impressive numbers.”
19 July 2018
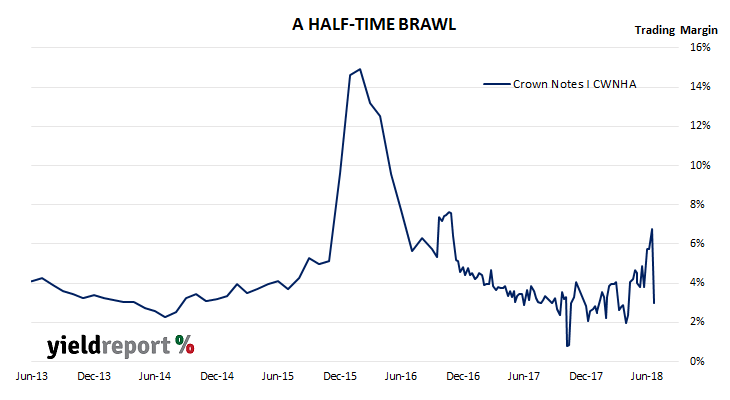
Crown’s first series of Subordinated Notes (ASX code: CWNHA) were issued in September 2012. They pay a floating rate of interest equivalent to 3 month BBSW + 500bps, have a first call date on Friday, 14 September 2018 and their final maturity date is on 14 September 2072.
Crown has just announced it will redeem all outstanding series 1 notes on the first call date. Holders will receive the final interest payment of $1.78 in addition to the $100.00 face value.
The price of the notes increased by 0.8% on the day of the announcement to close at 101.10%. At this price, the internal rate of return (IRR) before transaction costs is just under 3.90%.
The announcement follows a similar announcement from Westpac regarding the redemption of its Westpac Subordinated Notes II (ASX code: WBCHB). Suncorp and AMP are expected to take similar steps in the next few months.
18 July 2018
Westpac and the Melbourne Institute describe their Leading Index as a composite measure which attempts to estimate the likely pace of economic activity relative to trend in Australia. The index combines certain economic variables which are thought to lead changes in economic growth into a single variable. This variable is claimed to be a reliable cyclical indicator for the Australian economy and an indicator of swings in Australia’s overall economic activity.
The six month annualised growth rate of the indicator fell from a revised +0.05% in May to -0.33% in June. These figures represent growth rates relative to trend-GDP growth, which is generally thought to be around 2.75% per annum for Australia. The Index is said to lead GDP by 3 months to 6 months, so theoretically the current reading represents an annualised GDP growth rate of around 2.5% in the September or December quarters.
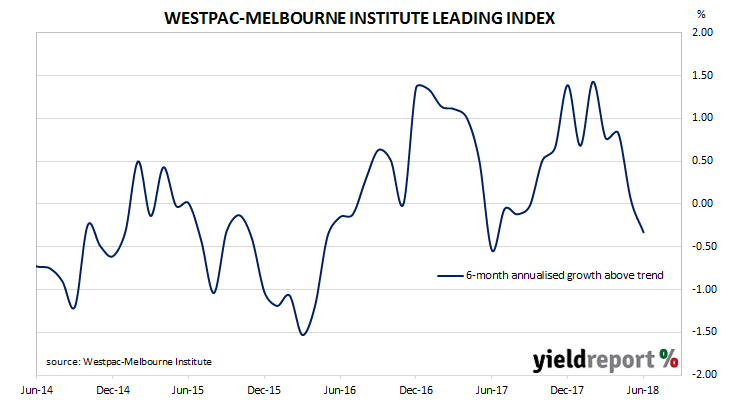
According to Westpac chief economist Bill Evans, the largest negative influences included increased expectations of becoming unemployed and lower commodity prices when measured in Aussie dollars. Other components of the index either had less positive effects or outright negative effects when compared to May’s figures.
18 July 2018
The UK economy appears to be back in “normal” territory. Unlike most European economies, it has an unemployment rate close to 4%, an inflation rate between 2% and 3% and a GDP growth rate which has an average 2.2% over the last five years. However, the Bank of England (BoE) has been reluctant to raise the official interest rate, especially as the UK’s growth rate has fallen below 2% in recent quarters.
The annual rate of UK consumer inflation did not change in June, as higher fuel prices were offset by discounting of clothing, games and toys. Consumer price index (CPI) figures released by the Office of National Statistics (ONS) indicated seasonally-adjusted consumer prices remained unchanged on average over the month, which is less than the +0.2% increase expected and well down on April’s comparable figure of 0.4%. On a 12-month basis, the consumer inflation rate remained unchanged at 2.4% (seasonally adjusted) for a third consecutive month.
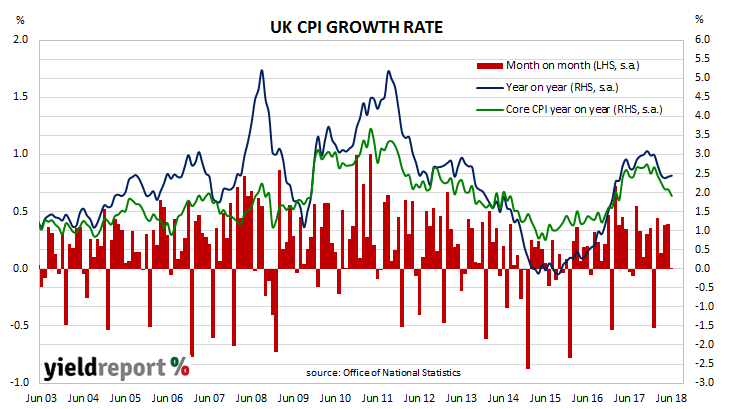 Although the figures were considerably less than expected, Westpac’s Finance AM team said the likelihood of an increase in the UK’s official rate “remains high…given recent BoE comments.” UK bond markets reacted by sending gilt yields and sterling lower. 5-year and 10-year yields each fell by 3bps to 0.99% and 1.23% respectively while the pound was weaker against other major currencies.
17 July 2018
The RBA held the official cash rate steady at its board meeting in July, as it had for every meeting since the cash rate was reduced in August 2016. So far, the RBA has not shown any indication it is about to take the same path at the US Fed, although it has indicated the next rate change is likely to be an increase.
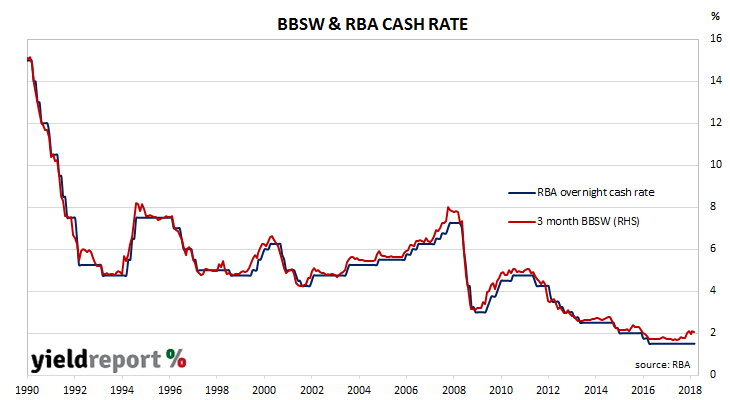
Prior to the release of the minutes, speculation had centred on the RBA’s view of the forces driving the recent increase in short-term funding costs. BBSW increased from around 1.80% at the end of March to over 2.10% in June and it is currently just over 2.00%. As BBSW is the benchmark for interest rates on billions of dollars of loans and other financial instruments, its recent increase in the absence of higher official interest rate rises has provoked some discussion as to forces involved.
As it turned out, the RBA minutes added very little to the “other factors” reference made in the media release immediately after the July Board meeting. However, Westpac senior economist Matthew Hassan said the prominence given to statements regarding mortgage rates suggest “the Bank is not overly concerned about the current situation” in the wholesale market where BBSW is set and he was looking “forward to a fuller assessment in the RBA’s August Statement on Monetary Policy.”

