04 July 2018
Retail sales figures have been lacklustre for the past couple of years despite a falling savings rate. Economists have explained the low growth rate as a result of record household debt and modest income growth. While sales figures for three out of the last four months have beaten expectations, some larger monthly figures will be required before economists call an end to the down-trend.
Total retail sales beat expectations again in May as total retail sales grew by +0.4% over the month, seasonally adjusted. On a year-on-year basis, sales grew by 2.5%, down from April’s 2.7% annual rate.
The better-than-expected increase followed an upwardly-revised growth rate of 0.5% in April and a flat result in March. The median market expectation was for a +0.3% increase but local markets did not pay a lot of attention and some bond yields slipped. Yields on 3 year bonds remained unchanged at 2.07% while 10 year bond yields lost 3bps to 2.60%. The Aussie was almost unchanged at 73.80 US cents.
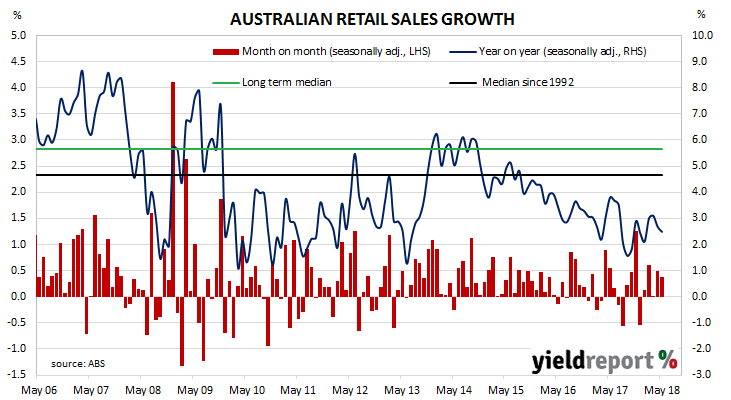
The “cafes and restaurants” segment fell by 1.0% while “other” sales were essentially flat. All of the other categories recorded increased sales, with department store sales providing the largest contribution.
03 July 2018
Aside from engineering and architectural design, one of the earliest requirements of a building project is to obtain approval from the relevant statutory body. As a result, building approvals data is a leading economic indicator of future construction. While not all projects which have been approved are completed, all completed projects have been granted approval. Approvals data thus provides a useful indicator of future construction.
The latest building approval figures have been released by the Australian Bureau of Statistics and the month-to-month swings caused by volatile apartment numbers have continued, compounded by a large drop in house approvals.
Total May approvals were 3.2% lower than April’s revised total and lower than the median forecast of a flat result. However, on a 12-month basis and after revisions, total approvals were 3.1% higher than the same month in 2017 and higher than April’s comparable figure of 1.2% after revisions.
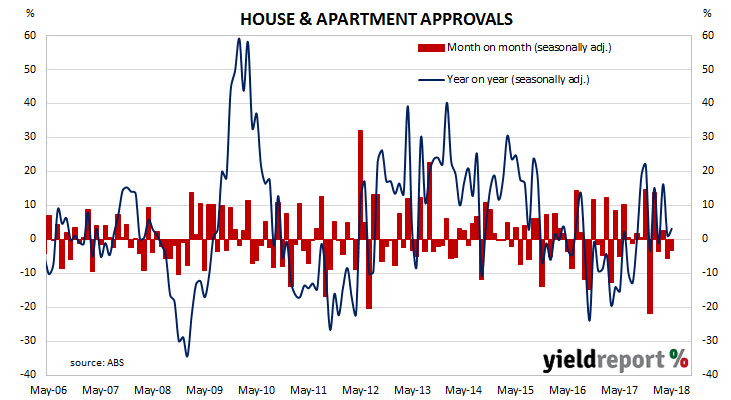 Bond yields had not moved by much in offshore markets and local financial markets were largely unreactive to the figures. By the end of the day, the yield on 3 year and 10 year bonds had both increased by 2bps to 2.07% and 2.63% respectively.
02 July 2018
Purchasing Managers’ Indices (PMIs) are economic indicators derived from monthly surveys of purchasing and supply executives in private sector companies. They are diffusion indices, which means a reading of 50% represents no change from the previous period, while a reading under 50% implies respondents on average reported a deterioration. Their usefulness lay in being a leading indicator of GDP.
US manufacturing activity rose more than expected in June and the latest figure is very much on the elevated side of past readings. According to the Institute of Supply Management (ISM) June survey, its Purchasing Managers Index recorded a reading of 60.2, up from May’s reading of 58.7 and more than the expected figure of 58. Readings of 60.8 recorded in September 2017 and February 2018 have been the highest in this cycle so far.
According to ANZ senior economist Joanne Masters, the possibility of US tariffs on inputs spurred businesses into action. “It is thought factories were scrambling for inputs ahead of the tariff introduction, which ISM reported the sector is worried about.”
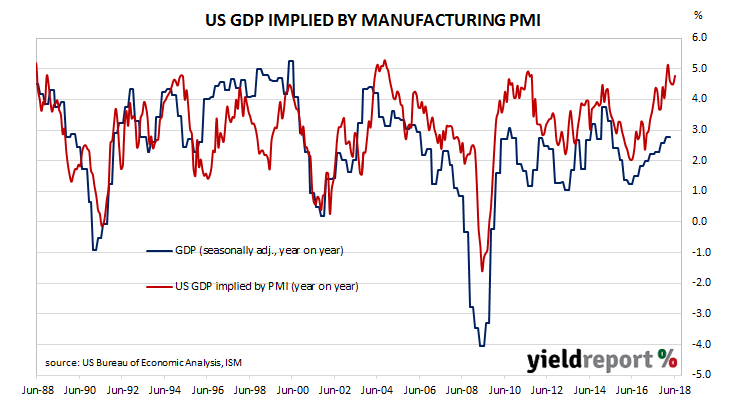
US markets reacted by sending yields higher at the short end while longer term yields did not react. 2 year yields increased by 4bps to 2.56% and 10 year yields remained unchanged at 2.87%. The US dollar moved higher against all major currencies.
02 July 2018
The Melbourne Institute’s Inflation Gauge is an attempt to replicate the ABS consumer price index (CPI) on a monthly basis instead of quarterly. It has turned out to be a reliable leading indicator of the CPI, although there are periods in which the Inflation Gauge and the CPI have diverged for periods of up to six to twelve months. On average, the Inflation Gauge’s annual rate tends to overestimate changes in the CPI inflation by about 0.09% in any given month.
The Inflation Gauge was unchanged again during June after a flat result in May and a 0.5% increase in April. Compared to a year ago, the index is 2.0% higher, thus reversing the small increase from 2.0% to 2.1% in May.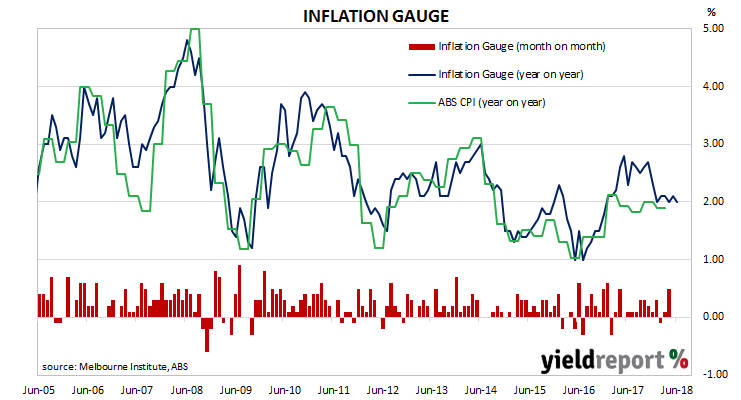
In conjunction with figures from April and May, the latest figures imply an official CPI reading of 0.4% (seasonally adjusted) for the June quarter. In annual terms, this implies a CPI figure of around 2.1% or 0.2% more than March’s comparable figure.
02 July 2018
Despite another month of trade tensions, the US economy has continued to produce jobs at a faster rate, drawing additional Americans into the workforce.
According to the US Bureau of Labor Statistics, the US economy created 213,000 jobs in the non-farm sector in June. The latest figures also include upward revisions to previous employment numbers and figures for April and May were revised up by a total of 37,000.
ANZ economist Kishti Sen said the report was indicative of continued labour market growth which would not impede Federal Reserve rate rises. “Overall, it was a solid report and there is no evidence of any let-up in labour market strength despite the maturity of the business cycle and trade concerns. The momentum in the jobs data is still consistent with the Fed hiking in September.”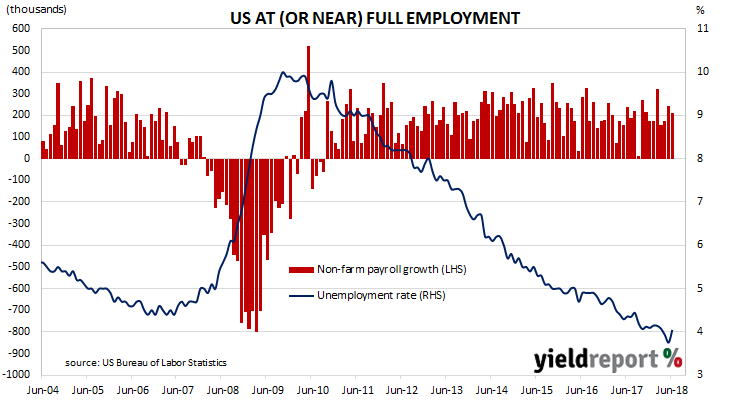
Economists were expecting around 195,000 additional positions but US financial markets reacted by sending both short-term yields and longer-term yields lower. At the close of business, 2 year bond yields were 2bps lower at 2.53%, 10 year yields had slipped 1bp to 2.82% and the yield on 30 year Treasury bonds had lost 2bps to 2.93%. The US currency was weaker against other major currencies. According to cash futures prices, the implied probability of a rate rise by the US FOMC at its June meeting fell back from 82.2% to 79.6%.
02 July 2018
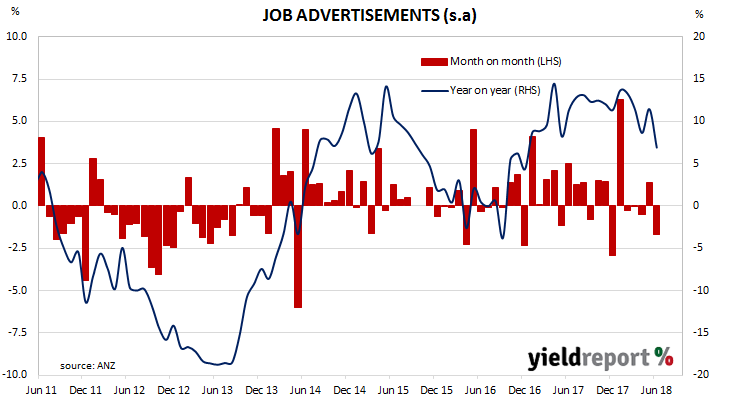
ANZ’s job advertisement survey is well-known as a leading indicator of employment numbers in Australia. It reflects changes in demand for labour and it provides another measure of activity in the economy. There is also a fairly good inverse relationship between changes in Australia’s unemployment rates and changes in the RBA cash rate. Understanding the path of Australia’s unemployment rate has historically provided a reliable indicator of RBA rate changes.
June’s figures have been released and, after revisions, total advertisements fell by 1.7% to 175,660 (seasonally adjusted) while May’s seasonally adjusted figures were revised down from 181,812 to 181,765. On a 12 month basis, total job advertisements grew by 6.9%, which is quite a drop from May’s comparable growth rate of 11.5%.
Bond yields finished the day lower despite a rise in US yields on Friday night. Yields on 3 year and 10 year bonds both fell by 3bps to 2.05% and 2.61% respectively while the Aussie fell by around 0.70 US cents to 73.40 US cents.
29 June 2018
One of the US Fed’s favoured measures of inflation is the change in the core personal consumption expenditures (PCE) price index. The core version strips out energy and food components, which are volatile from month to month, in an attempt to identify the prevailing trend. It’s not the only measure of inflation used; the Fed also tracks the Consumer Price Index (CPI) and Producer Price Index (PPI) from the Department of Labor.
The latest figures have been published by the Bureau of Economic Analysis as part of the May figures for its personal income and expenditures report. At 0.2% for the month, core PCE inflation was the same as April’s figure and in line with the +0.1% which was expected.
Market reaction was muted but bond yields finished a little higher while the USD was up a touch against the euro but steady against the yen and sterling. 2 year bond yields ticked up 1bp to 2.52% while 10 year yields gained 3bps to 2.87% and 30 year bond yields added 2bps to 2.99%.
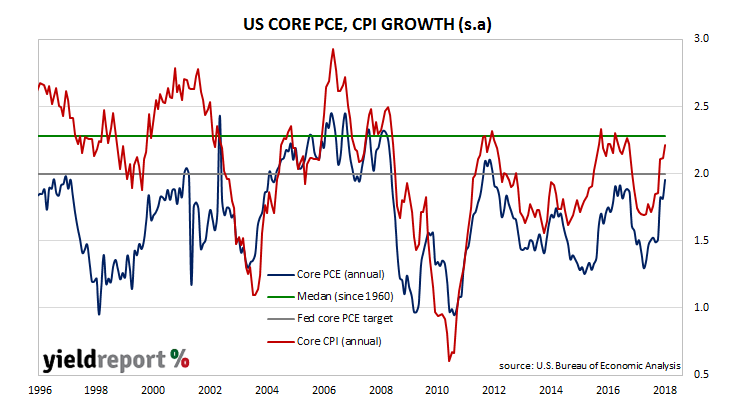
On an annual basis, the index grew by 2.0%, which was as expected but a jump from April’s comparable figure of 1.8%. Annual core PCE inflation has been steadily moving higher since March after ranging between 1.3% and 1.6% for around a year. It is the first time since April 2012 the annual growth rate has hit the Fed’s 2.0% target.
29 June 2018
The pace of lending to the non-bank private sector by financial institutions in Australia has fallen back to its lowest rate since May 2014. According to the latest RBA figures, private sector credit grew by 0.2% in May, down from the 0.4% growth rate recorded in April and half the consensus estimate of 0.4%. The year-to-May growth rate fell back from 5.1% to 4.8% as personal loans and lending to house investors stagnated while business lending contracted.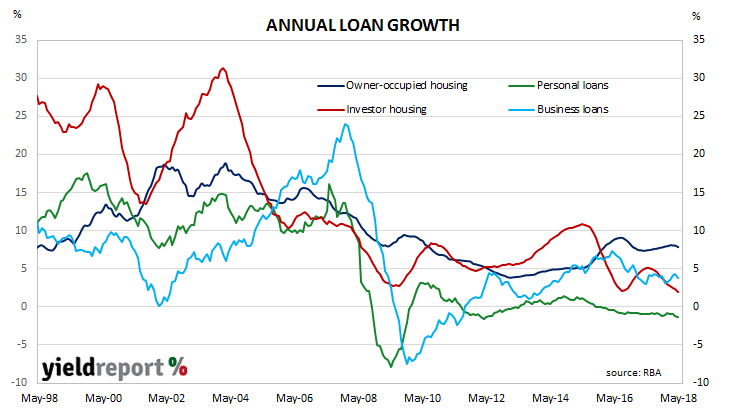
The small overall increase was driven entirely by “owner-occupier” loans. Typically, business lending is another major contributor to overall changes but on this occasion, the segment actually contracted. By value, these two segments account for nearly 75% of outstanding loans while loans to house investors account for just over 20%.
Business credit growth dropped from a growth rate of +0.5% in April to a 0.2% contraction in May and its annual growth rate slowed from 4.3% to 3.8% after having accelerated for several months. The owner-occupier segment repeated March’s and April’s 0.6% growth rate with the same-sized increase in May but its annual growth rate slipped back from 8.0% to 7.9%.
Lending to investors continued to slow. Credit growth in this segment eased from a growth rate of +0.1% in April to +0.0% in May. Its annual growth rate also fell back, for the eleventh month in a row, from 2.3% to 2.0%.
26 June 2018
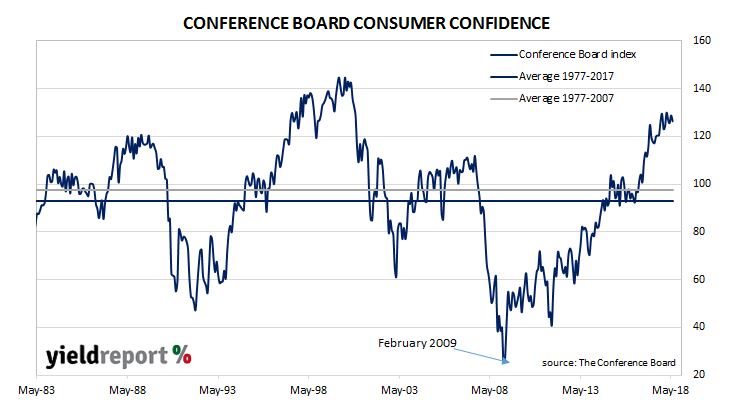
The Conference Board’s Consumer Confidence Survey is one of two monthly US consumer sentiment indices, the other being the University of Michigan’s Index of Consumer Sentiment. It covers personal finances, business conditions and buying conditions.
The latest June survey includes responses up to 15 June and it indicates US consumers’ perceptions of current conditions are largely unchanged from May while their views regarding the short-term were mixed. The net result was a fall in the index from a revised 128.8 in May to 126.4 in June.
Lynn Franco, Director of Economic Indicators at The Conference Board said the survey suggests consumers do not expect conditions to improve from what is historically high base. “Consumers’ assessment of present-day conditions was relatively unchanged, suggesting that the level of economic growth remains strong. While expectations remain high by historical standards, the modest curtailment in optimism suggests that consumers do not foresee the economy gaining much momentum in the months ahead.”
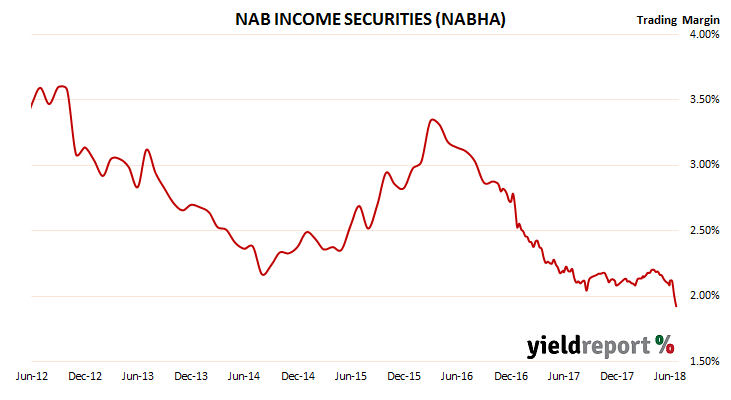
25 June 2018
The strength in the price of NAB income securities (ASX code: NABHA) has provoked some comment from analysts and other observers recently. Usually, any short-term price rise is provoked by speculation regarding a redemption. Investors’ willingness to acquire them pushes the price higher as buyers ignore a small additional cost to them in light of an expectation of a much larger gain.
The income securities have a face value of $100, so some investment advisers mistakenly spruik the idea of a $100 payout. In reality, a buyback at a discount to face value but at a premium to the current market price is more realistic. In any case, it is unlikely to occur before 2022 when the income securities lose their “Tier 1 capital” status. NAB would then begin franking any distributions to investors in line with franking on its ordinary shares.