12 June 2018
US consumer inflation has pushed higher in May, driven by higher energy prices and implied rents and shelter costs. Consumer price index (CPI) figures released by the Bureau of Labor Statistics indicated seasonally-adjusted consumer prices increased by +0.2%, in line with economists’ expectations and the same as April’s figure. On a 12-month basis, the consumer inflation rate increased from April’s 2.4% to 2.7%.
12 June 2018
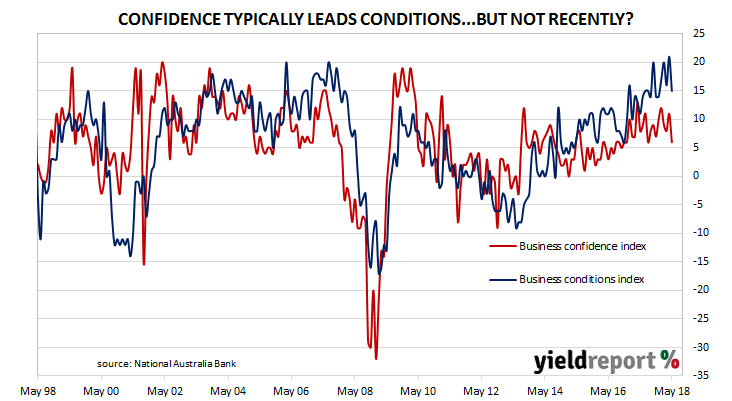
Over the last few months, the adjectives used by NAB economists to describe business conditions have strengthened from “solid” to “elevated” and then to a “record high” in April. Now, conditions are back to “relatively high levels” after a steep, but not unprecedented, fall in May.
According to NAB’s latest monthly business survey of 400 firms conducted in the last week of May, its Business Conditions Index reversed April’s jump to 21 and fell back to a reading of 15. NAB chief economist Alan Oster said, “The strength is generally broad-based across industries although retail continues to lag.”
12 June 2018
The Australian Bureau of Statistics (ABS) collects data on housing finance commitments made by significant lenders and their figures include secured (mortgage) finance commitments for the construction or purchase of owner-occupied dwellings and investment properties. It has some overlap with the RBA’s monthly private sector credit statistics which also includes investor lending and owner-occupier lending.
The ABS has released housing finance figures for April which are largely in line with market expectations. The number of owner-occupier approvals were 1.4% lower over the month and 2.9% lower than in April 2017. Excluding refinancing, the number of approvals declined by 1.9% for the month and by 4.4% for the year.
In dollar terms, the total value of loan approvals, excluding refinancing, decreased by 0.1% for the month and by 4.6% on a year-on–year basis.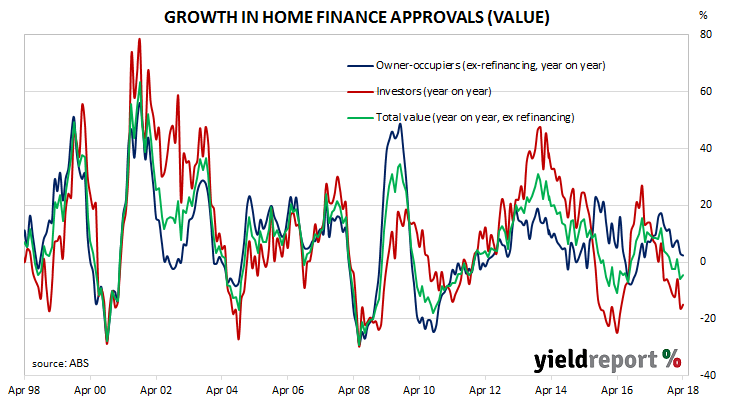
05 June 2018
The “quits” rate time series produced by the Job Openings and Labor Turnover Survey (JOLTS) is a leading indicator of US hourly pay. As wages account for around 55% of a product’s or service’s price*, wage inflation and overall inflation rates tend to be closely related. Former Federal Reserve chief Janet Yellen was known to pay close attention to the quit rate but whether new Fed chief Jerome Powell regards the indicator with as much interest is as yet unknown.
Figures released as part of the most recent JOLTS report show the quit rate remained unchanged at 2.3% of the non-farm workforce at the end of April. Higher quit rates in the “state/local education” and real estate sectors were offset by lower rates in finance/insurance and durable goods sectors.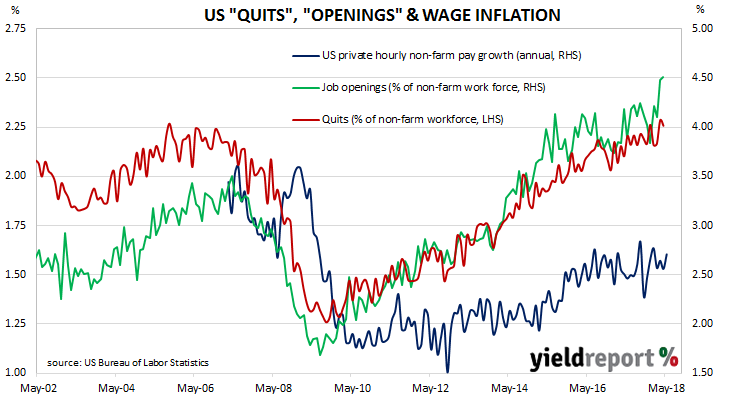
The total number of job openings also remained at its highest level since the series began in December 2000. Total openings during April increased from 6.6 million to 6.7 million with the largest number of openings in the durable goods manufacturing and information sectors. Job openings as a percentage of the non-farm workforce remained unchanged at 4.5% after revisions.
04 June 2018
ANZ’s job advertisement survey is well-known as a leading indicator of employment numbers in Australia. It reflects changes in demand for labour and it provides another measure of activity in the economy. There is also a fairly good inverse relationship between changes in Australia’s unemployment rates and changes in the RBA cash rate. Understanding the path of Australia’s unemployment rate has historically provided a reliable indicator of RBA rate changes.
May’s figures have been released and, after revisions, total advertisements were 1.5% higher at 179,245 (seasonally adjusted) while April’s seasonally adjusted figures were revised up from 176,418 to 176,573. On a 12 month basis, total job advertisements grew by 11.5% while April’s comparable growth rate was revised up to 8.7%.

Bond yields and the local currency finished the day higher. Yields on 3 year bonds increased by 5bps to 2.21% and 10 year bond yields added 3bps to 2.74% while the local currency increased by around 0.80 US cents to 76.50 US cents. However, the surge in the currency was more likely attributed to higher-than-expected retail sales figures which came out at roughly the same time, while bond yields were also influenced by higher yields in US markets on Friday night.
04 June 2018
Retail sales figures have been lacklustre for the past couple of years despite a falling savings rate. Economists have explained the low growth rate as a result of record household debt and modest income growth. While sales figures for two out of the last three months have beaten expectations, some more positive figures will be required before economists call a change in what has been a down-trend since 2014/2015.
Total retail sales rebounded in April and total retail sales grew by +0.4% over the month, seasonally adjusted. On a year-on-year basis, sales grew by 2.6%, down from March’s 3.2% annual rate.
The better-than-expected increase followed a flat result in March and a strong 0.6% increase in February. The median market expectation was for a +0.3% increase and bond yields and the local currency finished the day higher. Yields on 3 year bonds increased by 5bps to 2.21% and 10 year bond yields added 3bps to 2.74% while the local currency increased by around 0.8 US cents to 76.50 US cents.
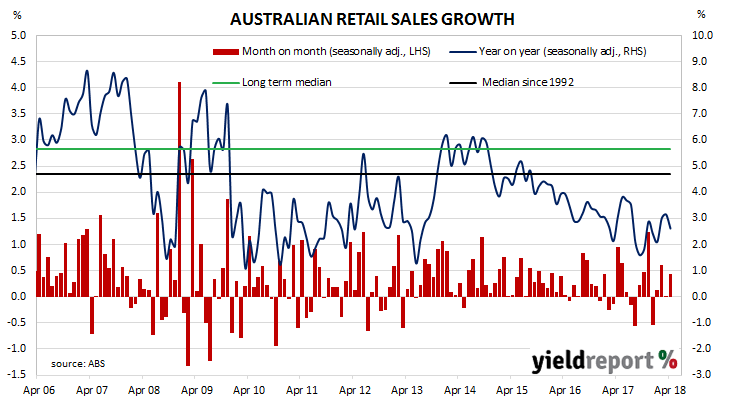
Clothing sales fell by 0.8% while department stores sales fell by 0.9% over the month. All of the other categories recorded increased sales, with cafes and restaurants providing the largest contributions.
04 June 2018
The Melbourne Institute’s Inflation Gauge is an attempt to replicate the ABS consumer price index (CPI) on a monthly basis instead of quarterly. It has turned out to be a reliable leading indicator of the CPI, although there are periods in which the Inflation Gauge and the CPI have diverged for periods of up to six to twelve months. On average, the Inflation Gauge’s annual rate tends to overestimate changes in the CPI inflation by about 0.09% in any given month.
The Inflation Gauge was unchanged during May after a 0.5% increase in April and a 0.1% increase in March. Compared to a year ago, the index is 2.1% higher, which is a modest increase from April’s comparable figure of 2.0%.
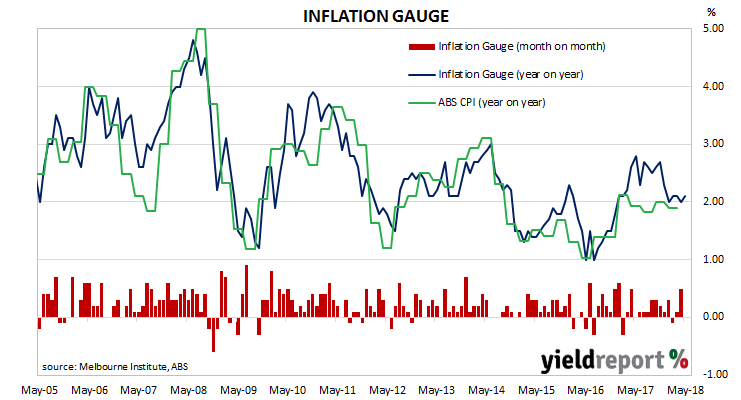
As a leading indicator, one would expect official CPI figures to follow the Melbourne Institute measure. However, the last two divergences have turned out to be “false starts” and the Inflation Gauge fell back to the official annual CPI figure at the start of 2018. The two measures have remained reasonably close to each since.
01 June 2018
Despite trade and political tensions, the US economy has continued to produce jobs at a faster rate than population growth, propelling the unemployment rate to a forty-year low.
According to the US Bureau of Labor Statistics, the US economy created 238,000 jobs in the non-farm sector in May. The latest figures also include upward revisions to previous employment numbers and figures for March and April were revised up by a total of 15,000.
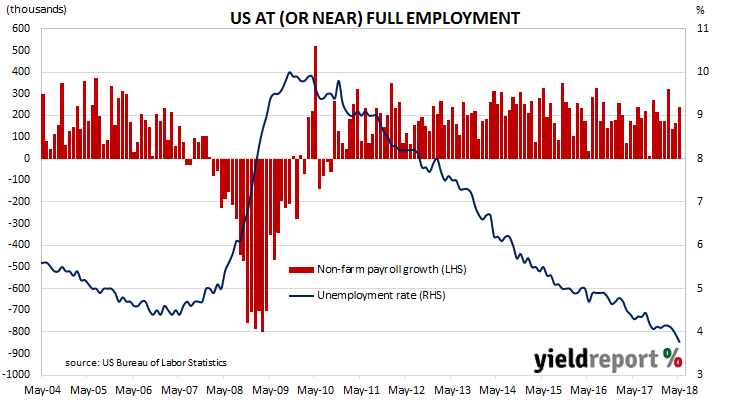
Economists were expecting +190,000 additional positions and US financial markets reacted by sending both short-term yields and longer-term yields higher. By the end of the day, 2 year bond yields were 5bps higher at 2.48%, 10 year yields gained 4bp to 2.90% and the yield on 30 year Treasury bonds added 3bps to 3.05%. The US currency was stronger against the yen and euro but weaker against the pound. According to cash futures prices, the implied probability of a rate rise by the US FOMC at its June meeting remained at 100%.
31 May 2018
Australia’s capital expenditure (capex) slump appears to have come to an end. Investment by the mining sector increased as a proportion of GDP for the first time since June 2014.
According to the latest ABS figures, seasonally-adjusted capex in the March quarter grew by 0.4%, up from the -0.2% rate recorded in the December quarter but lower than the 1% increase which was expected. On a year-on-year basis, the rate of capex growth slipped back to 3.7% after recording 4.2% in the December quarter.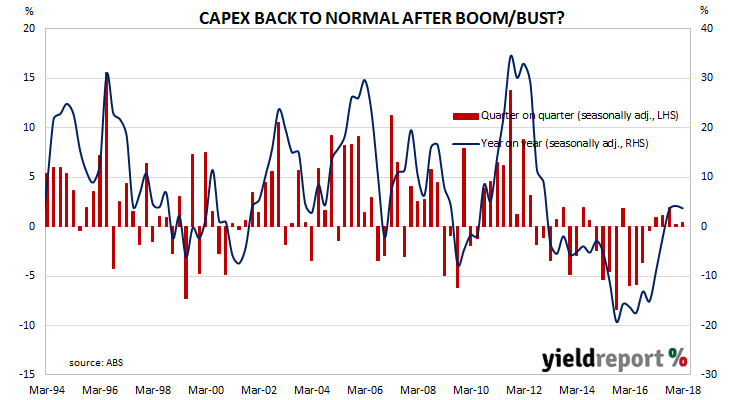
31 May 2018
The pace of lending to the non-bank private sector by financial institutions in Australia has remained unchanged for the second month in a row. According to the latest RBA figures, private sector credit grew by 0.4% in April, down from the 0.5% growth rate recorded in March and in line with the 0.4% consensus estimate. The year-to-April growth rate remained unchanged at 5.1% as lenders expanded loans to the business sector and owner-occupiers. Loans to housing investors stagnated while the value of all personal loans contracted.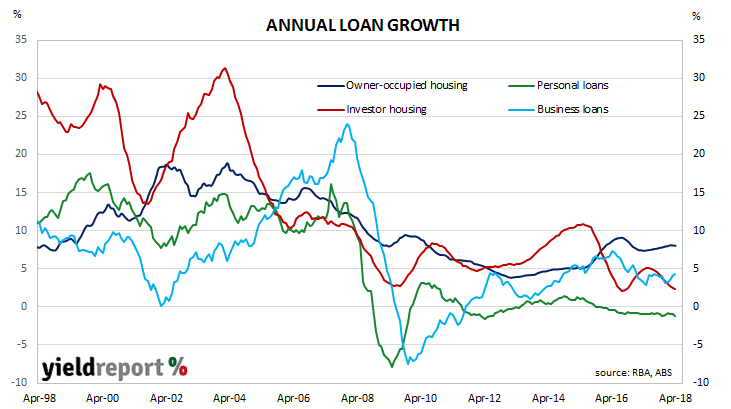
The overall increase was driven equally by business loans and “owner-occupier” loans. These two segments account for nearly 75% of outstanding loans by value. Any change in the total value of either of them has a large effect on overall credit growth.
Business credit growth slipped back from a revised growth rate of +0.7% in March to +0.5% in April while its annual growth rate increased for a fourth month in a row, this time from 4.2% to 4.3%. Owner-occupier loan growth repeated March’s 0.6% growth rate with a +0.6% increase in April but its annual growth rate slipped back from 8.1% to 8.0%.

