14 May 2018
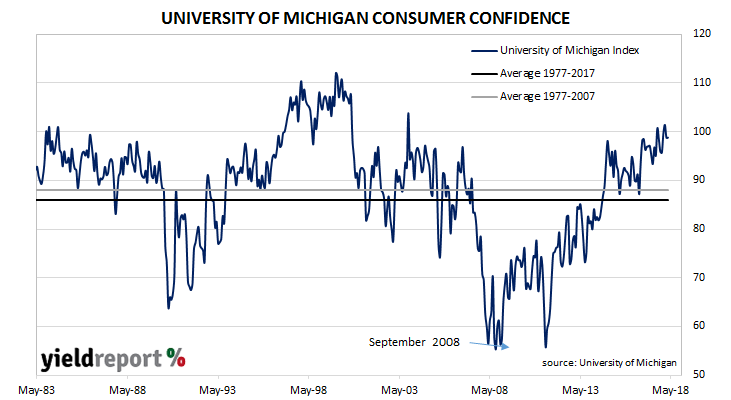
The University of Michigan’s Index of Consumer Sentiment is one of two monthly US consumer sentiment indices, the other being the Conference Board’s Consumer Confidence Survey. It covers personal finances, business conditions and buying conditions.
The latest survey conducted by the university indicates US consumers think current conditions have deteriorated slightly but, at the same time, they expect future conditions to be slightly more favourable. Notwithstanding these changes, on the whole, survey respondents indicated they were still considerably more optimistic than the long-term average (see chart below).
11 May 2018
The Australian Bureau of Statistics (ABS) collects data on housing finance commitments made by significant lenders and their figures include secured (mortgage) finance commitments for the construction or purchase of owner-occupied dwellings and investment properties. It has some overlap with the RBA’s monthly private sector credit statistics which also includes investor lending and owner-occupier lending.
The ABS has released housing finance figures for March and the figures indicate the number of owner-occupier approvals were 2.2% lower over the month and 3.5% lower than in March 2017. Excluding refinancing, the number of approvals declined by 1.7% for the month and by 3.5% in the year to the end of March.
In dollar terms, the total value of loan approvals excluding refinancing decreased by 4.8% for the month and by 6.0% on year-on-year basis.
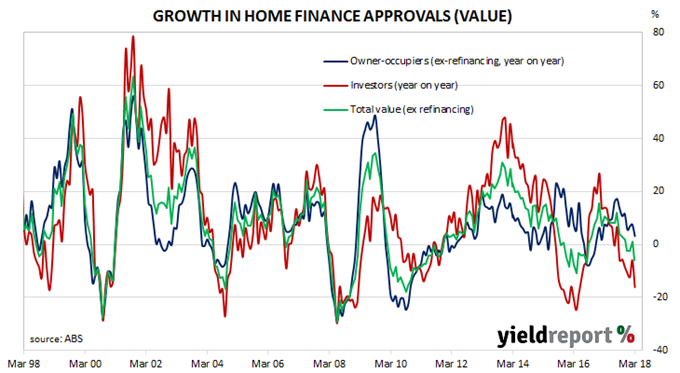
Investor loan approvals dropped by 9%, a fall which ranks among the larger monthly falls on record. The drop comes after small but positive increases in January and February. On an annual basis, the investor segment in March was 16% lower than in March 2017.
10 May 2018
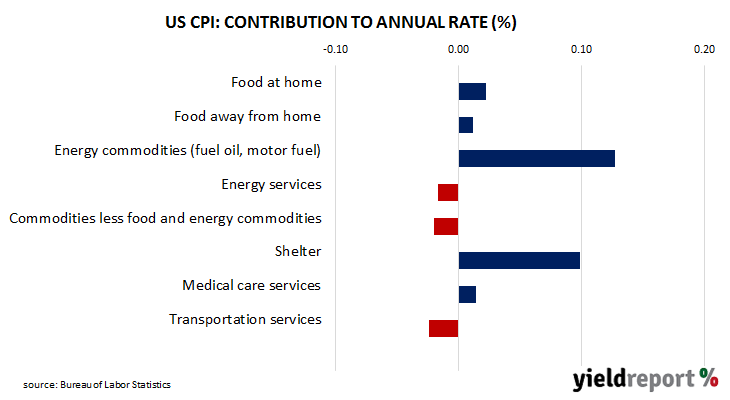
US consumer inflation rebounded from March’s fall as higher fuel prices and another increase in implied rents pushed the overall index higher. Consumer price index (CPI) figures released by the Bureau of Labor Statistics indicated seasonally-adjusted consumer prices increased by +0.2%, which is less than the 0.3% increase expected but more than March’s comparable figure of -0.1%. On a 12-month basis, the consumer inflation rate remained unchanged at 2.4% (seasonally adjusted).
09 May 2018
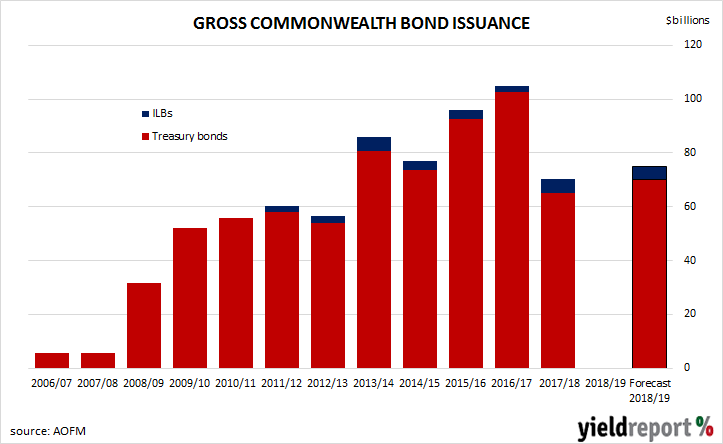
The 2018/2019 federal Government budget has been tabled and a budget deficit of $14.5 billion has been forecast. A small surplus is then forecast for 2019/2020.
The AOFM has subsequently published its expectations for bond issuance in the 2018/2019 financial year. Total issuance of treasury bonds for the year will be around $70 billion, with weekly bond tenders of around $1 billion each week, in addition to some debt sales via syndicated issues. Index-linked bond issuance in 2018-19 is expected to amount to $5 billion.
The AOFM plans to introduce some new bond lines during the upcoming year. Lines with maturity dates in September 2023, May 2030, December 2030 and May 2041 are expected.
09 May 2018
The producer price index (PPI) is a measure of prices charged by producers for domestically produced goods, services, and construction. It is constructed by the US Bureau of Labor Statistics in a fashion similar to the consumer price index (CPI) except it measures prices received from the producer’s perspective. It is another one of the various measures of inflation tracked by the US Fed, along with the CPI and core personal consumption expenditure (PCE).
The latest figures for April have been published by the Bureau and they indicate a +0.1% increase across the month. The increase was less than the +0.2% expected and lower than March’s +0.3%. On a 12-month basis, producer price inflation fell back to 2.7% in April after reading 3.0% in March and 2.9% in February.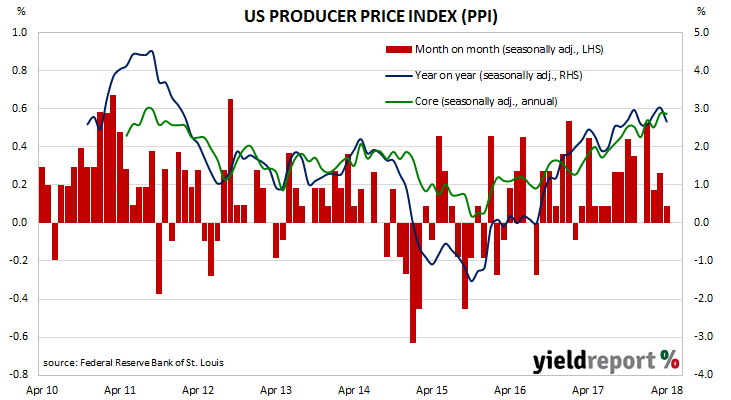
Core PPI, or PPI which excludes food, energy and trade services, increased by 0.4%, which is the same rate as in March. On a 12-month basis, it remained unchanged at 2.9% after reading 2.9% in March and 2.5% in February.
09 May 2018
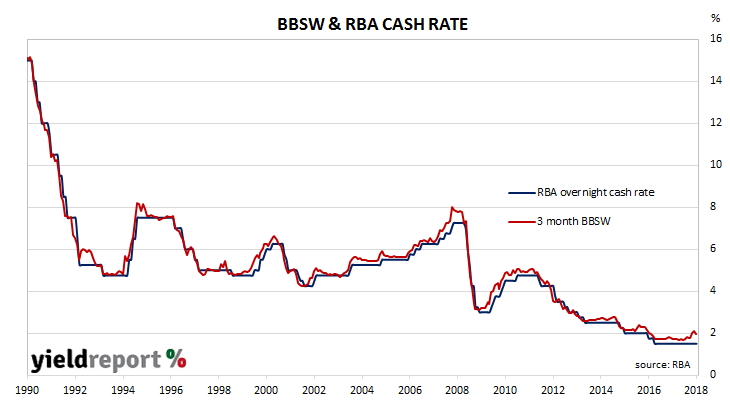
Commonwealth Bank has continued its “clearing of the decks” by agreeing with ASIC to settle its BBSW manipulation case. In the last year, Commonwealth has been accused of facilitating money laundering, or at least not doing enough to prevent it. It has also been dealing with problems in its financial planning and life insurance businesses. As a result, APRA forced it to set aside an additional $1 billion in capital.
Now, the bank “will acknowledge that, in the course of trading on the BBSW market in Australia on five occasions between February and June 2012, CBA attempted to engage in unconscionable conduct in breach of the ASIC Act.” Prior to a change in 2013, BBSW was set by taking an average of submissions from a panel of banks, including Commonwealth Bank.
08 May 2018
Retail sales figures have been lacklustre for the past couple of years despite a falling savings rate. Economists have explained the low growth rate as a result of record household debt and modest income growth. While February figures may have done something to suggest a change was about to take place, the latest retail sales figures will have reintroduced some doubts.
Total retail sales (seasonally adjusted) technically shrank by a small amount in March which, after rounding, amounted to no change when compared with February’s total sales. On a year-on-year basis, sales grew by 3.1%, up from February’s 3.0% annual rate.
The flat result follows a robust 0.6% increase in February and a modest 0.2% increase in January. It was below market expectations of a +0.2% increase in bond yields and the local currency falling as a result. Yields on 3 year and 10 year bonds both ended the day 1bp lower at 2.19% and 2.76% respectively while the local currency dropped by around 0.6 US cents to 74.50 US cents.
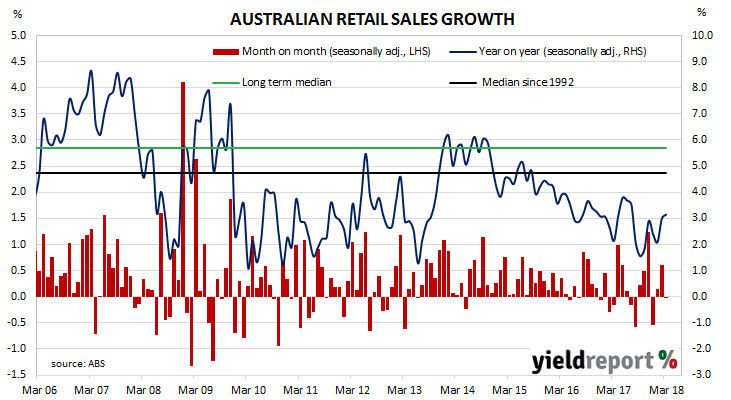
Only one of the six sales categories, food, recorded a positive growth rate. Spending in all of the other categories went backwards, especially those which could be considered to be more of the discretionary type.
08 May 2018
The “quits” rate time series produced by the Job Openings and Labor Turnover Survey (JOLTS) is a leading indicator of US hourly pay. As wages account for around 55% of a product’s or service’s price*, wage inflation and overall inflation rates tend to be closely related. Former Federal Reserve chief Janet Yellen was known to pay close attention to the quit rate but whether new Fed chief Jerome Powell regards the indicator with as much interest is as yet unknown.
Figures released as part of the most recent JOLTS report show the quit rate increased from 2.2% to 2.3% of the non-farm workforce at the end of March. Higher quit rates in the “other” and retail sectors were offset by lower rates in finance, insurance, professional and business service sectors.
The total number of job openings also increased to its highest level since the series began in December 2000. Total openings during March increased from just under 6.1 million to 6.6 million with the largest number of openings in the professional and business services and the construction sectors. Job openings as a percentage of the non-farm workforce climbed from 4.1% to 4.4%.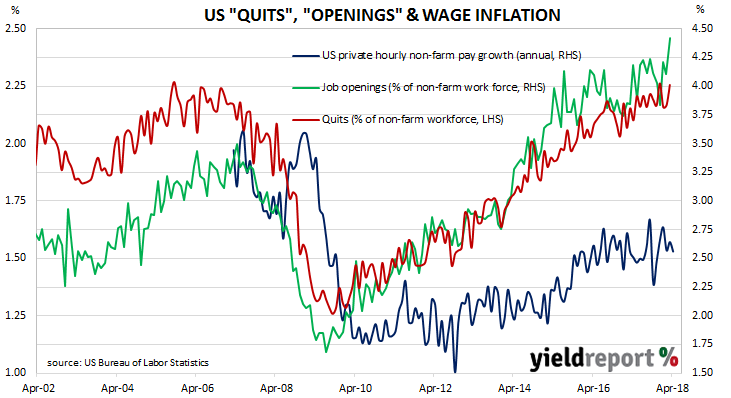
07 May 2018
ANZ’s job advertisement survey is well-known as a leading indicator of employment numbers in Australia. It reflects changes in demand for labour and it provides another measure of activity in the economy. There is also a fairly good inverse relationship between changes in Australia’s unemployment rates and changes in the RBA cash rate. Understanding the path of Australia’s unemployment rate has historically provided a reliable indicator of RBA rate changes.
April’s figures have been released and, after revisions, total advertisements were 0.2% lower at 176,418 (seasonally adjusted) while March’s seasonally adjusted figures were revised down from 177,084 to 176,840. On a 12 month basis, total job advertisements grew by 8.6% while February’s comparable growth rate was 11.5% (after revisions).
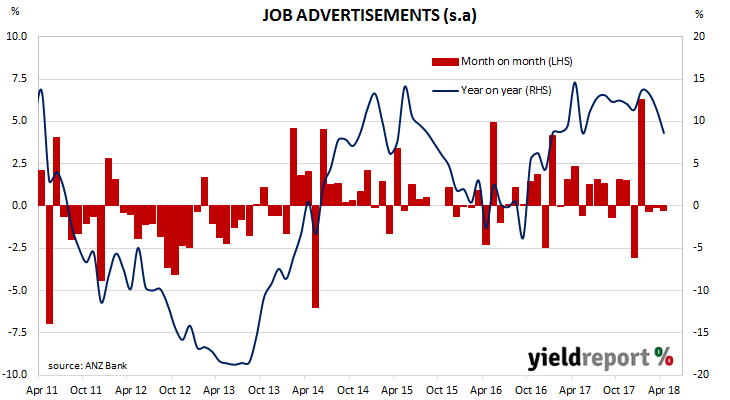
Three months of lower monthly figures was to be expected according to ANZ Head of Australian Economics David Plank “Alongside the loss of momentum in job ads, employment growth has also slowed. In part we think this slowdown in employment reflects payback after excessive strength.” However, he remains of the view the overall level of employment should grow. “While the growth in job ads has paused, the level of job ads is high and is consistent with ongoing employment growth. As well, business conditions and profitability remain well above their long term average. Levels of capacity utilisation also remain high…For 2018 as a whole we expect jobs growth to be at a pace consistent with a gradual decrease in the unemployment rate.”
07 May 2018
Over the last few months, the adjectives used by NAB economists to describe business conditions have strengthened from “solid” to “elevated” and then last month to “record high”. According to NAB’s latest monthly business survey of 400 firms conducted in the last week of April, its Business Conditions Index jumped from a revised reading of 15 to 21.
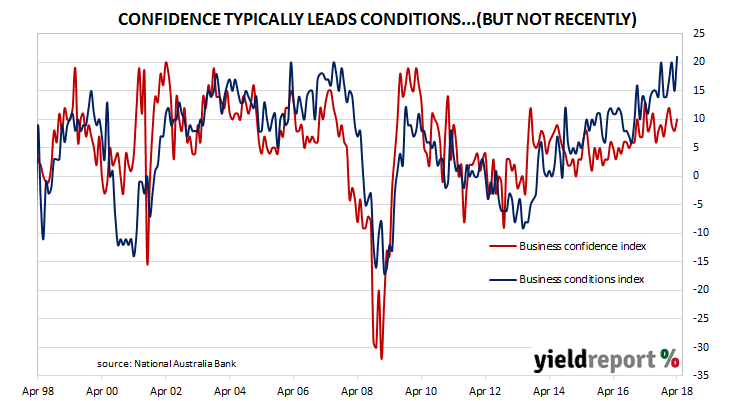
Typically, NAB’s confidence index leads the conditions index by approximately one month, although in recent months the two surveys have diverged and the condition index has led the confidence index higher in trend terms since late 2014. The latest figures have not changed this situation. The confidence index moved up from a revised reading of 8 in March to 10 in April, a figure which is above the long term average reading of 6 but not by particularly abnormal amount.

