04 May 2018
The Statement on Monetary Policy (SoMP) is released each quarter and it is closely watched for the updates to the RBA’s own forecasts.
In this quarter’s Statement, the RBA has increased its underlying CPI forecasts to June 2018 and December 2018 while it has also increased its unemployment rate forecasts for the same periods. GDP forecasts remained unchanged for GDP growth and headline inflation.
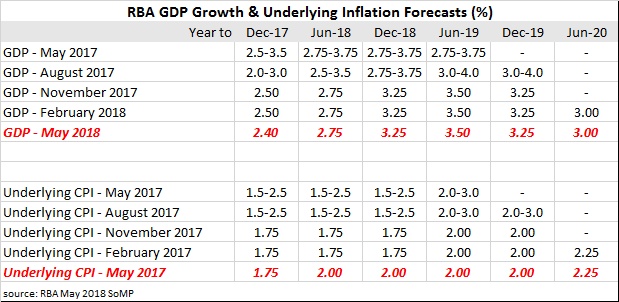
Some economists have found the RBA’s logic in this regard to be questionable. Bill Evans, Westpac chief economist, is one such economist. He has an issue with the concept of higher inflation rates in the context of higher unemployment rates. “The inflation and unemployment forecast changes seem somewhat inconsistent. A reasonable recognition of the slowdown in employment growth this year might have been more consistently communicated if the inflation forecast had not been increased. In particular, it seems a little bizarre to expect underlying inflation to print 2% from a 1.3% base over the last 9 months.”
04 May 2018
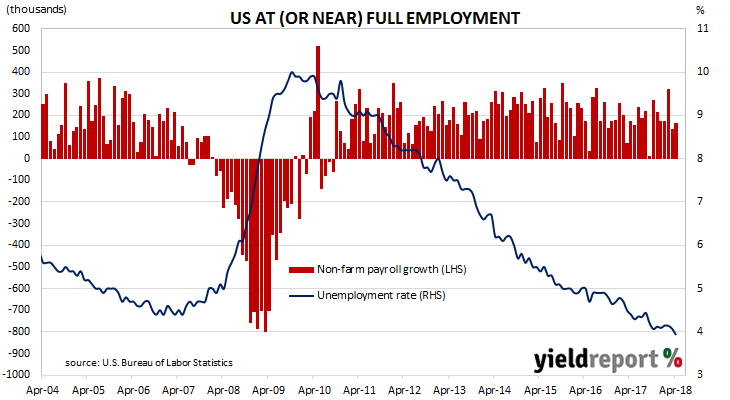
The US labour market continued to produce more jobs in April, sending the US unemployment rate under 4.0%. However, there is little sign of pressure on hourly wage rates and the total workforce actually shrank.
According to the US Bureau of Labor Statistics, the US economy created 164,000 jobs in the non-farm sector in April. The latest figures also include upward revisions to previous employment numbers and figures for February and March were revised up by a total of 30,000.
The market’s expectation for employment growth during the month was for +180,000 additional positions. US financial markets reacted by sending short-term yields higher while longer-term yields were either unchanged or a fraction lower. By the end of the day, 2 year bond yields were 2bps higher at 2.47% while 10 year yields slipped 1bp to 2.94% and the yield on 30 year Treasury bonds remained unchanged at 3.12%.
The US currency was stronger against the pound and euro but weaker against the yen. According to cash futures prices, the implied probability of a rate rise by the US FOMC at its June meeting remained at 100%.
03 May 2018
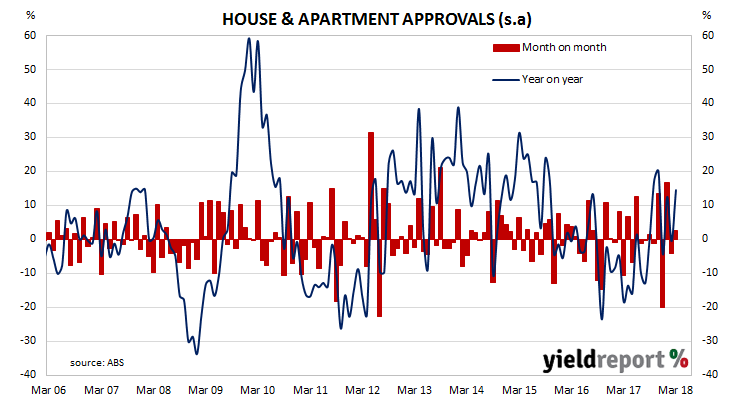
Aside from engineering and architectural design, one of the earliest requirements of a building project is to obtain approval from the relevant statutory body. As a result, building approvals data is a leading economic indicator of future construction. While not all projects which have been approved are completed, all completed projects have been granted approval. Approvals data thus provides a useful indicator of future construction.
The latest building approval figures have been released by the Australian Bureau of Statistics and the month-to-month swings caused by volatile apartment approvals has continued. Total March dwelling approvals were 2.6% higher than February’s revised total and a little higher than the median forecast of +1.0%. On a 12 month basis and after revisions, total approvals were 14.5% higher.
01 May 2018
US manufacturing activity fell back more than expected in April, although readings are still not far away from peak levels. According to the Institute of Supply Management (ISM) April survey, its Purchasing Managers Index recorded a reading of 57.3, down from March’s reading of 59.3 and less than the 58.5 expected. 60.8 has been the highest reading so far in this cycle.
According to ANZ Head of FX Research Daniel Been, the result was in line with declines in other surveys. It had little effect on financial markets and yields actually finished the day a little higher. 2 year yields edged up 1bp to 2.50% and 10 year yields added 2bps to 2.97%. The US dollar was up strongly against the euro, yen and especially sterling, but these movements were more likely to have flowed from the Trump Administration’s announcement regarding steel and aluminium tariffs.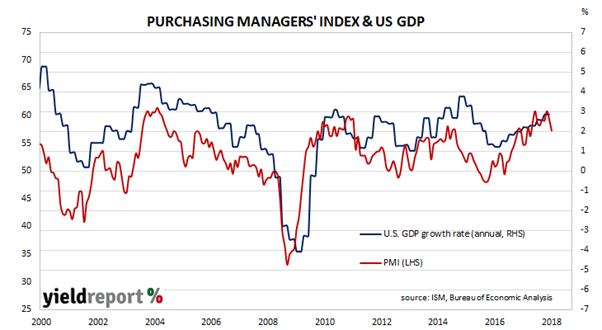
PMI figures appear to lead US GDP figures by a few months despite a considerable error in any given month. The chart below shows US GDP on a “year on year” basis (and not the BEA annualised basis) against US GDP implied by monthly PMI figures.
30 April 2018
One of the U.S. Fed’s favoured measures of inflation is the change in core personal consumption expenditures (PCE). The core version of consumer spending strips out energy and food components, which are volatile from month to month, in an attempt to identify the prevailing trend. It’s not the only measure of inflation used; the Fed also tracks the Consumer Price Index (CPI) and Producer Price Index (PPI) from the Department of Labor.
The latest PCE figures have been published by the Bureau of Economic Analysis as part of the March figures for personal income and expenditures report. At 0.2% for the month, core PCE inflation was in line with market expectations and the same as February’s figure, but only after rounding.
After the figures were released ANZ senior commodities analyst Daniel Hynes said, “Overall, inflation appears to be normalising with the period of transitory weak inflation last year having dropped out.”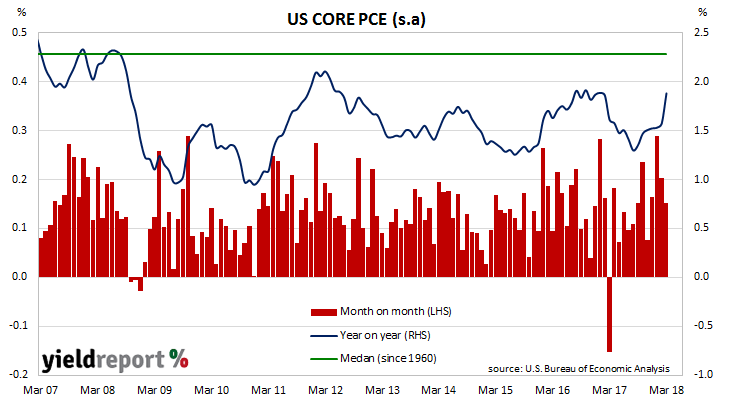
Annual core PCE inflation has been fluctuating between 1.3% and 1.6% since March 2017 but this latest reading took it outside this range. Annual core PCE recorded 1.9%, up from February’s comparable figure of 1.6% and January’s 1.5% and only just below the US Fed’s stated 2.0% target.
30 April 2018
The pace of lending to the non-bank private sector by financial institutions in Australia has picked up after three months of sub-5% growth. According to the latest RBA figures, private sector credit grew by 0.5% in March, up from the 0.4% growth rate recorded in February and more than the 0.4% consensus estimate. The year-to-March growth rate increased from 4.9% to 5.1% as lenders expanded loans to the business sector and, to a slightly-lesser extent, owner-occupiers.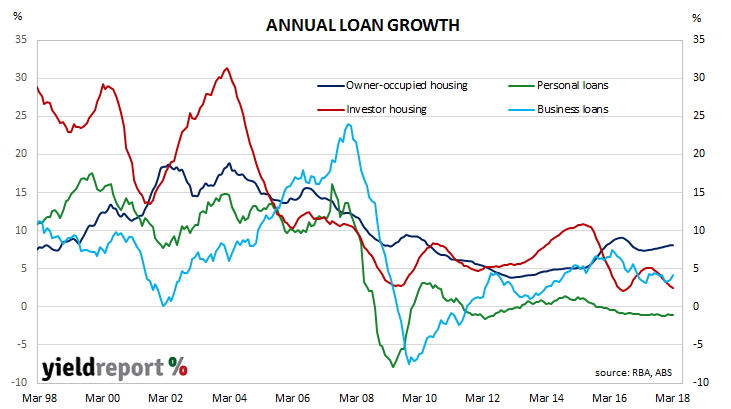
The overall increase was driven almost evenly by business loans and “owner-occupier” loans. Business credit growth accelerated from a sluggish 0.1% in February to 0.8% while its annual growth rate increased for a third month in a row, this time from 3.6% to 4.2%. Credit Suisse’s Equity Research team said they “think it is too early to get excited about a return of business credit” as strong months have typically been followed by “two or three months” of weak figures.
30 April 2018
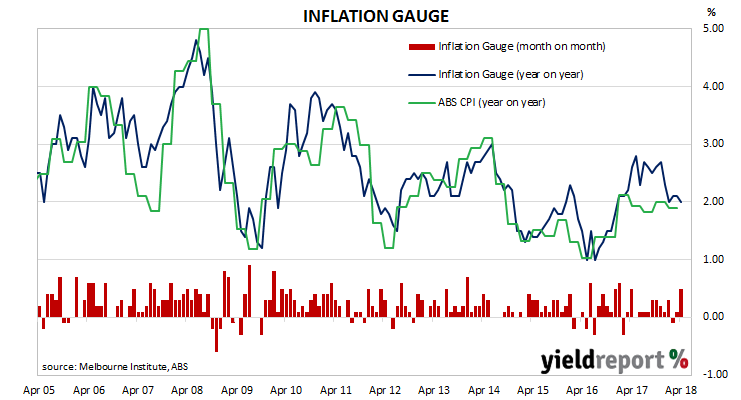
The Melbourne Institute’s Inflation Gauge is an attempt to replicate the ABS consumer price index (CPI) on a monthly basis instead of quarterly. It has turned out to be a reliable leading indicator of the CPI, although there are periods in which the Inflation Gauge series and the CPI have diverged, only for the two series to eventually converge over the space of six to twelve months. Generally, the Inflation Gauge’s annual rate tends to overestimate changes in the CPI inflation by about 0.09%.
The Inflation Gauge jumped by 0.5% during April, a large increase on March’s +0.1% increase and February’s 0.1% fall. Compared to a year ago, the index is 2.0% higher. This represents a slip in the annual rate from March’s comparable figure of 2.1%. (April 2017 also had a 0.5% increase for the month.)
27 April 2018
The UK Office of National Statistics (ONS) released first quarter (Q1) 2018 preliminary GDP estimates on Friday night Australian time and they indicate UK economic growth slowed in this latest period. Seasonally adjusted GDP grew by only 0.1% which was less than the 0.3% increase expected and less than the 0.4% increase during the December quarter. On a year-on-year basis, GDP grew by just 1.2%, down from December’s 1.4% annual rate and well under September’s figure of 1.8%.
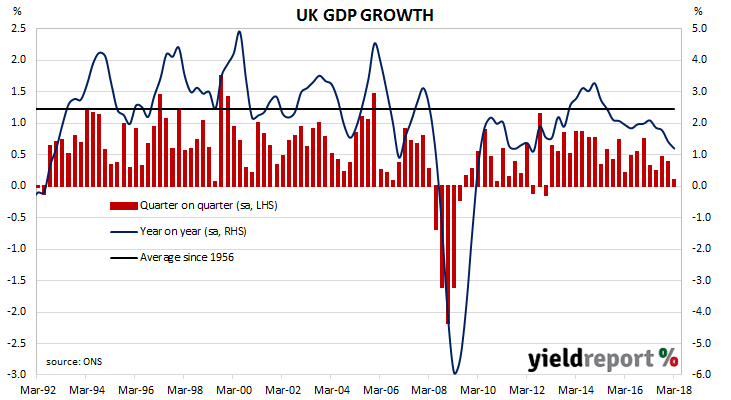
The ONS said construction was the largest negative factor on GDP after this segment contracted by 3.3%. The services segment were the largest contributor to GDP growth after it increased by 0.3% during the quarter. The weather had some effects on the result; energy production increased because of the cold weather but construction and retail sales were down for the same reason.
27 April 2018
While economic data has been largely pushed out of the spotlight recently by Korean peninsula geopolitics, life for economists, investors and traders still goes on. The US Commerce Department released first quarter (Q1) 2018 “advance” GDP estimates on Friday night Australian time and they indicate the US economy grew at an annualised growth rate of 2.3%. This estimate is the first of four estimates and subject to three more revisions over the next two months.
The growth figure is above the 1.8% median of market estimates but lower than the fourth quarter figure of 2.9%. NAB Head of FX Strategy Ray Attrill looked beyond the headline figures and saw some fragility. “The detail of the GDP data was less impressive, however, with private consumption rising by only 1.1% despite the boost to incomes in the quarter from January’s tax cuts, and inventories making a relatively large 0.4% contribution to growth.”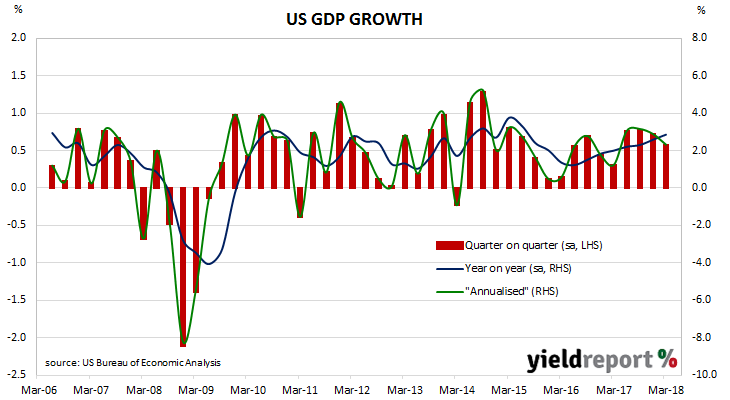
Yields of US Treasury bonds finished the day generally a little lower while reactions in currency markets were more mixed. 2 year bond yields remained unchanged at 2.48% while 10 year bonds were 2bps lower at 2.96%. The USD was weaker against yen and euro but stronger against sterling after UK GDP figures were well below expectations. Afterwards, futures markets were still factoring in a second rate rise for the year from the US Fed in June.
24 April 2018
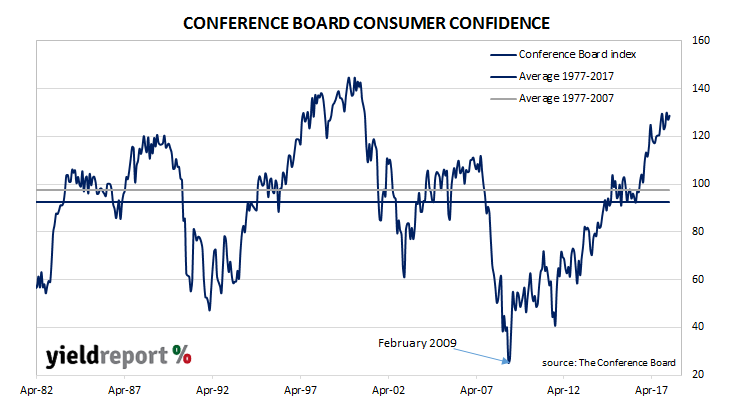
The University of Michigan’s Index of Consumer Sentiment is one of two monthly U.S. consumer sentiment indices, the other being the Conference Board’s Consumer Confidence Survey. It covers personal finances, business conditions and buying conditions.
The latest April survey indicates U.S. consumers consider both current and prospective conditions are slightly more favourable than in March. Readings are well above average and respondents reported more positive views with regards to business conditions and the labour market.