04 April 2018
Aside from engineering and architectural design, one of the earliest requirements of a building project is to obtain approval from the relevant statutory body. As a result, building approvals data is a leading economic indicator of future construction. While not all projects which have been approved are completed, all completed projects have been granted approval. Approvals data thus provides a useful indicator of future construction.
The latest building approval figures have been released by the Australian Bureau of Statistics and they indicate total approvals continue to be volatile from month to month. Total February dwelling approvals were 6.2% lower than January’s revised total and slightly lower than the median forecast of -5%. On a 12 month basis and after revisions, total approvals were 3.1% lower.
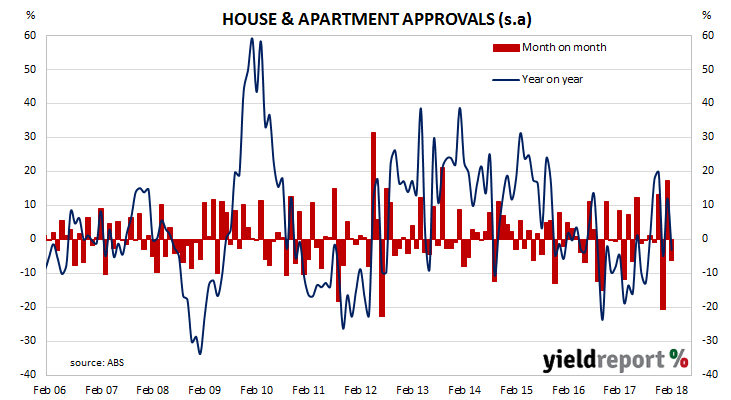
ANZ senior economist Daniel Gradwell said the figures had positive implications for housing construction for the rest of this year, despite their see-sawing nature. “With the volatility present in this series it is important to look at the underlying trends, and overall approvals are still sitting at elevated levels. We expect the backlog of work already under construction will keep dwelling investment solid through 2018.”
04 April 2018
After a large fall in consumer spending in December and a tepid recovery in January, one economist described the then-current retail sales figures as “a fairly bleak read”. The latest sales figures for February are unlikely to fit the same description after a substantial month-on-month increase.
Total retail sales (seasonally adjusted) increased by 0.6% in February, after rising by 0.2% in January. On a year-on-year basis, sales grew by 3.0%, up from the previous month’s 2.1% annual rate.
The growth rate was double the +0.3% increase which was expected and bond yields and the local currency moved up as a result. Yields on 3 year and 10 year bonds both ended the day 2bps higher at 2.18% and 2.64% respectively while the local currency increased from around 76.85 U.S. cents to 77.15 U.S. cents.
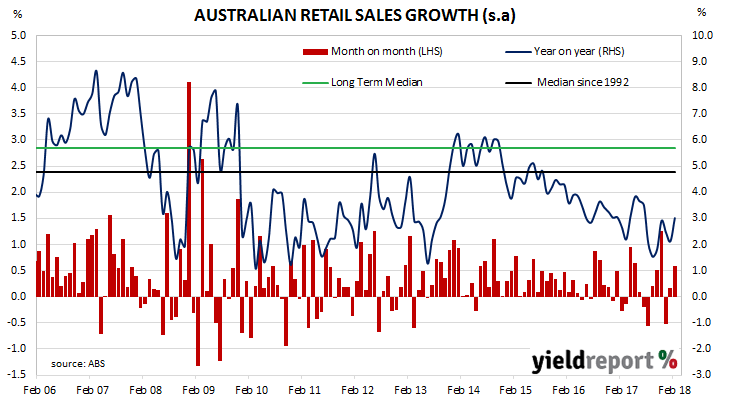
Four of the six sales categories experienced solid growth rates. The other two categories also increased, but by less-robust amounts.
03 April 2018
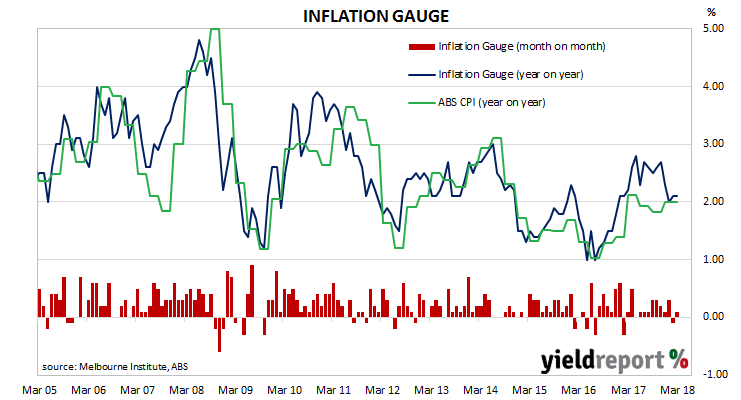
The Melbourne Institute’s Inflation Gauge is an attempt to replicate the ABS consumer price index (CPI) on a monthly basis instead of quarterly. It has turned out to be a reliable leading indicator of the CPI, although there are periods in which the Inflation Gauge series and the CPI have diverged, only for the two series to eventually converge over the space of six to twelve months. Generally, the Inflation Gauge’s annual rate tends to overestimate changes in the CPI inflation by about 0.08%.
During March, the Inflation Gauge reversed February’s 0.1% fall and increased by 0.1%, leaving the annual rate at 2.1%. In conjunction with figures from January and February, the latest figures imply an official CPI reading near 0.20% (seasonally adjusted) for the March quarter. In annual terms, this implies a CPI figure of around 1.7%, or 0.2% less than December’s comparable figure.
03 April 2018
ANZ’s job advertisement survey is well-known as a leading indicator of employment numbers in Australia. It reflects changes in demand for labour and it provides another measure of activity in the economy. There is also a fairly good inverse relationship between changes in Australia’s unemployment rates and changes in the RBA cash rate. Understanding the path of Australia’s unemployment rate has historically provided a reliable indicator of RBA rate changes.
March’s figures have been released and, after revisions, total advertisements were essentially unchanged at 177,084 (seasonally adjusted), but up from February’s revised figure of 177,051. On a 12 month basis, total job advertisements grew by 11.5% while February’s comparable growth rate was 13.3%.
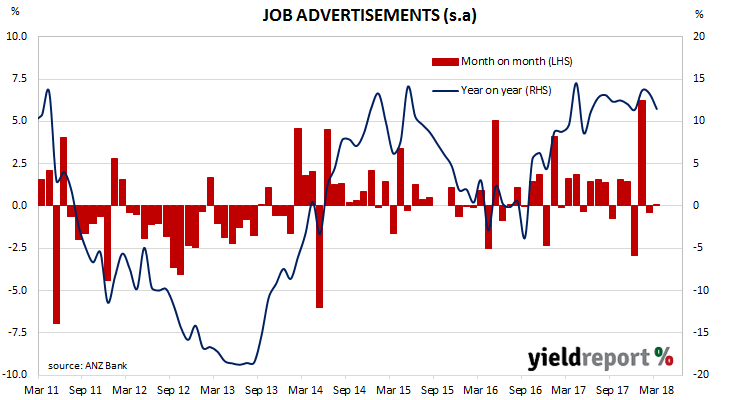
Despite only a minor increase in March after a 0.4% fall in February, ANZ Head of Australian Economics David Plank remained positive with regards to future employment growth. “Despite the recent stability in ANZ Job Ads, the labour market remains robust. The level of job ads is consistent with continued strength in employment growth, though we do expect some slowdown in the pace in which jobs are added. Businesses reported record conditions in February and the uptrend in capacity utilisation suggests that the unemployment rate will slowly grind lower through the year.”
29 March 2018
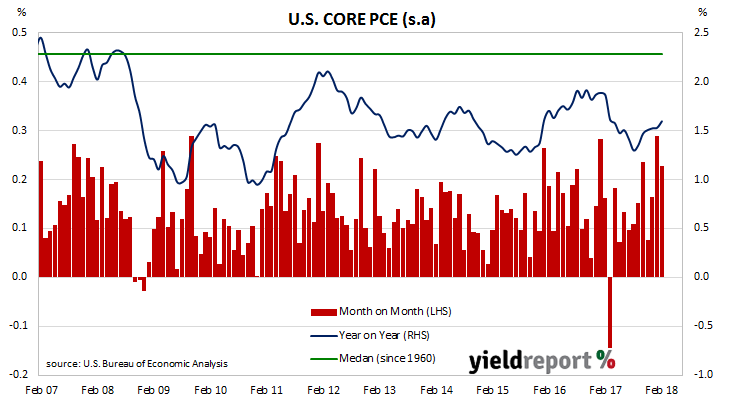
One of the U.S. Fed’s favoured measures of inflation is the change in core personal consumption expenditures (PCE). The core version of consumer spending strips out energy and food components, which are volatile from month to month, in an attempt to identify the prevailing trend. It’s not the only measure of inflation used; the Fed also tracks the Consumer Price Index (CPI) and Producer Price Index (PPI) from the Department of Labor.
The latest PCE figures have been published by the Bureau of Economic Analysis as part of the February figures for personal income and expenditures report. At 0.2% for the month, core PCE inflation was in line with the market’s expectation but lower than January’s 0.3% increase.
Annual core PCE inflation has been in range of 1.3% to 1.6% since March 2017. The latest reading for annual core PCE was 1.6%, thus at the top of this range and higher than January’s comparable figure of 1.5%.
29 March 2018
The pace of lending to the non-bank private sector by financial institutions in Australia remained stuck at just under 5% for the third month in a row. According to the latest RBA figures, private sector credit grew by 0.4% in February, up from the 0.3% growth rate recorded in January and more than the 0.3% consensus estimate. The year-to-February growth rate of 4.9% also remained unchanged from January’s figure of 4.9% as growth in home loans and business loans offset a slight fall in personal loan growth.
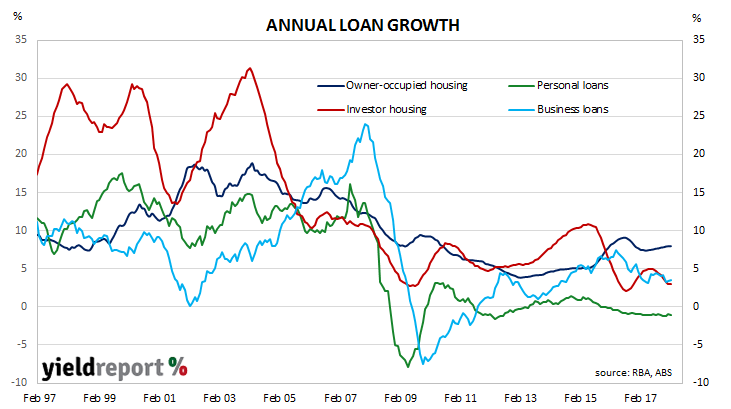
The overall increase was driven by owner-occupier loans, which increased by 0.6% over the month or 8.0% for the 12 months to February. Business credit growth of +0.1% reversed a 0.1% fall in January and its annual growth rate increased for the second month in a row, this time from 3.4% to 3.6%. These two segments of total lending account for nearly three-quarters of new loans by value and thus any change in them has a greater effect on overall credit growth.
27 March 2018
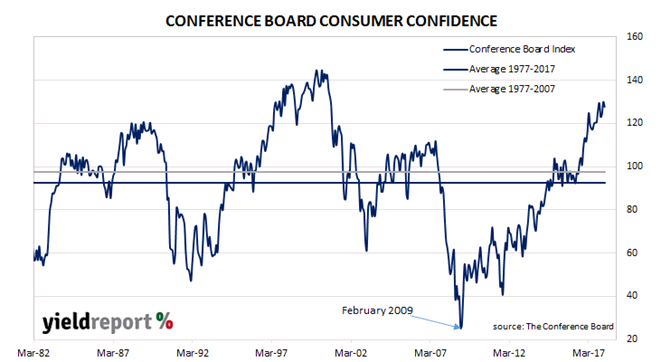
Consumer confidence surveys are important private sector surveys even though economists view them as lagging indicators. Their importance lies in the confirmation of spending patterns. As consumption in developed countries may amount to 60%-70% of GDP, knowing how it is behaving is important for forecasts of GDP growth rates, which in turn flow into credit growth and inflation rates.
The Conference Board index is one of two U.S. consumer sentiment indices, the other being the University of Michigan’s Consumer Sentiment Index. The Conference Board’s index is based on perceptions of current business and employment conditions, as well as expectations of business conditions, employment and income six months into the future.
The March reading of the Conference Board’s Consumer Confidence Index came in at 127.7, down from February’s revised reading of 130.0. The index was the result of a survey which ended on 15 March 2018 and it indicated U.S. households are still very optimistic on average. Lynn Franco, Director of Economic Indicators at The Conference Board said, “Consumer confidence declined moderately in March after reaching an 18-year high in February.” The primary driver was a lower assessment of current conditions “with business conditions the primary reason for the moderation.”
21 March 2018
Westpac and the Melbourne Institute describe their Leading Index as a composite measure which attempts to estimate the likely pace of economic activity relative to trend in Australia. The index combines certain economic variables which are thought to lead changes in economic growth into a single variable. This variable is claimed to be a reliable cyclical indicator for the Australian economy and an indicator of swings in Australia’s overall economic activity.
Since October, the Leading Index has returned values which implied above-trend growth in the near future. After a sharp drop in January, the six month annualised growth rate of the indicator bounced back almost completely from a revised +0.68% to +1.30%. These figures represent growth rates above trend GDP growth, which is generally thought to be around 2.75% per annum for Australia.
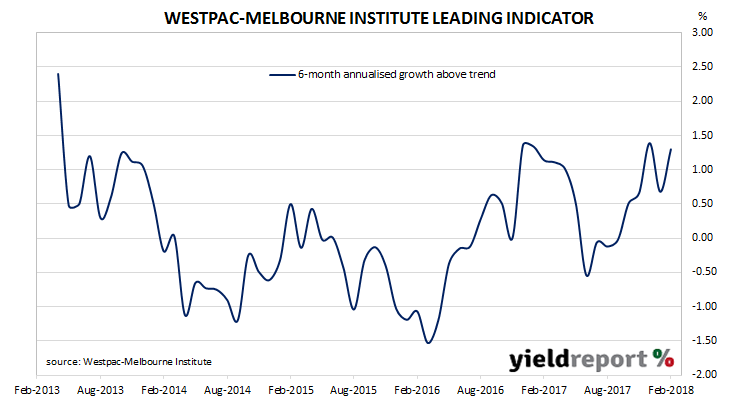
Westpac chief economist Bill Evans said international influences had a “disproportionate impact” on this latest reading. Higher commodity prices and increased U.S. industrial production accounted for 90% of the 130 basis points above trend, something the Westpac economist thought as disappointing since they are external to Australia.
Perhaps another way to look at the major influences on the model’s reading is to celebrate the depth of Australia’s integration in the global market. A less optimistic approach is acknowledging how little say Australia has in its economic destiny.
21 March 2018
It has been a little over two years since the U.S. Federal Reserve began raising its official interest rate, known as the federal funds rate. In December 2015, the U.S. Fed increased its target range of the overnight cash rate by 0.25%, moving it away from what was essentially a zero interest rate for overnight or borrowing and lending between banks.
Since then, there have been another three increases. The Fed paused through 2016 but, in March 2017, it increased its official rate by another 25bps and then followed with two more increases of the same magnitude over the course of the rest of that year. U.S. interest rates were being “normalised” after seven years of sitting at extraordinarily low levels.
Now there has just been another increase. As expected, the Federal Open Market Committee (FOMC) announced another 25bps increase to the target range, taking the range to 1.50% to 1.75%. The actual rate at which day-to-day lending between banks occurs in typically towards the middle of this range, at what is known as the “effective” rate.
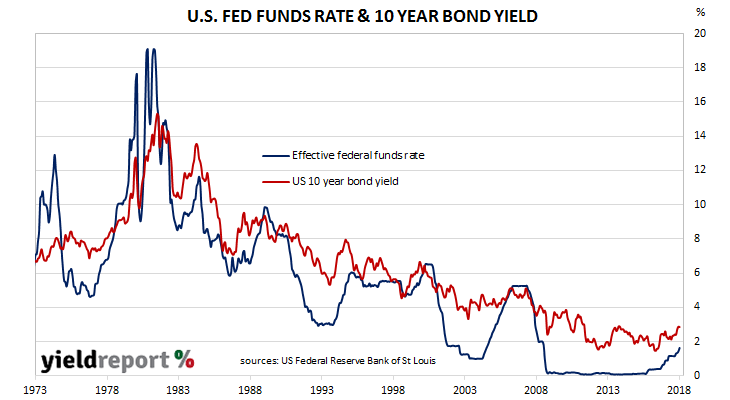
According to the FOMC statement, in recent months the “outlook has strengthened” and “job gains have been strong” while the annual inflation rate “is expected to move up in coming months.” However, the FOMC also noted household spending and business investment has recently “moderated from their strong fourth-quarter readings.”
20 March 2018
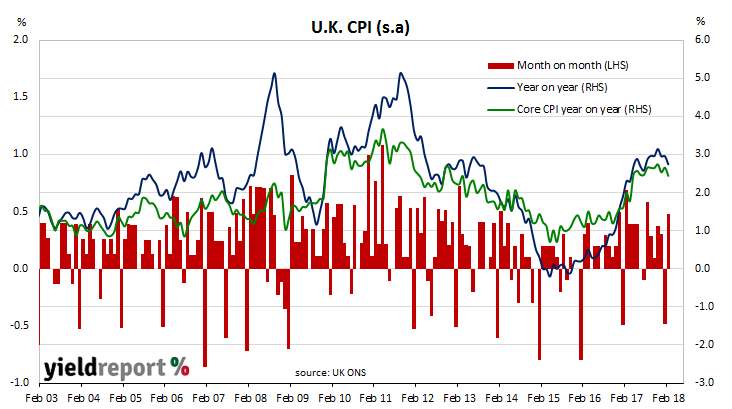
The U.K. has been one of the first countries to get inflation back to within its central bank’s stated target range of 2%-3%. Core inflation jumped back into the Bank of England’s preferred range in April 2017 and since then it has averaged 2.60%.
The annual rate of U.K. consumer inflation fell back in February as price increases of transport and food slowed. Consumer price index (CPI) figures released by the Office of National Statistics (ONS) indicated seasonally-adjusted consumer prices rose by 0.5% over the month, slightly under expectations and a complete reversal of January’s comparable figure of -0.5%. However, on a 12-month basis, the consumer inflation rate fell back from 3.0% to 2.5% (seasonally adjusted).
Bond markets reacted by sending gilt yields higher. ANZ’s Daniel Been noted this increase “despite core inflation dropping faster than anticipated.” 5 year yields increased by +6bps to 1.20% and 10 year yields increased by +4bps to 1.48%. In currency markets, sterling was lower against the USD but higher against the euro. However, markets may just be pre-positioning before the March FOMC meeting.