17 January 2018
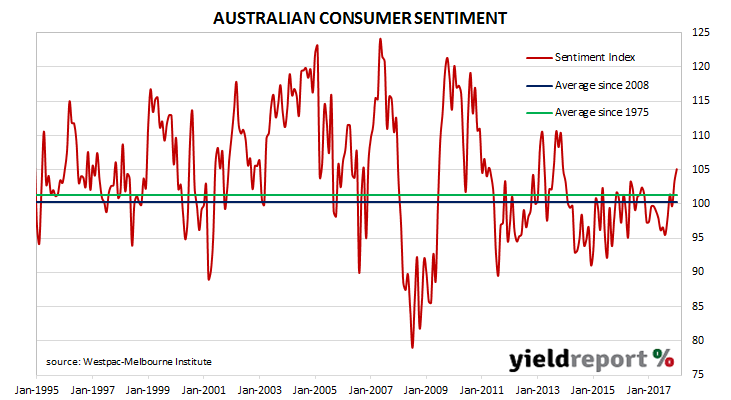
During most of the period between 2014 and 2017 there was a divergence between consumer sentiment and business confidence in Australia. Some economists explained the difference by a lack of wages growth; low wages growth is good for business in keeping costs down and margins up. However, households’ propensity to spend is hampered. Other explanations, such as households’ debt levels and the threat of higher mortgage rates have also been put forward.
After the December consumer survey was released, there was some talk of a turnaround and a possible alignment of the business and household sectors. The latest January survey has provided some support to this line of thinking. According to the latest Westpac-Melbourne Institute Consumer Sentiment Index, households were more optimistic than a month ago as the Index reading jumped from 103.3 in December to 105.1 in January. Any reading below 100 indicates the number of consumers who are pessimistic is greater than the number of consumers who are optimistic. The long-term average reading is just over 101.
15 January 2018
The Melbourne Institute’s Inflation Gauge is an attempt to replicate the ABS consumer price index (CPI) on a monthly basis instead of quarterly. It has turned out to be a reliable leading indicator of the CPI, although there are periods in which the Inflation Gauge series and the CPI have diverged, only for the two series to eventually converge over the space of six to twelve months.
During December, the Inflation Gauge increased by 0.1%, taking the annual rate to 2.3%. In November, the comparable figures were 0.2% and 2.7%.
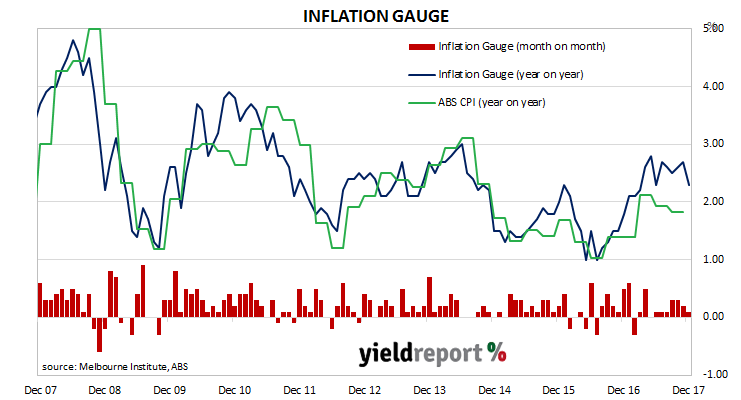
As a leading indicator, one would expect official CPI figures to follow the Melbourne Institute measure. Readers will note from the chart above how the Inflation Gauge has reversed direction in the past and one should not read too much into one month’s numbers. The Inflation Gauge’s annual rate also tends to overestimate changes in the CPI inflation by about 0.08%.
12 January 2018
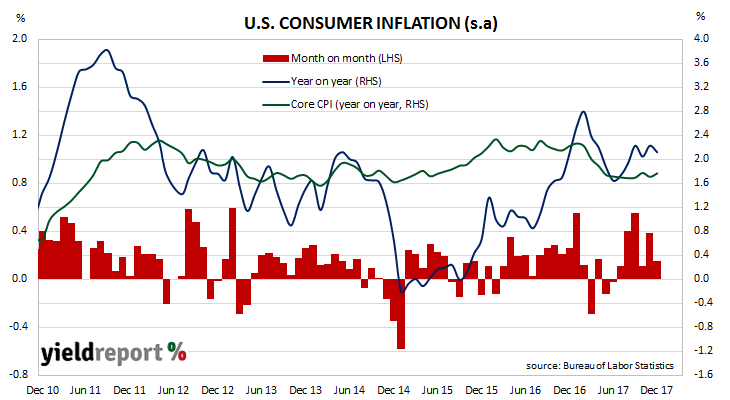
The U.S. consumer price index increased in December as “shelter” costs and vehicle prices of both new and used vehicles increased. Consumer price index (CPI) figures released by the Bureau of Labor Statistics indicated consumer prices rose by 0.1% in December, in line with market expectations of 0.1% but lower than November’s comparable figure of 0.4%. On a 12-month basis the consumer inflation rate eased back from November’s reading of 2.2% to 2.1%.
U.S. financial markets reacted by sending bond yields higher but the USD lower. 2 year bond yields increased by 4bps to 2.00% but yields at the long end were less affected and 10 year yields increased by just 1bp to 2.55%. The U.S. dollar was weaker against all other major currencies.
12 January 2018
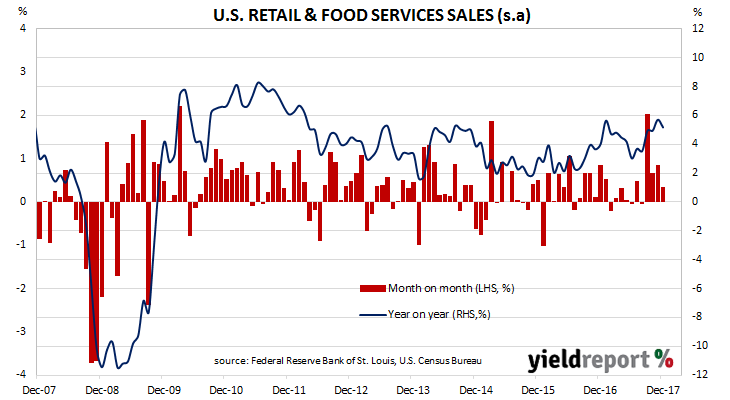
U.S. household spending has continued to register robust increases through December, driven by online purchases, building materials and garden equipment. According to the latest advance U.S. retail sales numbers released by the U.S. Census Bureau, retail sales increased by 0.4% for the month. The increase is below the expected figure of +0.5% and lower than November’s figure of +0.9%. On a yearly basis, the increase was 5.2%, down from November’s comparable figure of 5.7% (after revisions).
11 January 2018
Australians spent more money on making themselves and their homes more presentable according to the latest retail sales figures for November. Increased spending on household goods (furniture, floor coverings, kitchen items and textiles) and “recreational goods, toiletries and cosmetics” accounted for almost all of the overall increase in total retail sales during the month.
In particular, smartphone sales were said to be a major factor. An Australian Bureau of Statistics representative pointed to iPhones 10 sales “and the increasing popularity of promotions in November, including Black Friday sales” as an explanation for the surge.
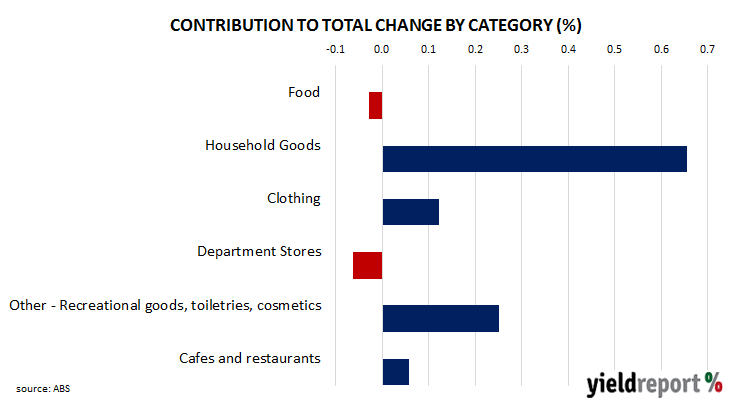 Total retail sales (seasonally adjusted) increased by 1.2% in November, after rising by 0.5% in October. On a year-on-year basis, sales grew by 2.9%, up from the 1.8% annual rate recorded in October. These latest figures mark the second month in a row in which the annual growth rate has accelerated.
The month-on-month increase was much more than the 0.4% increase which was expected and the Aussie dollar and bond yields jumped before easing off over the course of the day. 3 year bonds ended the day up 3bps at 2.18% and 10 year bonds finished 2bps higher at 2.74%. The local currency jumped from just above 78.40 U.S cents to as high as 78.80 U.S. cents before easing back to around 78.75 U.S cents.
09 January 2018
Aside from engineering and architectural design, one of the earliest requirements of a building project is to obtain approval from the relevant statutory body. As a result, building approvals data is a leading economic indicator of future construction. While not all projects which have been approved are completed, all completed projects will have been granted approval. Approvals data thus provides a useful indicator of future construction.
The latest building approval figures have been released by the Australian Bureau of Statistics and they indicate total approvals leapt in November. Compared to October, total November dwelling approvals were 11.7% higher (after revisions). On a 12 month basis, total approvals were 17.1% higher than in November 2016 (after revisions).

House approvals fell by 2.8% in November, which translates to a 1.2% rise over the previous 12 months. Apartment approvals are a lot more volatile (see chart below) and they jumped by 28.7% for the month and they were 5.8% higher than November of last year.
09 January 2018
ANZ’s job advertisement survey is well-known as a leading indicator of employment numbers in Australia. It reflects changes in demand for labour and it provides another measure of activity in the economy. There is also a fairly good inverse relationship between changes in Australia’s unemployment rates and changes in the RBA cash rate. Understanding the path of Australia’s unemployment rate has historically provided a reliable indicator of RBA rate changes.
December’s figures have been released and, after revisions, total advertisements were 2.3% lower at 167,656 (seasonally adjusted), down from November’s revised figure of 171,654. On a 12 month basis, job advertisements were 11.4% higher while November’s comparable figure was 12.0%.
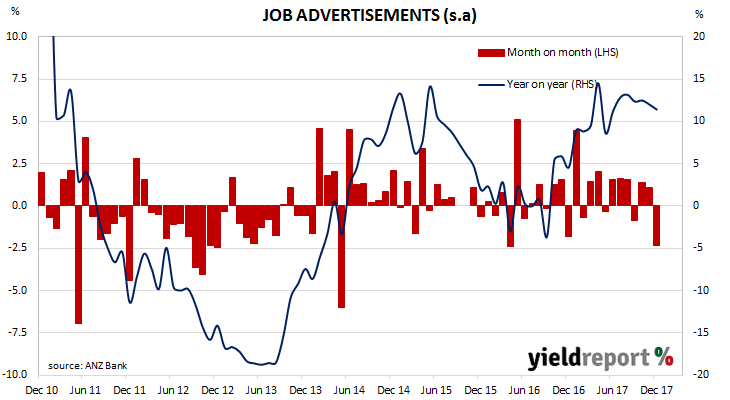 ANZ Head of Australian Economics David Plank was wary of being too confident of any particular interpretation of the numbers because of the time of year. “There can be considerable volatility around this time of year, however. For this reason we are not unduly worried around the drop in December job ads. We note, for instance, that job ads fell nearly 2% in December 2016 without signalling a turn in labour market conditions.” However, he said the figures could be interpreted as the start of some sort of slowdown. “Having said this, the easing in the trend pace of job ads growth in the fourth quarter lends support to our view that we may see a slowing in employment growth over the coming months.”
05 January 2018
There has not been a fall in U.S. non-farm employment since September 2010 and the latest figures for December have kept this trend intact. According to the U.S. Bureau of Labor Statistics, the U.S. economy gained 148,000 jobs in the non-farm sector in December, less than the (median) 190,000 expected and not enough to lower the unemployment rate.
Despite the miss, financial market reaction was muted and U.S. bond yields actually rose a little. The 2 year yield inched up 1bp to 1.96% while the 10 year yield gained 3bps to 2.48%. The U.S currency was slightly stronger against the euro and yen and almost unchanged against the pound. According to cash futures prices, the implied probability of a rate rise by the U.S. FOMC at its March meeting was unchanged at 67%.
Revisions to figures from November and October also had a mildly dampening effect. While November’s employment increase was revised up from +228,000 to +252,000, October’s number was revised down from +244,000 to +211,000.
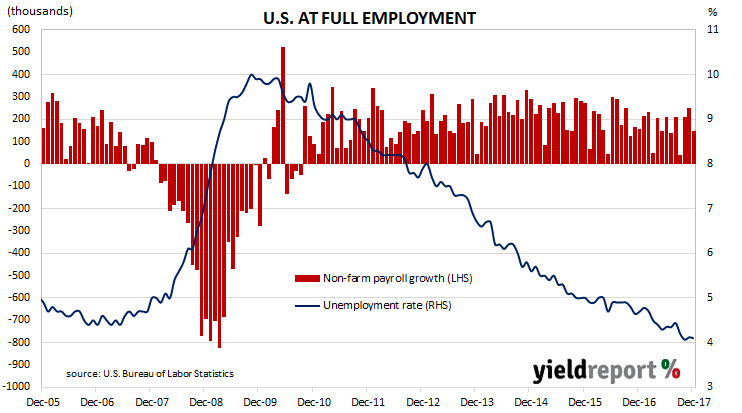
After the revisions, the unemployment rate remained unchanged at 4.1% even as 40,000 people either found work, retired or stopped looking for work. The participation rate remained unchanged at 62.7% for the third month in a row.
14 December 2017
The Australian economy has recorded another month of employment gains, with greater numbers of both full-time and part-time positions. The ABS released employment estimates for November which indicate the total number of people employed in Australia in either full-time or part-time work increased by 61,600. The figure was well in excess of the 19,000 expected.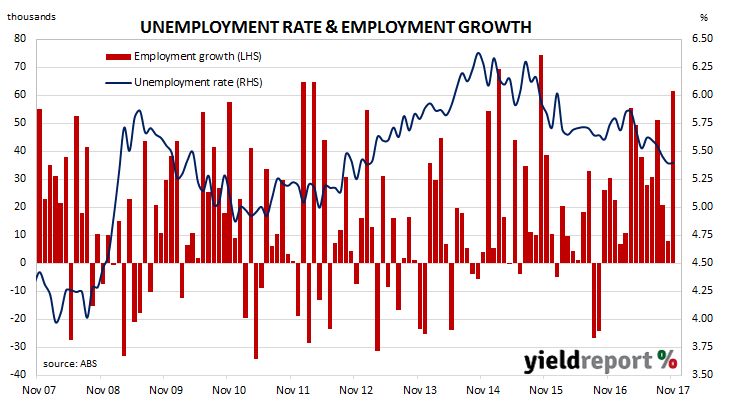
Bond yields had dropped prior to the report’s release, after yields had fallen in offshore markets overnight. However, once the figures were released at 11.30am, yields jumped, especially on 3 year bonds. By the end of the day, 3 year bond yields were 9bps higher at 2.09% and 10 year bond yields increased by 4bps to 2.59%. In the currency market the Aussie moved higher against the USD and finished around 76.60 U.S. cents.
The unemployment rate came in at 5.4%, the same as in October and the lowest rate since January 2013. Despite the large increase in employment, the unemployment rate remained unchanged as the participation rate jumped from a revised 65.2% to 65.5%.
13 December 2017
U.S. household spending has continued to power along in November, buoyed by online purchases and gas station sales. According to the latest advance U.S. retail sales numbers released by the U.S. Census Bureau, retail sales increased by 0.8% during November. The figure is in excess of the +0.3% expected and higher than October’s revised figure of +0.5%. On a yearly basis, the increase was 5.5%, up from October’s comparable figure of 4.8% (after revisions).

