30 October 2017
The pace of lending to the private sector by financial institutions in Australia has maintained its recent pace in September. Lending to home owners continued to be the main driver of loan growth while the rate of growth in lending to the business sector remained well below its long-term average.
According to the latest RBA figures, private sector credit grew by 0.3% in September, down from the 0.5% growth recorded in August. The year-to-September growth rate of 5.4% was on par with August’s comparable figure of 5.4% (after revisions), but this this figure is well below previous growth rates in the 1990s and 2000s (see chart below). Since 1990, the average annual growth rate of private sector loans in Australia has been a bit over 8%.
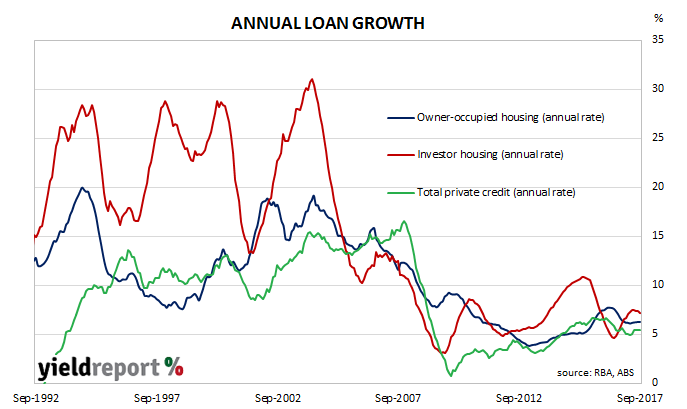
The overall increase was driven by owner-occupier loans, which increased by 0.5% over the month or 6.3% for the 12 months to September. Business credit only rose by 0.1% and its annual growth rate dropped back from August’s 4.4% to 4.3% in September (after revisions). These two types of lending account for nearly three-quarters of new loans by value and thus any change in them has a greater effect in overall credit growth. However, investor loans have been growing at a faster rate since 1990 and this segment has become a larger part of overall lending.
27 October 2017
Usually U.S. GDP figures garner a fair amount of attention but the latest set of GDP figures were released by the U.S. Commerce Department with little in the way of commentary. Third quarter 2017 “advance” estimates of U.S. GDP became public on Friday night Australian time. They indicated U.S. GDP grew at annualised rate of 3.0%, well above the median market estimate of 2.6% but just a little short of the second quarter’s 3.1%. Advance estimates are the first of four and they are subject to three more revisions over the next two months.
While the numbers were higher than expected, bond yields fell and the USD weakened against other major currencies. NAB Head of FX Strategy Ray Attrill said the figures were vaguely misleading because of the effect of higher inventories. “Growth was somewhat flattered by a 0.7% contribution from inventories, though personal consumption expenditure grew at [a] 2.4% annualised pace in Q3, a little stronger than the 2.1% expected.”
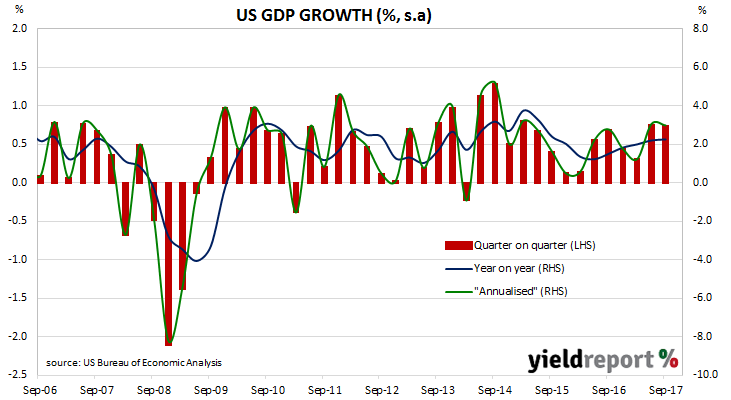
U.S. GDP numbers are published in a manner which is different to most other countries; quarterly figures are compounded to give an annualised figure. In countries such as Australia and the UK, an annual figure is calculated by taking the latest number and comparing it with a figure from a year ago. The diagram below shows U.S. GDP once it has been expressed in the normal manner.
26 October 2017
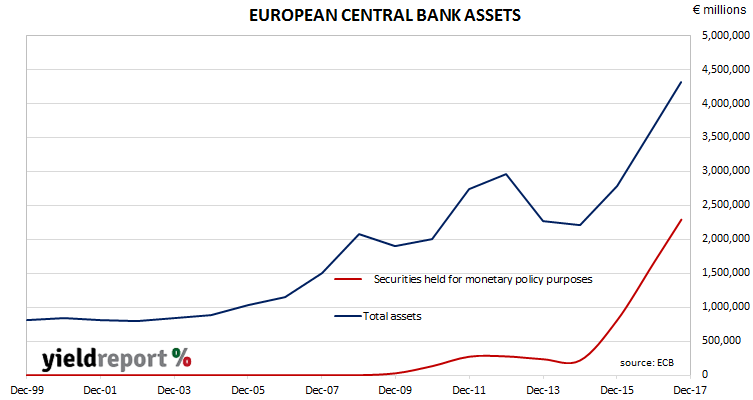
The ECB has announced it will begin a reduction in its asset purchase programme (APP) in 2018. The decision has been expected since hints were dropped by various ECB officials around the middle of this year. Even so, the announcement was viewed as particularly dovish and German, U.K and French bond yields fell while the euro fell against major currencies.
The Governing Council of the ECB will reduce the pace of bond purchases from €60 billion per month to €30 billion per month, starting in January 2018. The ECB will buy €30 billion per month “until the end of September 2018, or beyond, if necessary” until the ECB believes the path of the inflation rate is consistent with its inflation goals.
Maturing securities held by the ECB will be re-invested for “an extended period of time after the end of its net asset purchases”. This means the balance sheet of the ECB will keep growing until the purchase programme ceases. However, the end of the programme does not mean the ECB’s balance sheet will shrink; it will not begin shrinking until the ECB follows the U.S. Fed’s actions and begins to reduce the pace of bond reinvestments as its bond holdings mature.
The ECB programme is just one part of the central bank’s two-pronged strategy. The other prong is its interest rate policy. Central banks around the world set an interest rate at which banks in its jurisdiction can borrow and lend from each other. In Australia, the RBA has its “cash rate” and the U.S Fed has its “federal funds rate”. The ECB rate is referred to as the “deposit rate”. These official interest rates influence other interest rates in the respective economies and thus affect behaviour of borrowers and lenders.
Currently the ECB’s deposit rate -0.40%. In case readers are baffled by a negative interest rate, it means banks with deposits at the ECB pay interest to the ECB for holding their money. The ECB’s negative interest rate policy will continue unchanged at their present levels “for an extended period of time, and well past the horizon of the net asset purchases.”
26 October 2017
China’s Ministry of Finance has announced it plans to issue $2 billion worth of bonds denominated in U.S. dollars. The proposed bond issue will be made in Hong Kong and it will comprise an equal amount of five year bonds and ten year bonds.
The People’s Bank of China reportedly “encouraged” Chinese banks in January this year to issue more U.S-denominated debt when raising funds. Some commentators saw this move as a response to a significant fall in Chinese foreign exchange reserves during the latter part of 2016. This latest move by the Ministry of Finance would appear to be consistent with the PBoC’s earlier directive.
source: TradingEconomics.com, PBoC
The Chinese Government already has around USD$18 billion of U.S. dollar bonds on issue, as well as some euro-denominated debt but these amounts are tiny in comparison with the Chinese Government’s total outstanding debt. According to a Ministry of Finance official, the purpose behind the bond issue was to “guide markets and evaluate prospects in the future”.
It would seem as if the PBoC plans to acclimatise international markets to USD-denominated Chinese debt, as this latest bond issue would be the first since 2004. It raises several questions. Is it a precautionary move in case domestic demand for Chinese Government debt dries up? Or is it simply part of a plan to broaden the appeal of Chinese Government debt to international investors? A more conspiratorial explanation suggests such a move may be the beginning of “synthetic” reduction of its U.S. treasury bond exposure without actually selling U.S bonds.
According to the U.S. Department of the Treasury, at the end of September Chinese interests held USD$1.2 trillion treasury bonds and notes, while Hong Kong interests held another USD$200 billion.
25 October 2017
For the greater part of the last decade, inflation rates in advanced economies have been low. In fact, inflation rates have been so low central banks of countries from around the world have expressed a desire for higher inflation rates. Currently, there is little sign of inflation in Australia moving to a higher range.
Figures for the September quarter have now been released by the ABS. The headline number was weaker than the expected 0.80%, as were seasonally-adjusted and core inflation figures. Unadjusted inflation was 0.60% for the quarter while seasonally-adjusted inflation came in at 0.40%. On a 12-month basis, each recorded 1.80%, down from the June quarter’s comparable figures of 1.90% for each measure.
Bond yields fell, especially at the short end. 3 year yields fell 5bps to 2.08% while 10 year bond yields slipped just 1bp to 2.79%. The AUD dropped around 0.30 U.S. cents on the news and then trended down to around 77 U.S. cents late in the day. Prior to the report’s release, the probability of a second RBA increase in November 2018 was around 40%. Afterwards, cash futures prices implied no second rate increase.
“Core” inflation measures favoured by the RBA, such as average of the “trimmed mean” and the “weighted median”, were in line with the market’s expected figure 0.40% for the quarter and 1.90% for the year.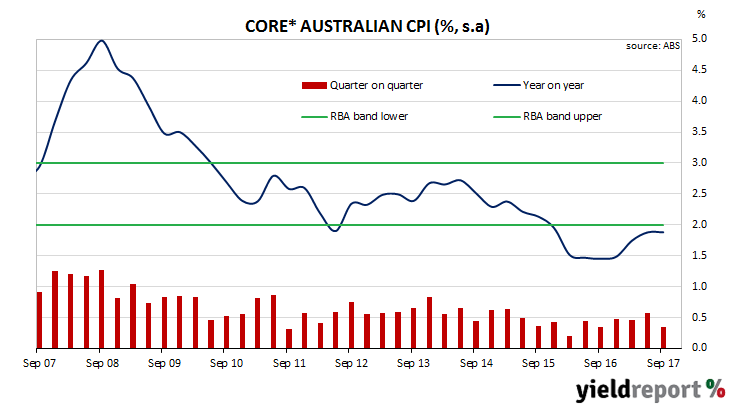
* Average of Trimmed Mean & Weighted Median measures
19 October 2017
The Australian economy has recorded another solid month of employment gains, although part-time positions accounted for the majority of the gain. The ABS released employment estimates for September and the total number of people employed in Australia in either full-time or part-time work increased by 19,800. This figure exceeded the market’s median expectation of 15,000 new positions.
Bond yields fell just prior to the release of the figures but they quickly gained 2bps in the next thirty minutes or so. By the end of the day, 3 year bond yields had increased from 2.10% to 2.14% and 10 year bond yields had added 4bps to 2.79%. In the currency market the Aussie initially shot up against the USD but then slipped back to finish marginally higher at around 78.55 U.S. cents.
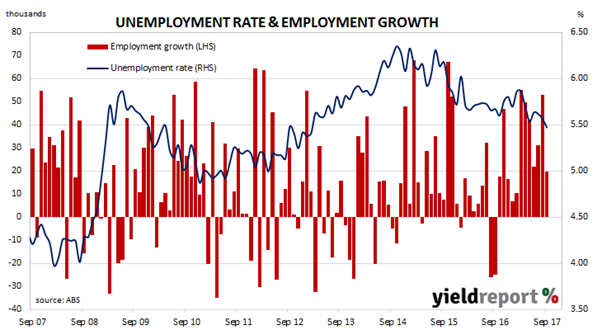
The unemployment rate came in at 5.5%, a fall from August’s unemployment rate of 5.6% and the lowest rate since February 2013. September is the first month in almost a year where employment growth exceeded growth in the available workforce who wish to work. A year ago the participation rate was 64.4%; at the end of September it was at 65.2% and not all that far away from its all-time peak of 65.8% which was reached in February 2009.
The total number of work hours across the whole economy increased by 0.7% when compared to August, as 6,100 more full-time jobs and 13,700 part-time jobs were created. On a 12 month basis aggregate hours worked grew by 3.4% as 315,900 full-time and 55,600 part-time positions were created.
18 October 2017
Westpac and the Melbourne Institute describe their Leading Index as a composite measure which attempts to estimate the likely pace of economic activity relative to trend in Australia. The index combines certain economic variables which are thought to lead changes in economic growth into a single measure which is claimed to be a reliable cyclical indicator for the Australian economy and a “critical” indicator of swings in Australia’s overall economic activity.
For the last four months, the Leading Index has returned values which imply below-trend growth. September’s reading returned a value of -0.21%, a modest decline from August’s revised reading of -0.16% (revised up from -0.19%).
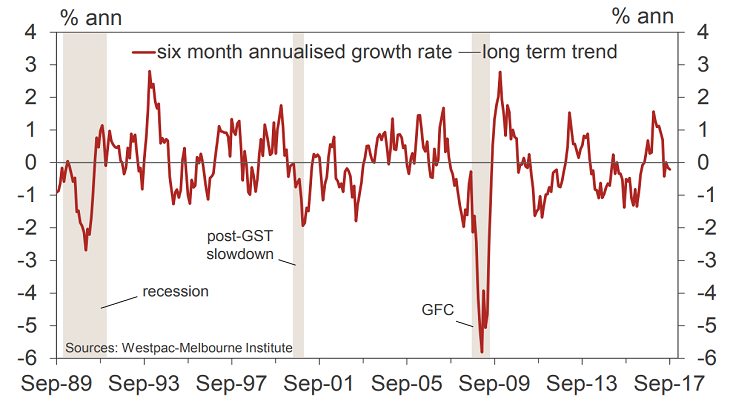
According to Westpac chief economist Bill Evans, a deterioration in conditions since April has been driven in the main by two factors. Commodity prices have fallen, which means Australian exporters are likely to earn less income as shipments and payments are made on contracts in the period.
The other driving force has been the fall in the S&P/ASX200 index from 5924 at the end of April to 5681 at the end of September. Share prices are thought to have leading indicator properties, although “they are much more volatile than the real economy and might provide false signals about economic growth.”*
Evans thinks the RBA is currently primed to raise rates next year based on its forecast for Australian economic growth in 2018. However, he thinks the RBA Board will change its mind as information becomes available. “We assess that the Bank, with a much more optimistic outlook for the economy than Westpac, expects to be increasing rates. However the developments in the economy which we anticipate are likely to lead the Bank to revise its view and keep rates on hold.”
Bond yields fell on the day but generally reactions from various markets was unremarkable. The 3 year bond yield slipped 2bp to 2.10% and the 10 year yield lost 4bps to 2.75%. The Australian dollar was essentially unchanged against the U.S. dollar and the euro.
*Stock Prices and Economic Growth, European Central Bank, October 2012
17 October 2017
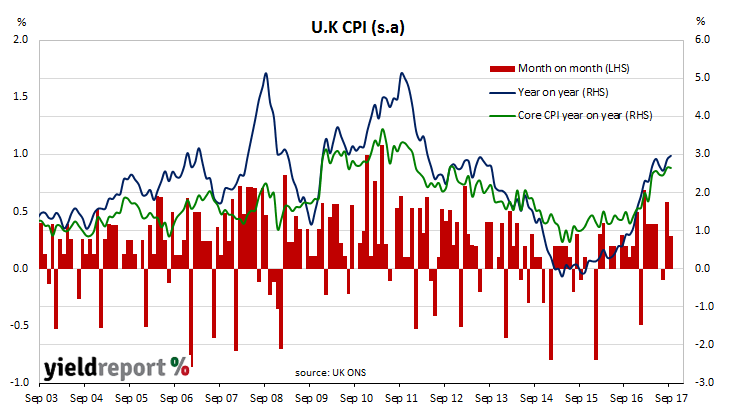
U.K. inflation in September has recorded the highest rate since April 2012 and it is another symptom of an economy which no longer requires ultra-low interest rates. The latest consumer price index (CPI) data from the Office of National Statistics indicated the consumer inflation rate was 0.3% in September, down from August’s 0.6% but in line with market expectations. Core consumer price inflation was also +0.3% for the month.
On an annual basis consumer inflation increased from an annual rate of 2.9% in August to 3.0% in September. Annual “core” consumer price inflation dropped back from +2.7% in August to 2.6%, although the difference was essentially due to rounding.
U.K financial markets reacted by sending bond yields lower. Both 5 year and 10 year gilt yields each fell 6bps to 0.72% to 1.28% respectively. Sterling finished the day weaker against both the USD and euro.
17 October 2017
The minutes of the RBA’s October meeting were not expected to be a source of controversy and so it proved when they were released. However, some economists spotted a few of interesting titbits.
Deutsche Bank economist Phil Odonaghoe thought the minutes revealed a divergence in thinking between the RBA and market pricing for short-term interest rates. “We wrote in response to the RBA’s October post-meeting statement that, from the perspective of market pricing, the lack of a more hawkish tone in the statement suggested that the Australian front-end might have gotten a little ahead of itself when it comes to the 2018 outlook. From the minutes released today, it appears the Bank may be seeking to reinforce this view.”
ANZ Head of Australian Economics David Plank highlighted the RBA’s change in language regarding the exchange rate. “For some time the RBA has highlighted that a higher AUD could dampen the outlook for growth and inflation. The Bank has now qualified the required change in the AUD to be a ‘material’ further rise. We think this evolution implies a greater degree of comfort with the gain in the AUD to date.”
Westpac chief economist Bill Evans found it interesting the RBA Board needed to state certain things for the record. “We have always argued that the policy process next year will be dependent on the strength of the domestic economy and not be dictated by any global trend to higher interest rates. It is interesting that the Board has chosen to emphasise this strategy in its minutes.”
Financial markets were largely unmoved. 2 year bonds and 10 year bonds each added 1bps to 2.12% and 2.79% respectively while the Aussie dollar was relatively unchanged against the greenback.
13 October 2017
Higher fuel prices have driven U.S. consumer inflation higher in September but less than by what economists had expected. Consumer price index (CPI) figures released by the Bureau of Labor Statistics indicated prices rose by 0.5% in September, just short of the market expectations of a 0.6% increase. On a 12-month basis the consumer inflation rate increased from August’s 1.9% to 2.2%.
Fuel prices accounted for over 80% of the higher CPI. Core prices, a measure of prices which strips out food and energy price changes, rose by 0.1%, a fall from August’s figure of 0.2%. Both the monthly and 12 month core figures were 0.1% under expectations. Annualised core inflation remained steady at 1.7% for a fifth month in a row.

U.S 2 year yields inched down 1bp to 1.50% while 10 year yields dropped by 4bps to 2.28% and the U.S. dollar was weaker against the pound and yen but steady against the euro.

