03 October 2017
ANZ’s job advertisement survey is well-known as a leading indicator of employment numbers in Australia. It reflects changes in demand for labour and it provides another measure of activity in the economy. There is also a fairly good inverse relationship between changes in Australia’s unemployment rates and changes in the RBA cash rate. Understanding the path of Australia’s unemployment rate has historically provided a reliable indicator of RBA rate changes.
Figures for September have been released and, after revisions, total advertisements were effectively unchanged at 180,700 (seasonally adjusted), slightly down from August’s revised figure of 180,786. On a 12 month basis, job advertisements were 12.5% higher, a fall from August’s comparable figure of 13.3%.

The inverse relationship between job advertisements and the unemployment rate is quite strong (see below chart). An increasing number of job advertisements as a proportion of the labour force should lead to lower unemployment rates.
03 October 2017
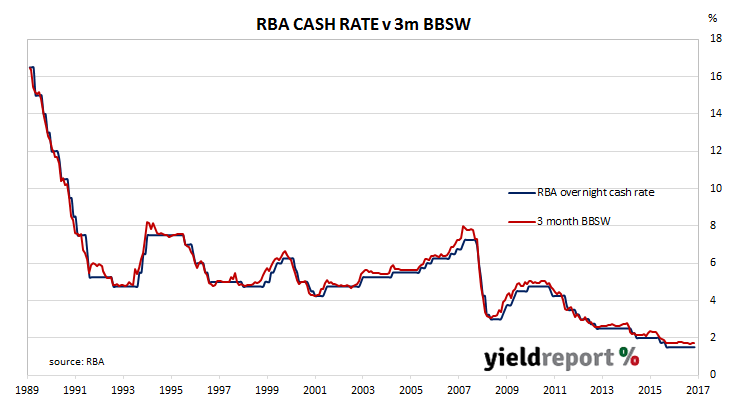
The October meeting of the RBA Board is not one of the four months of the year traditionally associated with RBA rate changes. The months in which many rate changes have been made are February, May, August and November. The rationale put forward by economists is these are the months which follow the quarterly releases of CPI figures which may indicate growing inflation pressures.
At the moment there are few signs of growing inflation in Australia, although the latest Melbourne Institute inflation figures may prove to be one of them. So it was not a surprise the RBA kept the official cash rate at 1.50%. Prices of cash futures contracts prior to the meeting had implied a near-zero chance of a move by the central bank, so any other result would have been a great shock.
The statement which accompanied the decision is essentially the same as September’s statement and economists generally viewed it as indicating the RBA is still in a neutral position. While the RBA currently views the outlook for the global economy as positive for the domestic economy, domestic consumer spending and household debt appear to be concerns for the Bank. Employment growth is expected, but not enough to do anything other than “gradually” lower the unemployment rate “over the next couple of years.” As far as the RBA is concerned, the pros and the cons are roughly balanced at the moment.
02 October 2017
The Melbourne Institute’s Inflation Gauge is an attempt to replicate the ABS consumer price index (CPI) on a monthly basis instead of quarterly. It has turned out to be a reliable leading indicator of the CPI, although there are periods in which the Inflation Gauge series and the CPI have diverged, only for the two series to eventually converge over the space of six to twelve months.
During September, the Inflation Gauge increased by 0.30%, which translates to 2.50% higher than a year ago. Core measures of inflation, such as the Melbourne Institute’s version of the ABS “trimmed mean” measure, also increased by 0.10% for the month or 2.50% on an annualised basis.

29 September 2017
One of the US Fed’s favoured measures of inflation is core personal consumption expenditure (PCE). The core version of consumer spending strips out energy and food components, which are volatile from month to month, in an attempt to identify the prevailing trend. It’s not the only measure of inflation used; the Fed also tracks the Consumer Price Index (CPI) and Producer Price Index (PPI) from the Department of Labor.
The latest core PCE figures have been published by the Bureau of Economic Analysis as part of August figures for personal income and expenditures. At 0.1% for the month, the numbers were below the market’s expectation of +0.2%. On an annual basis, core PCE increased by 1.3% which was lower than July’s comparable annual figure of 1.4% which in turn was lower than June’s 1.5%.

29 September 2017
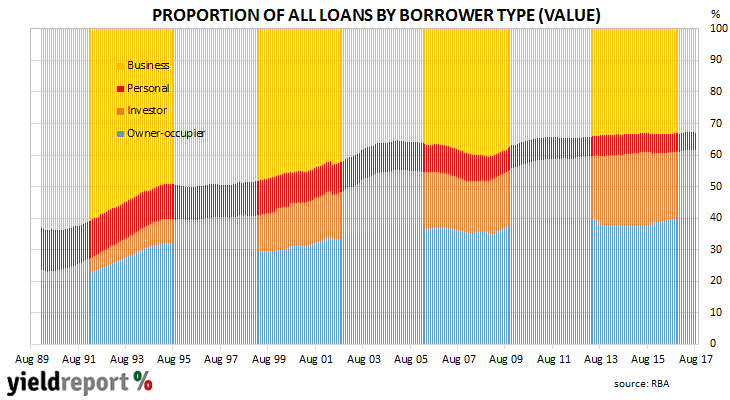
The pace of lending to the private sector by financial institutions in Australia remained at a subdued level in August. The rate of growth in lending to the business sector remained well below its long-term average while lending to home owners continued to be the main driver of loan growth.
According to the latest RBA figures, private sector credit grew by 0.5% for the second month in a row and in line with the market consensus figure. The year-to-August growth rate of 5.4% was slightly higher than July’s comparable figure of 5.4% (after revisions). Since 1990, the average annual growth rate of private sector loans in Australia has been a bit over 8%.
The overall increase was driven by owner-occupier loans, which increased by 0.5% over the month or 6.3% for the 12 months to August. Business credit also rose by 0.5% but its annual growth rate picked up from July’s 4.2% to 4.5% in August. These two types of lending account for most loans by value and thus any change in them has a greater effect in overall credit growth. However, investor loans have grown at an annual rate of nearly 16% since 1990 and this segment has become a larger part of overall lending (see chart below) since then.
Growth in investor loans was unchanged at 0.4%. On an annual basis, this segment of private credit grew by 7.3%, down from the 7.4% annual rate at which loan balances of this type grew in May, June and July.
28 September 2017
Canadian bond issuers have been active in the kangaroo market for some years. The Province of Ontoria issued AUD-denominated bonds just over a week ago while other Canadian government Province of Manitoba and Province of British Columbia are also regular issuers in the market. Banks such as Toronto Dominion and the Canadian Imperial Bank of Commerce each raise funds in the Australian market from time to time.
Another Canadian is about to join them. Bank of Montreal, part of the BMO Financial Group, has announced it has just launched its inaugural kangaroo bond transaction. Westpac is the joint lead manager and bonds will be issued in one or more tranches which will be either fixed or floating or both. Initial guidance for the deal was 95bps over each tranche’s respective swap rates.
It already has bonds denominated in U.S. dollars, euros and sterling and the Canadian loonie, of course. Soon Aussie dollars will be added to the list.
Group revenue was in the order of USD$19 billion in 2016 while total assets amounted to around USD$500 billion, so it is not much smaller than the major banks in Australia. (For instance, ANZ Group has assets of around USD$730 billion). Bank of Montreal senior debt is rated A+ by S&P and A1 by Moody’s.
26 September 2017
Soon, hybrid investors will have an alternative to direct investment in ASX-listed hybrids. BetaShares plans to launch an exchange-traded fund (ETF) which will invest in a diversified portfolio of hybrid securities. As such the fund will provide a level of diversification which may elude individual investors who buy individual hybrid securities.
The new ETF will be actively managed by Coolabah Capital Investments and it will comprise hybrid securities, bonds and cash or any combination of these assets. Distributions may include imputation credits and they will be paid monthly.
It will be an actively-managed ETF and thus the management expense ratio (MER) will be higher than a standard index ETF. Management fees will be charged at 45bps per annum and there will also be a performance fee equal to 15% of any return achieved over an as-yet unspecified benchmark.
The new hybrid ETF will be the latest of several new ETFs offered in the cash and bond segment in 2017. In the last few months, bond ETF providers have focused on ETFs which comprise floating rate assets such as the VanEck Vectors Australian Floating Rate ETF (ASX code: FLOT) and the BetaShares Australian Bank Senior Floating Rate Bond ETF (ASX code: QPON). The reasons for this are obvious. Firstly, there were no floating rate bond ETFs listed in Australia and secondly, demand for floating rate alternatives has been keen.
The new ETF will trade under the ASX code “HBRD” but details at this stage are scarce. A full listing of existing cash and bond ETFs can be found in our ETF table here.
25 September 2017
For those readers who wished to subscribe for the soon-to-be-listed ANZ Capital Notes 5 (ASX code: ANZPH but missed out, the fixed interest desk at Bell Potter have a “Plan B” for you. Analyst Damien Potter said the best time to get set is in the early days of trading on the ASX.
He looked at nine hybrid listings from issuers which comprised banks and other financial institutions over the past eighteen months. His analysis of trading data suggested the presence of a temporary window for investors which arose as some investors sold out in the early days of trading. “Typically new ASX-listed debt and hybrid issues take several trading sessions to clear any initial selling pressure.”
While paying transaction costs and a premium to face value was not ideal from an investor’s perspective, selling pressure (supply) kept the price of the hybrid from appreciating much in this period. According to Williamson the price rose an average of 0.2% from the closing price on the first day of trading. However, after the seven trading days he said selling pressure typically dried up “and on average the security price peak is 1.9% above the price at the end of the digestion period.”
The message? Make your decision early. If you are going to act, then act. Sooner is better than later.
Readers interested in ANZ hybrids or hybrids in general can make comparisons using YieldReport’s charts and tables which can be found here.
22 September 2017
While not the usual thing YieldReport publishes, this report was worthy of a wry smile.
Apparently, 500 euro notes were found at a UBS bank branch in Geneva in one of the washrooms (toilets). Not just one or two; lots of them. The reports said the bathroom is close to the safe deposit vault but whether this detail is of any consequence is unknown.
A few days later more notes were found in toilets of nearby restaurants. Some had been cut with scissors but they were otherwise described as “soiled”. Some people like to light their cigars with bank notes as an act of decadence. Were the notes “used” in an act of decadence? Or in desperation? In any case, the notes had clogged the pipes. Perhaps it was just a case of someone flush with cash.
Swiss police are investigating. They said the whole thing smells funny.
21 September 2017
Most bond markets around the world did not have much to focus on this week except for the Federal Open Markets Committee (FOMC) September meeting. No change was expected to be made to the federal funds rate but a statement regarding the reduction of the Fed’s balance sheet was anticipated.
As it turned out, the market got what it expected. There was no change to the official rate and, in October, the Fed will begin its balance sheet normalisation programme. It will reduce its re-investment of mature Treasury bonds securities by USD$6 billion per month and of mature mortgage-backed securities by $4 billion per month. Every three months, these amounts will be increased by additional USD$6 billion and $4 billion per month respectively until the Fed’s holdings of Treasury bonds are being wound down by a maximum of USD$30 billion per month and its holdings of mortgage-backed securities are being wound down by a maximum of USD$20 billion per month.
While this may sound like a lot, the U.S Fed increased its balance sheet from around USD$800 billion in 2007 to the current USD$4.5 trillion by purchasing Treasury bonds and asset-backed securities. At USD$50 billion per month, a lot of months will be needed to shrink the Fed’s balance sheet back to 2007 levels.
There has been some opposition to such a plan. In January, former Fed chief Ben Bernanke wrote a piece for the Brookings Institute in which he estimated the optimal size of the balance sheet is currently “greater than $2.5 trillion and may reach $4 trillion or more over the next decade.” He said the U.S. economy is “growing into” the Fed’s $4.5 trillion balance sheet, “reducing the need for rapid shrinkage over the next few years.” He is probably not the only person who would like to avoid a reduction in the amount of base money in the U.S. banking system.

