12 September 2017
Central banks in advanced economies around the globe have been trying to manage inflation rates up for some years now. Despite the destructive nature of inflation on savings, central banks have stated their preference for inflation to be around 2% to 3%.
The Bank of England will undoubtedly be pleased now. According to the latest consumer price index figures from the U.K’s Office of National Statistics, consumer prices increased by 0.6% in August or by 2.9% in the previous year. July’s comparable figures were -0.1% and 2.6%.
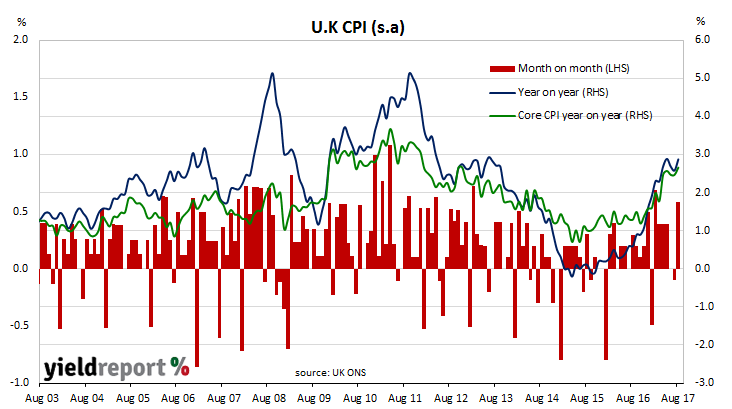
Economists had expected a 0.4% increase or 2.8% for the year on the back of a weaker exchange rate but the figures seemed to catch financial markets by surprise. Sterling rose against other currencies, U.K 10 year gilts jumped by 9bps on the day and the odds of a rate rise by February increased significantly.
08 September 2017
The Australian Bureau of Statistics (ABS) collects data on housing finance commitments made by significant lenders and their figures include secured (mortgage) finance commitments for the construction or purchase of owner-occupied dwellings and investment properties. It has some overlap with the RBA’s monthly private sector credit statistics which also includes investor lending and owner-occupier lending.
The ABS has released housing finance figures for July and the figures indicate the number of owner-occupier approvals rose by 2.9% over the month and by 3.3% when compared to July 2016. Excluding refinancing, the number of approvals was 4.5% more than June and 14.8% higher than a year ago. These figures were largely in line with market expectations.

In dollar terms, owner-occupier loan approvals increased by 0.9% in July, an increase on June’s 0.6% rise and just below the markets expectation of +1%. Compared to July 2016 loans of this type were 5.8% higher. Investor loans contracted by 3.9% in July but compared to 12 months ago they were just 0.1% lower, which was quite a drop from June’s year-on-year figure of 6.0%. The value of total loan approvals excluding refinancing was 8.7% higher than comparable figures from July 2016 and comfortably under the 10% maximum housing credit growth rate designated by APRA.
Westpac economist Simon Murray thought the report indicated success for APRA’s goal of dampening investor borrowing. “Overall, the numbers suggest that financing for owner-occupiers mid-year was well supported with first home buyers getting more of a foot in to the housing market. In addition, there are further signs that macro-prudential measures are slowing investor activity.”
07 September 2017
Australian consumer spending stalled in July, amid concerns households may be restricting spending in the face of high debt levels and stagnating wages. According to the ABS, retail sales figures recorded zero growth while the market had expected growth of +0.2%.
Bond yields largely ignored the soft data and followed offshore leads to finish the day higher. Yields on 3 year and 10 year bonds both increased by 4bps higher at 2.01% and 2.64% respectively while the local currency dropped from 80.10 U.S. cents to 79.80 U.S. cents during afternoon trading.
The growth figure was down from June’s growth rate of +0.2% and May’s growth rate of +0.6%. On a year-on-year basis, retail sales grew by 3.6%, down from the 3.7% annual rate recorded in June. This makes July the third month in a row where the growth rate has fallen.
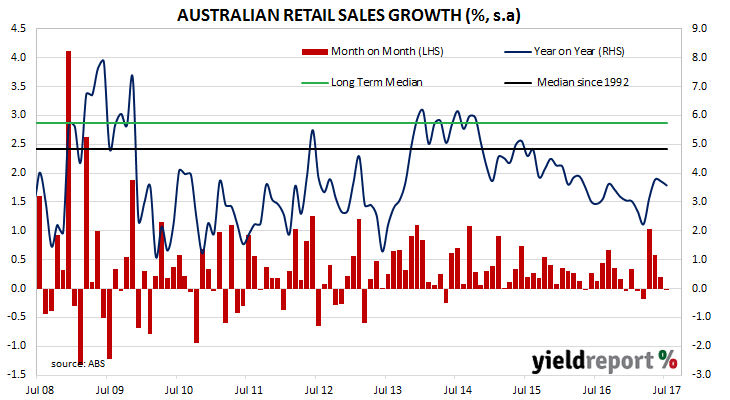
ANZ senior economist Jo Masters pointed out retail “sectors exposed to international competition struggled”. She also noted a lot of the weakness originated from NSW even though other states, such as Victoria and Queensland, recorded “robust” increases. However, regardless of state, household spending was at the mercy of stagnant incomes and high debt levels. “Softening retail sales is consistent with our view that households will struggle to sustain consumption growth above income growth, particularly given weak wage growth and high levels of household debt and we continue to see the consumer as a key risk to the economic outlook.”
04 September 2017
The Melbourne Institute’s Inflation Gauge is an attempt to replicate the ABS consumer price index (CPI) on a monthly basis instead of quarterly. It has turned out to be a reliable leading indicator of the CPI, although there are periods in which the Inflation Gauge series and the CPI have diverged, only for the two series to eventually converge over the space of six to twelve months.
During August, the Inflation Gauge increased by 0.10%, which translates to 2.60% higher than a year ago. Core measures of inflation, such as the Melbourne Institute’s version of the ABS “trimmed mean” measure, increased by 0.10% for the month or 2.50% on an annualised basis.
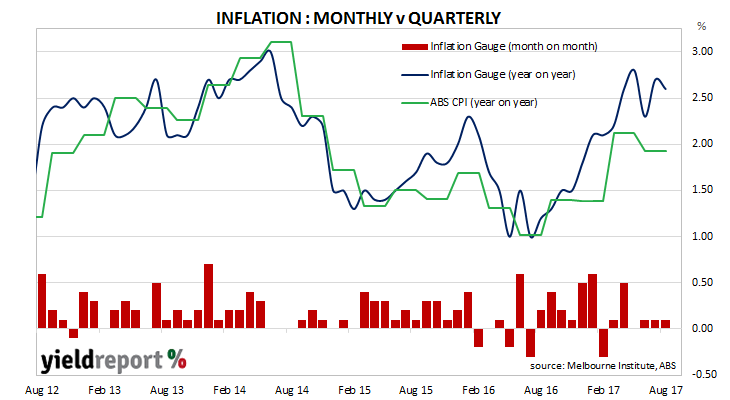
As a leading indicator, one would expect official CPI figures to follow the Melbourne Institute measure. Readers will note from the chart above how the Inflation Gauge has reversed direction in the past and one should not read too much into one month’s numbers.
Goldman Sachs chief economist Andrew Boak thought this latest reading was confirmation of higher official CPI figures to come. “The release confirms the recent pick-up in annual inflation rates and we continue to expect CPI inflation to pick up in third quarter of 2017, in part due to higher utilities prices.”
04 September 2017
ANZ’s job advertisement survey is well-known as a leading indicator of employment numbers in Australia. It reflects changes in demand for labour and it provides another measure of activity in the economy. There is also a fairly good inverse relationship between changes in Australia’s unemployment rates and changes in the RBA cash rate. Understanding the path of Australia’s unemployment rate has historically provided a reliable indicator of RBA rate changes.
Figures for August have been released and, after revisions, total advertisements rose by 2.0% to 181,435 (seasonally adjusted), up from July’s comparable figure of 177,879. On a 12 month basis, job advertisements were 13.3% higher, which is an increase from July’s comparable figure of 12.8%.
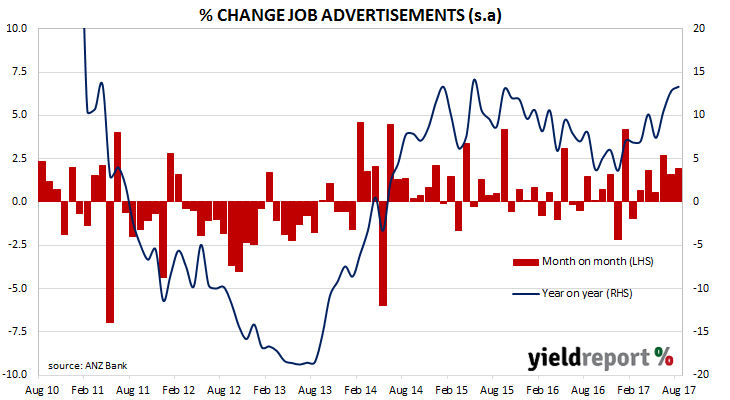
The inverse relationship between job advertisements and the unemployment rate is quite strong (see below chart). An increasing number of job advertisements as a proportion of the labour force should lead to lower unemployment rates.
01 September 2017
Back in July we noted one bidder at one of the AOFM bond tenders did not want to share with anyone. The bidder bought the entire $800 million worth of April 2029 ACGBs on offer and this caused some tongue wagging about a buyer who wanted to take advantage of the mildly dovish tone of the RBA from a day before.
Well, it has happened again. This time the bidder only had to stump up $500 million.
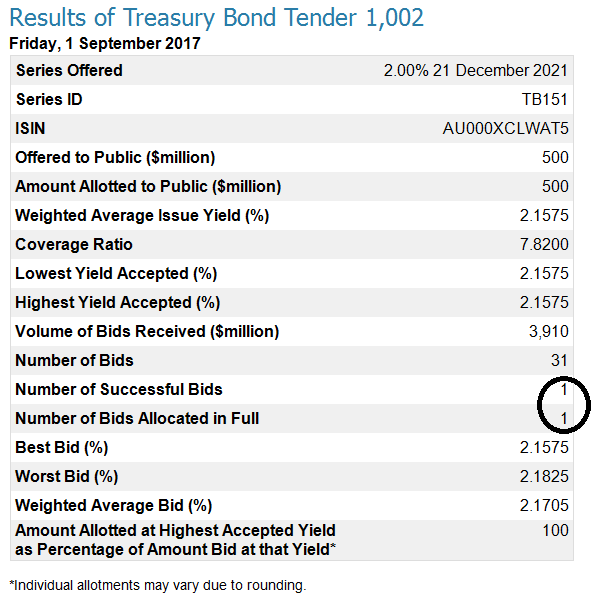
Does it mean anything? Probably not. Not only has this happened two months ago but it has occurred more than a few times over the years. However, it stands out and makes one wonder what was behind it.
31 August 2017
Growth in loans to the private sector has kept up a steady pace in July. According to the latest RBA figures, private sector credit grew by 0.5%, down from June’s figure of 0.6% and in line with the market consensus figure. The year-to-July growth rate of 5.3% was slightly lower than June’s comparable figure of 5.3%.
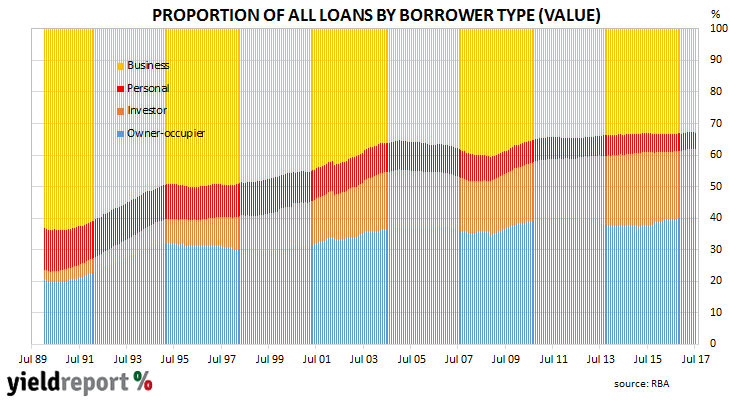
The increase was driven by owner-occupier loans, which increased by 0.5% over the month, as did business credit. These two types of lending account for most loans by value and thus any change in them has a greater effect in overall credit growth.
Westpac senior economist Andrew Hanlan said some types of lending would ultimately slow. “Housing credit growth is likely to slow in response to the recent tightening of lending standards and out of cycle interest rate rises by commercial banks. As well, the boost from RBA rate cuts in May and August 2016 has faded. That said, more generous state government first home buyer initiatives, in effect from July, will provide a partial offset.
Growth in investor loans was steady at 0.4%. On an annual basis, this segment of private credit grew by 7.4%, which kept it at the same rate as in May and June. Both APRA and the RBA would be more than a little concerned if it were to grow at a faster rate than this. While the growth rate of lending to investors has been stable for the last few months, in July it was still the highest rate of all four of the different types of lending, so its share of the total market has been increasing (see diagram below).
30 August 2017
Aside from engineering and architectural design, one of the earliest requirements of a building project is to obtain approval from the relevant statutory body. As a result, building approvals data is a leading economic indicator of future construction. While not all projects which have been approved are completed, all completed projects will have been granted approval. Approvals data thus provides a useful indicator of future construction.
The latest building approval figures have been released by the Australian Bureau of Statistics and they show a slight fall in July. Although the total fell by 1.7%, the number was not as low as the -5% result which was expected after an 11.7% spike in June. On a 12 month basis, total approvals were 13.9% lower than a year ago.

House approvals rose by 4.1% over July, which translates to a 2.4% rise over the last 12 months. Apartment approvals are a lot more volatile (see chart below) and they fell by 3.3%, which places them 27.5% lower than the number of approvals in the same month last year.
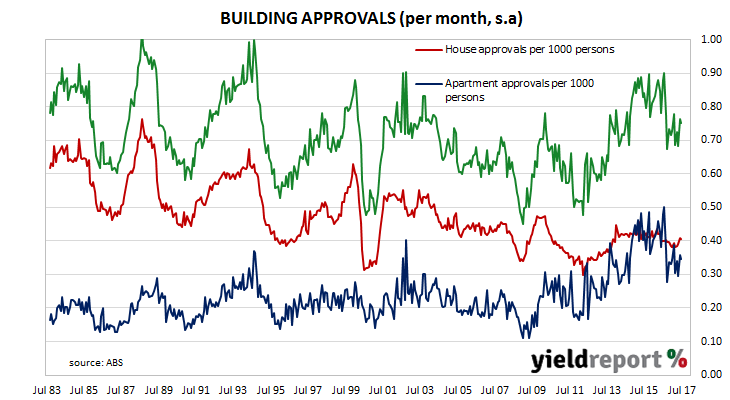
Westpac senior economist Matthew Hassan thinks July’s figures present two questions worth considering. The first is whether the high-rise apartment component will continue its downward trend while the second question is whether the non-high rise component continues its recent recovery. “The risks to the first question look stacked to the downside particularly in the wake of the recent moves by Chinese authorities to curtail offshore investment by Chinese businesses. The second question remains more open…a slowdown in the wider housing market and weak buyer sentiment will eventually see the recent rally fade.”
30 August 2017
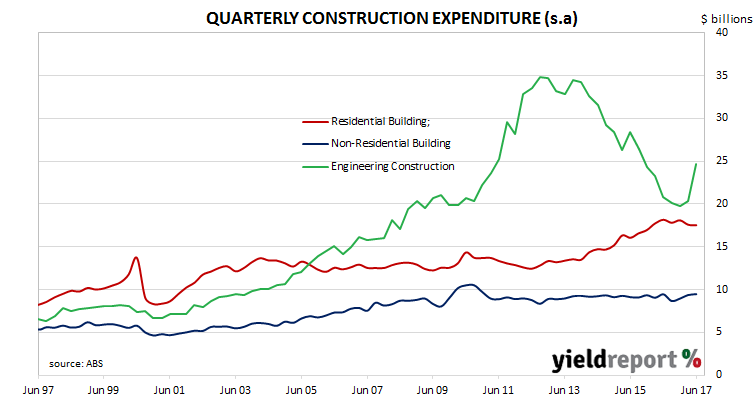
At first glance the latest June quarter construction figures look fantastic. The value of construction work increased by 9.3% over the quarter which is much higher than the 0.9% recorded in the March quarter or the 0.6% in December 2016. Compared to a year ago, June quarter construction was 6.8% higher, which is quite a jump from March’s 12 month growth rate of -5.5%. Bond yields jumped and it was probably not due to the soft building approval figures which were also released. Three year bond yields increased from 1.98% to 2.02% and 10 year bond yields rose 6bps from 2.62% to 2.68%.
A closer inspection of the figures reveals they have probably been inflated by the import of a floating LNG platform. While residential construction fell by $64 million and non-residential construction increased by $102 million, engineering construction leapt by $4.4 billion. The LNG platform is thought to account for most of the increase.
CBA economist Kristina Clifton said the figures suggested a drop in residential construction will be offset by other construction projects. “The residential construction cycle may have peaked. But a lift in non-residential building work and infrastructure will provide an offset to lost economic growth and employment.”
Westpac senior economist Andrew Hanlon agreed. “In other detail, the standout is the upswing in public works, which is a notable growth engine as governments commit to new projects, particularly in transport. Public construction work grew by a further 4.7% in the quarter. Growth has been sustained at a brisk double digit pace, with the annual pace currently 13.7%, matching the 13.6% of a year ago.”
30 August 2017
Consumer confidence surveys are important private sector surveys even though economists view them as lagging indicators. Their importance lies in the confirmation of spending patterns. As consumption in developed countries may amount to 60%-70% of GDP, knowing how it is behaving is important for financial markets’ forecasts of GDP growth rates, which in turn flow into credit growth and inflation rates.
The August reading of the Conference Board’s Consumer Confidence Index came in at 122.9, up from July’s revised reading of 120.0 and much higher than 2016’s comparable August figure of 101.8. Lynn Franco, Director of Economic Indicators at The Conference Board, said consumers perceived existing conditions had improved since July while their expectations of the near-future were unchanged but still relatively optimistic. The index was the result of a survey which ended on 16 August 2017.
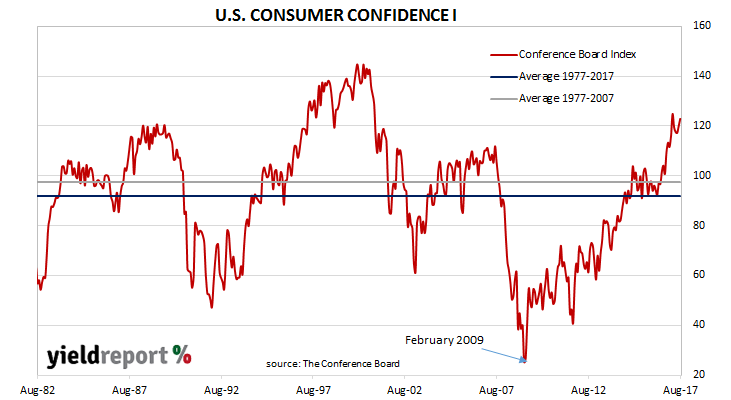
The Conference Board index is one of two U.S. consumer sentiment indices, the other being the University of Michigan’s Consumer Sentiment Index. The Conference Board’s index is based on perceptions of current business and employment conditions, as well as expectations of business conditions, employment and income six months into the future.

