31 October 2016
The Melbourne Institute Inflation Gauge recorded a rise for a third month in a row in October. The latest reading indicates consumer prices rose by 0.2% for the month and 1.5% year on year. While October’s monthly figure is less than September’s 0.4%, the year-on-year figure is higher than September’s 1.3%.
Readers will see from the chart below how the Inflation Gauge is an excellent estimator of annual CPI figures produced by the Australian Bureau of Statistics. Consumer inflation over the last five years has been edging down quite consistently, which has provided the RBA with an environment in which it could lower the official rate to a record low.
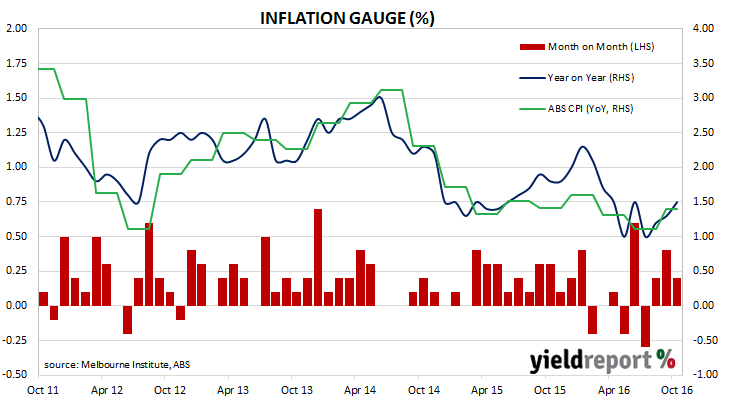
This latest figure, while above-average on a monthly basis, is still some way from marking the end of inflation’s downtrend. There have been months earlier this year where the Inflation Gauge figure has been equal or higher, only to be followed by a month with a negative figure. Economists and the RBA will require quite a few more months of figures above 0.2% before they gain confidence inflation has risen back to the RBA’s 2% to 3% target band.
28 October 2016
Despite the existence of record low interest rates and the US Fed’s programme of buying US Government debt, the US economy seems to be a long way from requiring intensive care. The US Commerce Department released Q3 “advanced” estimates of US GDP, which is the first of four estimates and subject to three more revisions over the next two months. They show an annualised growth rate of 2.9%, higher than the median estimate of 2.5% and well up on the Q2 2016 figure of 1.4%. The yields of US Treasury notes reacted by swiftly moving up before news of the FBI’s renewed interest in Hillary Clinton sent bond yields lower. 2 year bond yields finished the day 3bps lower at 0.85% and 10 year bonds were 1bp lower at 1.85%.
Net exports, government expenditure at the federal level and an increase in inventories were the main drivers, which concerned some observers due to their transitory nature. Westpac said “a good amount of that growth came from net exports and inventories neither of which can be relied upon in coming quarters.” ANZ took a less-than-hearty approach to the figures especially with regards to the export performance, which the bank put down “to a one-off surge in soybean exports to China.”
US GDP numbers are published in a manner which is different to most other countries; quarterly figures are compunded to give an annualised figure. In countries such as Australia and the UK, an annual figure is calculated by taking the latest number and comparing it with a figure from a year ago. The diagram below shows US GDP once it has been expressed in the normal manner.
28 October 2016
The UK’s Brexit vote and the accompanying fallout does not seem to have had the detrimental effect some had predicted. The UK’s Office of National Statistics released preliminary GDP figures this week indicating GDP grew at 0.5% over the September quarter, better than the 0.3% expected but lower than the 0.7% recorded in the June quarter. On a yearly basis, GDP expanded by 2.3%, up on June’s comparable figure of 2.1%. The figures, being preliminary in nature, are likely to be revised over the next month under the ONS system of preparing and releasing preliminary, second estimate and final figures for various economic estimates.
ANZ said, “The data snuffed out any chance of a cut at the BoE meeting next week.” UK bond yields rose on the day with the 10 year rate rising by 10bps. Such a large move on the day was not just the result of the GDP figures; European yields in general rose substantially but the UK figures were thought to be a significant part of the cause. NAB economist Tapas Strickland said the UK economy had “shrugged off the Brexit cloud” but he said NAB’s European staff pointed out how the GDP figures showed “an unbalanced economy with declines in Industrial Production and Construction” which would continue as the Brexit process was implemented.
28 October 2016
ANZ Research has noted what it terms as “increased market chatter” in regards to speculation of the end of record-low bond yields and the beginning of a rising trend. Yields around the world have been falling since 2008 as central banks maintained what amounted to unprecedented price support activities and as economies in Europe, the US and Japan grew at rates less than trend with next-to-no inflation.
The bank’s research staff are now asking the question if this scenario has changed. ANZ refers to rising global inflation, better GDP figures in the UK, US and even in Europe. Talk of tapering of bond purchase programmes by the European Central Bank and a change to the Bank of Japan’s 10 year bond yield policy have added to the picture of a less-friendly bond market environment. Then there is also the US Fed’s expected December meeting rate increase, which is likely to place upwards pressure on US yields.
However, ANZ is reluctant to quit the “lower for longer” view of bond yields. It says “Productivity growth is still poor, leverage extreme, central banks still dovish, and demographic pressures still evident. So while yields could indeed continue to lift modestly (we expect them to), larger moves would require a much firmer economic backdrop and there is still limited evidence of that.”
26 October 2016
In the lead up to the release of the September quarter CPI figures, much of the public discussion has been about how weak CPI figures would need to be in order to put a rate cut back into contention at the RBA November meeting. Recently, the RBA had referred to the September quarter CPI figures as worthy of our attention and, so while CPI figures are usually given considerable weighting compared to other economic data, the level of scrutiny and anticipation was up a notch this time.
The figures have now been released by the ABS and, although headline figures were stronger than the market expected, seasonally-adjusted and core numbers generally were viewed by economists as being on the low side. Seasonally-adjusted consumer inflation was 0.4% for the quarter and 1.4% for the year to September which is basically in line with market forecasts.
“Core” inflation measures favoured by the RBA, such as the “trimmed mean” and the “weighted median” were slightly below consensus when considered together. For the quarter, the trimmed-mean measure increased by 0.4% while the weighted-median increased by 0.3% and the average of the two annual rates came in at 1.5%.
Before the announcement, cash contracts had implied a 16% probability of a November rate cut but, after the announcement, the probability slipped to 4%. February contracts behaved in a similar fashion. 10 year bond yields rose 2bps on the news but finished the day down 1bp at 2.245% while 3 year bonds closed 3bps higher at 1.72%. The AUD jumped from 76.40 US cents to over 77 US cents before it settled back at around 76.80 US cents. All of this indicates financial markets viewed the numbers as supportive of higher interest rates.
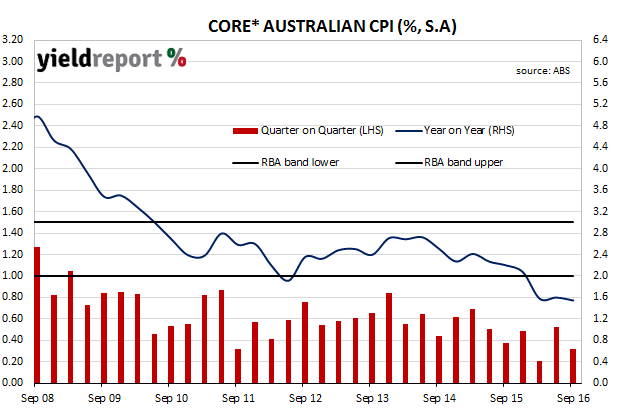
*Average of trimmed-mean and weighted-median measures
24 October 2016
YieldReport is rather fond of yield-versus-maturity scatter diagrams as they show at a glance where the anomalies lie when they exist. Evans and Partners’ Head of Income Products, Michael Saba, recently produced a scatter diagram for major bank hybrids (see below) and then made a few observations.
“The scatter diagram shows where the value is. Switch from ANZPC to WBCPC or CBAPC. Around the CBAPC maturity WBCPD offers better value. With the mid-pack margins about the same as longer-dated, sell WBCPE, CBAPD or ANZPF and gain two years less maturity risk in NABPB or WBCPF.”

(Refer to YieldReport hybrids tables for further details)
24 October 2016
The fixed interest desk at Bell Potter think the sell-off in Crown Series 1 Notes (ASX code: ASXHA) which is part of the general sell-off in various Crown securities has been overdone. Nearly twenty Crown employees were detained in China recently in relation to gambling crimes and the company’s listed securities were hammered accordingly. In their opinion, the reaction on the Series 1 Notes appears to be have been an over-reaction. “Overall, the $3.60 decline in CWNHA from $100.20 to $96.60 appears excessive. Assuming redemption at the Sep 2018 call date, CWNHA is on a yield-to-call of 9.15%, where the discount to face value increases the 5.00% issue margin to a trading margin of 7.41%. As part of their argument, they point to Crown’s November 2019 senior debt, which is trading on a fixed yield of 3.71% and a much slimmer 1.91% margin above the 3 year swap rate.
21 October 2016
Teachers Mutual has announced it has priced $100 million October 2019 FRNs. While it is not the largest or most interesting transaction YieldReport has seen this week, or month for that matter, the pricing is considerably different from its last transaction in November 2014. In that $70 million transaction, which was also for a 3 year FRN, the margin over 3 month BBSW was 100bps. In its latest transaction the margin has been set at 140bps – a considerable blowout in financing costs.
In the global scramble for yield, there has been a tendency for investors to go outside their traditional sectors in an attempt to maintain the income component of their overall return. One would think in that investment environment spreads over bonds would contract. This latest bond issue from Teachers Mutual is an indication this is not necessarily the case.
There is an upside as the overall interest cost will be less. In November 2014, 3 month BBSW was around 2.74% and a year later it was 2.26%. Now it is 1.75% and if BBSW were to stay where it is Teachers Mutual will pay around 3.15% annually, whereas in November 2014 it was paying around 3.74%. Historically low rates make even detrimental things appear better.
20 October 2016
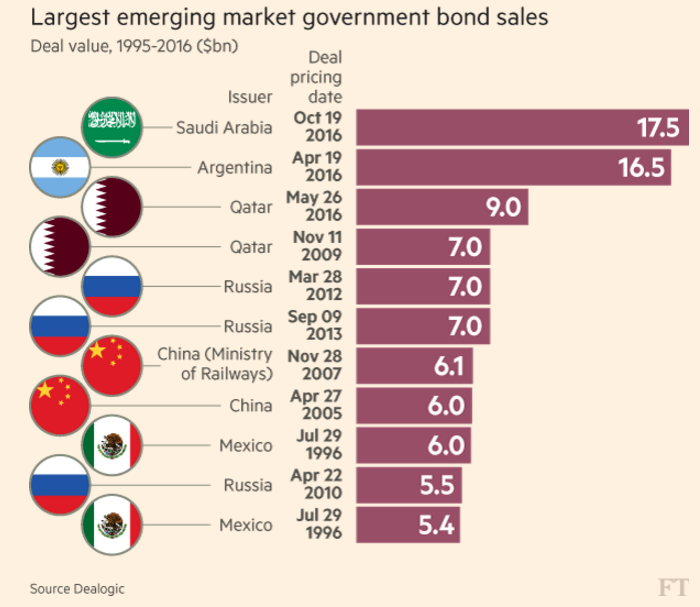
Saudi Arabia USD$17.5 billion bond sale this week has topped Argentina’s USD$16.5 billion issue in April as the largest emerging market bond transaction ever. Bids received for the Saudi bonds were reported to be in the order of USD$70 billion, which is coincidentally about the same as received in the Argentinian sale. The level of demand led to final yields being set at around 25bps less than initial guidance. It was a three tranche affair which comprised USD$5.5 billion worth of 2021 bonds at Treasury’s + 167bps, USD$5.5 billion 2026 bonds at Treasury’s + 170bps and a USD$6.5 billion 2046 bonds at Treasury’s + 215bps. Saudi Arabia has an A- (stable) rating from S&P Global Ratings.
Why are the Saudis borrowing money? Saudi Arabia has long been a middle-Eastern powerhouse on the back of the world’s largest oil reserves but in recent years sharply falling oil prices, profligate spending, funding wars in neighbour states have led to a budget deficit of around 15% of GDP. This rapid spending has occurred in quick time. Prince Mohammed has overseen the most dramatic changes in the nation state over the past 50 years.
Unlike Argentina, Saudi Arabia has not defaulted on its bond obligations in the past. Perhaps because it has only started issuing bonds in the last five years. Its status as one of the world’s larger creditor nations has meant it has had little cause in the past to issue bonds. That was until the price of oil fell to level where the oil-revenue dependent country started running budget deficits and current account deficits. In either case, it means running down reserves or issuing bonds.
20 October 2016
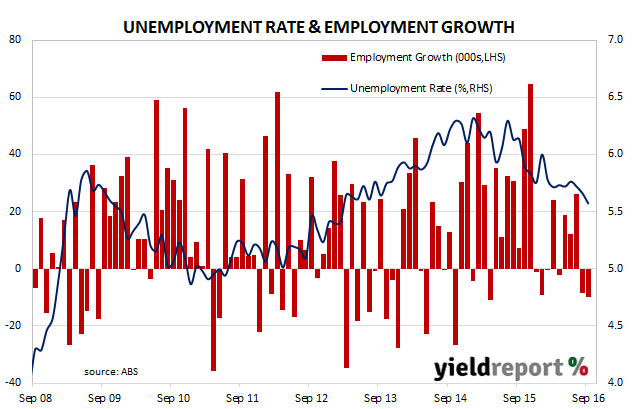
The run of controversial labour force figures continues. The ABS released September employment estimates which indicated Australia’s unemployment rate had fallen to 5.6% from August’s figure of 5.7%. However, the total number of people employed in Australia in either full-time or part-time work fell by 9800 during the month, in contrast with the market’s expectation of +15,000. The participation rate also fell, from 64.7% to 64.5%.
The ABS was at pains to point out how the estimation process was affected by an incoming group in Queensland, stating its influence had “been temporarily reduced as part of the estimation process. The data will be further reviewed when October data are available.” The labour force figures have attracted some criticism in the past and such adjustments are not likely to help the ABS rebut accusations of fudging the figures.
A comment attributed to Macquarie (but unable to be verified by YieldReport) suggested that if the participation rate had remained unchanged over 2 months then the unemployment rate would have risen to 6.1%.
While a lower unemployment rate is good news, lower total employment and a lower participation rate is not. August figures were also amended and employment numbers were revised down by 10700 and unemployment was revised up by 4200, so the August unemployment rate was 5.7% instead of 5.6% as recorded at the time. However, total hours worked recovered and rose by 4 million hours to 1660 million.
The local currency fell 0.3 US cents on the news and then proceeded to fall further so by late afternoon it was down around 0.5 US cents. The 3 year bond yield fell 3bps to 1.64% while 10 year bond yields fell only 1bp.