News

Westpac-MI leading index still negative in February, “only slightly below trend”

16 March 2022

Summary:  Leading index growth rate up in February; only slightly below trend; reading implies annual GDP growth of around 2.50%; Westpac still expects “strong above-trend growth in 2022”.

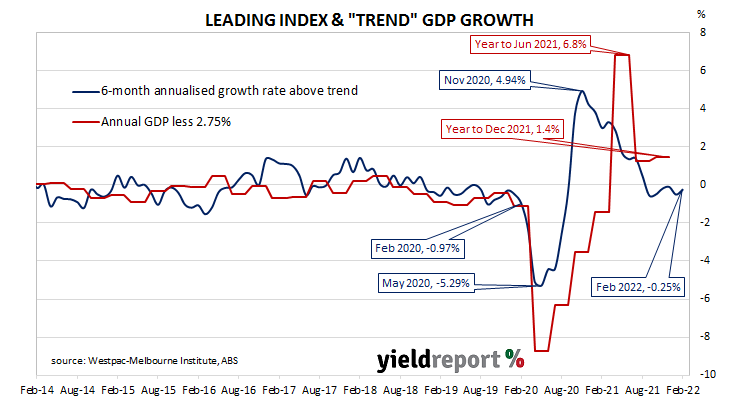
Westpac and the Melbourne Institute describe their Leading Index as a composite measure which attempts to estimate the likely pace of Australian economic growth in the short-term. After reaching a peak in early 2018, the index trended lower through 2018 and 2019 before plunging to recessionary levels in the second quarter of 2020. Subsequent readings were markedly higher but readings through 2021 mostly declined.

The February reading of the six month annualised growth rate of the indicator registered -0.25%, up from January’s revised figure of -0.50%. The result continued a run of negative readings for the index after January’s downward revision from +0.40%.

“While the growth rate lifted in February, the latest read remains in negative territory but only slightly below trend,” said Westpac Chief Economist Bill Evans. He noted recent data updates had had “a more material impact from the omicron outbreak in January”, leading to January’s downward revision.

Index figures represent rates relative to “trend” GDP growth, which is generally thought to be around 2.75% per annum in Australia. The index is said to lead GDP by up to nine months, so theoretically the current reading represents an annual GDP growth rate of around 2.50% “three to nine months into the future.”

Domestic Treasury bond yields moved lower on the day. By the close of business, the 3-year ACGB yield had shed 5bps to 2.05% while 10-year and 20-year yields both finished 2bps lower at 2.56% and 2.95% respectively.

Evans said he still expects “strong above-trend growth in 2022” as a consequence of “extraordinary emergency policy measures from both the fiscal and monetary authorities during 2020 and 2021.” Westpac recently raised its March quarter GDP forecast from zero to 0.5% and has forecast 5.5% growth for calendar-year 2022.

No gain for euro industrial production in January

15 March 2022

Summary: Euro-zone industrial production flat in January; less than 0.3% expected; annual growth rate slows to -1.3%; German, French production up, down in Italy, Spain.

Following a recession in 2009/2010 and the debt-crisis which flowed from it, euro-zone industrial production recovered and then reached a peak four years later in 2016. Growth rates then fluctuated for two years before beginning a steady and persistent slowdown from the start of 2018. That decline was transformed into a plunge in March and April of 2020 which then took over a year to claw back. Production in more-recent months has generally stagnated.

According to the latest figures released by Eurostat, euro-zone industrial production remained unchanged in January on a seasonally-adjusted and calendar-adjusted basis. The result was lower than the 0.3% increase which had been generally expected and considerably less than December’s 1.3% gain after revisions. The calendar-adjusted growth rate on an annual basis sped up from December’s revised rate of +2.0% to -1.3%.

German and French sovereign bond yields rose noticeably on the day. By the close of business, the German 10-year yield had gained 12bps to 0.36% while the French 10-year yield finished 11bps higher at 0.83%.

Industrial production expanded in two of the euro-zone’s four largest economies. Germany’s production expanded by 1.3% while the growth figures for France, Spain and Italy were +1.6%, -3.4% and 0.0% respectively.

US PPI inflation slows in February; annual rate still over 10%

15 March 2022

Summary: US producer price index (PPI) up 0.8% in February, less than 1.0% expected; annual rate unchanged at 10.1%; “core” PPI up 0.2%.

Around the end of 2018, the annual inflation rate of the US producer price index (PPI) began a downtrend which continued through 2019. Months in which producer prices increased suggested the trend may have been coming to an end, only for it to continue, culminating in a plunge in April 2020. Figures returned to “normal” towards the end of that year but recent months’ annual rates have been well above the long-term average.

The latest figures published by the Bureau of Labor Statistics indicate producer prices rose by 0.8% after seasonal adjustments in February. The increase was less than the 1.0% rise which had been generally expected and lower than January’s revised figure of 1.2%. On a 12-month basis, the rate of producer price inflation after seasonal adjustments remained unchanged from January’s revised rate of 10.1%.

Producer prices excluding foods and energy, or “core” PPI, rose by just 0.2% after seasonal adjustments. The increase was less than the 0.6% which had been generally expected and substantially lower than January’s revised figure of 1.0%. The annual rate slowed from January’s revised rate of 8.6% to 8.4%.

US Treasury bond yields reacted in a mixed fashion on the day. By the close of business, the 2-year Treasury yield had slipped 1bp to 1.86%, the 10-year yield had gained 3bps to 2.15% while the 30-year yield finished unchanged at 2.48%.

In terms of US Fed policy, expectations for a higher federal funds rate over the next 12 months firmed a little. At the close of business, March contracts implied an effective federal funds rate of 0.215%, 14bps higher than the current spot rate. June contracts implied 0.905% while March 2023 futures contracts implied an effective federal funds rate of 2.03%, 195bps above the spot rate.

The producer price index is a measure of prices received by producers for domestically produced goods, services and construction. It is put together in a fashion similar to the consumer price index (CPI) except it measures prices received from the producer’s perspective rather than from the perspective of a retailer or a consumer. It is another one of the various measures of inflation tracked by the US Fed, along with core personal consumption expenditure (PCE) price data.

US consumer inflation nears 8% in February; more persistent, expansive

10 March 2022

Summary: US CPI up 0.8% in February, in line with expectations; “core” rate up 0.5%; inflationary pressures proving more persistent, expansive; Treasury yields up, rate rise expectations firm; commodities main driver of headline rise.

The annual rate of US inflation as measured by changes in the consumer price index (CPI) halved from nearly 3% in the period from July 2018 to February 2019. It then fluctuated in a range from 1.5% to 2.0% through 2019 before rising above 2.0% in the final months of that year. Substantially lower rates were reported from March 2020 to May 2020 and they remained below 2% until March this year. Rates has risen significantly since then.

The latest CPI figures released by the Bureau of Labor Statistics indicated seasonally-adjusted consumer prices increased by 0.8% on average in February. The result was in line with expectations but higher than January’s 0.6%. On a 12-month basis, the inflation rate accelerated from January’s reading of 7.5% to 7.9%.

“Headline” inflation is known to be volatile and so references are often made to “core” inflation for analytical purposes. Core inflation, a measure of inflation which strips out the more variable food and energy components of the index, increased by 0.5% on a seasonally-adjusted basis for the month. The rise was in line with expectations but slightly lower than January’s 0.6% increase. The annual growth rate increased from 6.0% to 6.4%.

“[The] net take-away is that US inflationary pressures are proving to be more persistent and expansive, increasing the pressure on the Fed to lift the funds rate and cool the economy,” said NAB currency strategist Rodrigo Catril.

US Treasury bond yields rose on the day. By the close of business, the 2-year Treasury yield had added 3bps to 1.70%, the 10-year yield had gained 5bps to 1.99% while the 30-year yield finished 6bps higher at 2.37%.

In terms of US Fed policy, expectations for a higher federal funds rate over the next 12 months firmed somewhat. At the close of business, March contracts implied an effective federal funds rate of 0.205%, 12bps higher than the current spot rate. June contracts implied 0.85% while March 2023 futures contracts implied an effective federal funds rate of 1.81%, 173bps above the spot rate.

The largest influence on headline results is often the change in fuel prices. “Energy commodities”, the segment which contains vehicle fuels, increased by 6.7%, adding 0.27 percentage points. However, prices of non-energy services, the segment which includes actual and implied rents, again had the largest effect, adding 0.29 percentage points after they increased by 0.5% on average.

January JOLTS: US jobs market mismatch “far from resolved”

09 March 2022

Summary: US quit rate falls back to 2.8% in January; “still very high”, labour supply/demand mismatch “far from resolved”; quits, job openings down, separations up.

The number of US employees who quit their jobs as a percentage of total employment increased slowly but steadily after the GFC. It peaked in March 2019 and then tracked sideways until virus containment measures were introduced in March 2020. The quit rate then plummeted as alternative employment opportunities rapidly dried up. Following the easing of US pandemic restrictions, it proceeded to recover back to its pre-pandemic rate in the third quarter of 2020 before trending higher through 2021.

Figures released as part of the most recent Job Openings and Labor Turnover Survey (JOLTS) report show the quit rate fell again in January. 2.8% of the non-farm workforce left their jobs voluntarily, down from December’s revised figure of 3.0%. There were 151,000 fewer quits during the month and an additional 481,000 people employed in the non-farm sector.

ANZ economist Daniel Been noted the quit rate “is still very high” even after the decline. ”Given that the US labour market has continued to tighten, with unemployment down to 3.8% in February, it’s clear the mismatch between labour supply and demand is far from being resolved.”

US Treasury yields moved materially higher in what could be called a “risk-on” day. By the close of business, the 2-year Treasury bond yield had gained 6bps to 1.67%, the 10-year yield had added 9bps to 1.94% while the 30-year yield finished 8bps higher at 2.31%.

In terms of US Fed policy, expectations for a higher federal funds rate over the next 12 months softened slightly. At the close of business, March contracts implied an effective federal funds rate of 0.215%, 14bps higher than the current spot rate. June contracts implied 0.835% and March 2023 futures contracts implied an effective federal funds rate of 1.87%, 179bps above the spot rate.

The fall in total quits was led by 69,000 fewer resignations in the “Retail” sector and 63,000 fewer resignations in the “Professional and business services” sector. The “Finance and insurance” sector experienced the single largest increase, rising by 30,000. Overall, the total number of quits for the month fell from December’s revised figure of 4.403 million to 4.252 million.

Total vacancies at the end of January decreased by 185,000, or 1.6%, from December’s revised figure of 11.448 million to 11.263 million. The fall was driven by a 288,000 drop in the “Accommodation and food services” sector and a 132,000 decrease in the “Transportation, warehousing, and utilities” sector. The “Other services” sector experienced the single largest increase, rising by 136,000. Overall, 8 out of 18 sectors experienced fewer job openings than in the previous month.

In contrast, total separations increased by 16,000, or 0.3%, from December’s revised figure of 6.042 million to 6.058 million. The rise was led by the “Finance and insurance” sector, where there were 28,000 more separations than in December. Separations increased in 12 out of 18 sectors.

The “quit” rate time series produced by the JOLTS report is a leading indicator of US hourly pay. As wages account for around 55% of a product’s or service’s price in the US, wage inflation and overall inflation rates tend to be closely related. Former Federal Reserve chief and current Treasury Secretary Janet Yellen was known to pay close attention to it.

“No surprise” Westpac-MI sentiment index lower in March

09 March 2022

Summary: Household sentiment deteriorates in March; index fall “no surprise” given floods, inflation concerns, higher interest rates; all five sub-indices lower; conditions “supportive” due to strong balance sheets, excess savings, rising income growth; Unemployment Expectations index lower.

After a lengthy divergence between measures of consumer sentiment and business confidence in Australia which began in 2014, confidence readings of the two sectors converged again in mid-July 2018. Both readings then deteriorated gradually in trend terms, with consumer confidence leading the way. Household sentiment fell off a cliff in April 2020 but, after a few months of to-ing and fro-ing, it then staged a full recovery.

According to the latest Westpac-Melbourne Institute survey conducted in the first week of March, household sentiment has again deteriorated. Their Consumer Sentiment Index fell from February’s reading of 100.8 to 96.6 in March. The latest figure is now noticeably lower than the long-term average reading of just over 101.

“The latest monthly fall comes as no surprise. The war in Ukraine, the floods in south-east Queensland and northern New South Wales, ongoing concerns about inflation and higher interest rates were all likely to impact confidence, although the size of the decline is still notable,” said Westpac Chief Economist Bill Evans. Any reading of the Consumer Sentiment Index above 100 indicates the number of consumers who are optimistic is greater than the number of consumers who are pessimistic.

Domestic Treasury bond yields increased on the day despite the report, following the lead of moderately higher US Treasury yields in overnight trading. By the close of business, 3-year and 10-year ACGB yields had both gained 8bps to 1.76% and 2.32% respectively while the 20-year yield finished 7bps lower at 2.78%.

In the cash futures market, expectations of a change in the actual cash rate, currently at 0.05%, firmed with respect to rate rises in the second half of 2022. At the end of the day, contract prices implied the cash rate would rise gradually from the current rate of 0.050% to 0.12% by May, then increase to 0.61% by August and then to 1.51% by February 2023.

“Overall, the consumer backdrop remains supportive with a strong balance sheet and excess savings, as well as rising income growth from a tight labour market and higher wage growth. The key question for the economy will be whether the consumer utilises this through spending, making the evolution of sentiment through the year a key indicator to watch,” said Morgan Stanley Australia equity strategist Chris Read.  He currently expects domestic demand to be “solid” through 2022 even if household remain cautious.

All five sub-indices registered lower readings, with the “Economic conditions – next 12 months” sub-index posting the largest monthly percentage loss. The reading of the “Economic conditions next 5 years” sub-index also deteriorated noticeably.

The Unemployment Expectations index, formerly a useful guide to RBA rate changes, fell from 102.8 to 101.8. Lower readings result from fewer respondents expecting a higher unemployment rate in the year ahead.

Business conditions, confidence up in Feb; higher costs passing to consumers

08 March 2022

Summary: Business conditions improves in February; confidence improved markedly again; fewer health-related employment disruptions, strong labour demand; trading, profitability improves; “lot of room for improvement”, conditions, capacity utilisation below Delta reopening period; capacity utilisation rate up, 6 of 8 sectors of economy at/above respective long-run averages; retail price inflation “elevated”, cost pressures increasingly passed on to consumers.

NAB’s business survey indicated Australian business conditions were robust in the first half of 2018, with a cyclical-peak reached in April of that year. Readings from NAB’s index then began to slip, declining to below-average levels by the end of 2018. Forecasts of a slowdown in the domestic economy began to emerge in the first half of 2019 and the index trended lower, hitting a nadir in April 2020 as pandemic restrictions were introduced. Conditions improved markedly over the next twelve months, only to revert back to more normal levels in the latter part of 2021.

According to NAB’s latest monthly business survey of over 400 firms conducted over the last week of February, business conditions have improved. NAB’s conditions index registered 9, up from January’s reading of 2.

“The rebound came on the back of a strong rise in the employment index, reflecting fewer health-related employment disruptions and strong labour demand, as well as improvements in trading and profitability,” said NAB senior economist Brody Viney.

Business confidence improved markedly for a second consecutive month. NAB’s confidence index rose from January’s revised reading of 4 to 13, back above the long-term average. Typically, NAB’s confidence index leads the conditions index by approximately one month, although some divergences have appeared in the past from time to time.

Commonwealth Government bond yields increased noticeably on the day. By the close of business, the 3-year ACGB yield had gained 9bps to 1.68%, the 10-year yield had added 10bps to 2.24% while the 20-year yield finished 8bps higher at 2.78%.

In the cash futures market, expectations of a change in the actual cash rate, currently at 0.05%, firmed in favour of rate rises in the second half of 2022. At the end of the day, contract prices implied the cash rate would creep up from the current rate of 0.050% to 0.125% by May, then increase to 0.575% by August and then to 1.46% by February 2023.

“The improvement was broad-based across most key indicators, industries and states. But there is still a lot of room for improvement. Conditions and capacity utilisation remained just below the Delta reopening period and well below the pre-Delta lockdown period,” said ANZ senior economist Catherine Birch.

NAB’s measure of national capacity utilisation continued to recover from December’s drop and it rose from January’s revised figure of 81.7% to 82.5%. Six of the eight sectors of the economy were reported to be operating at or above their respective long-run averages. The retail and mining sectors were the exceptions.

Capacity utilisation is generally accepted as an indicator of future investment expenditure and it also has a strong inverse relationship with the unemployment rate.

NAB’s Viney noted retail price inflation remained “elevated” and “cost pressures are increasingly being passed on to consumers.” However, he said the pressure on prices “continue to be driven more by temporary purchase cost factors rather than more sustained wage and labour cost pressures.”

Job ads up in Feb; ANZ jobless rate to hit “low 3s”

07 March 2022

Summary:  Job ads up 8.7% in February; 31.9% higher than same month in 2021; labour demand growing, job-switching expected to rise; ANZ expects “low 3s” jobless rate later this year, underemployment rate to fall; ads-to-workforce ratio up at 1.7%.

From mid-2017 onwards, year-on-year growth rates in the total number of Australian job advertisements consistently exceeded 10%. That was until mid-2018 when the annual growth rate fell back markedly. 2019 was notable for its reduced employment advertising and this trend continued into the first quarter of 2020. Advertising plunged in April and May of 2020 as pandemic restrictions took effect but then recovered quite quickly.

According to the latest ANZ figures, total advertisements jumped by 8.4% in February on a seasonally-adjusted basis. The rise followed a 0.7% decline in January and a 5.4% fall in December after revisions. On a 12-month basis, total job advertisements were 31.6% higher than in February 2021, up from January’s revised figure of 27.3%.

“The February increase reinforces the view we expressed last month that job ads hadn’t yet peaked, with labour demand continuing to grow and job-switching expected to rise,” said ANZ senior economist Catherine Birch.

Long-term Commonwealth Government bond yields declined a little on the day, almost ignoring the heavy falls of US Treasury yields overnight. By the close of business, the 10-year ACGB yield had lost 2bps to 2.14% and the 20-year yield had slipped 1bp to 2.63%. The 3-year yield finished unchanged at 1.59%.

Birch said ANZ expects the jobless rate to fall to the “low 3s” later this year and for the underemployment rate to “fall further” even as Australia’s borders re-open. “New arrivals will also add to demand for goods and services, and consequently, demand for labour, in an already strong demand environment. As such, competition for labour is likely to remain elevated.”

The inverse relationship between job advertisements and the unemployment rate has been quite strong (see below chart), although ANZ themselves called the relationship between the two series into question in early 2019. A rising number of job advertisements as a proportion of the labour force is suggestive of lower unemployment rates in the near-future while a falling ratio suggests higher unemployment rates will follow.

In 2008/2009, advertisements plummeted and Australia’s unemployment rate jumped from 4% to nearly 6% over a period of 15 months. When a more dramatic fall in advertisements took place in April 2020, the unemployment rate responded much more quickly.

Ukraine news overshadows February job gains in US

04 March 2022

Summary:  Non-farm payrolls increase by 678,000 in February; noticeably greater than expected figure; previous two months’ figures revised up by 92,000; jobless rate down to 3.8%, participation rate up; data takes back seat to developments in Ukraine; figures support case rate rise at upcoming FOMC meeting; jobs-to-population ratio increases; underutilisation rate ticks up to 7.2%; annual hourly pay growth slows to 5.1%.

The US economy ceased producing jobs in net terms as infection controls began to be implemented in March 2020. The unemployment rate had been around 3.5% but that changed as job losses began to surge through March and April of 2020. The May 2020 non-farm employment report represented a turning point and subsequent months provided substantial employment gains. Changes in recent months have been generally more modest but usually well above the long-term monthly average.

According to the US Bureau of Labor Statistics, the US economy created an additional 678,000 jobs in the non-farm sector in February. The increase was noticeably greater than the 400,000 which had been generally expected earlier in the week as well as the 481,000 jobs which had been added in January after revisions. Employment figures for December and January were also revised up by a total of 92,000.

The total number of unemployed decreased by 243,000 to 6.270 million while the total number of people who are either employed or looking for work increased by 0.305 million to 163.995 million. These changes led to the US unemployment rate declining from 4.0% in January to 3.8%. The participation rate ticked up from January’s revised rate of 62.2% to 62.3%.

“Whilst US non-farm payrolls came in better than expected, the data took a back seat to the ongoing developments in Ukraine,” said ANZ Head of Australian Economics David Plank.

US Treasury yields fell noticeably on the day as investors moved out of equities and sought low-risk assets. By the close of business, the 2-year yield had lost 4bps to 1.49%, the 10-year yield had shed 11bps to 1.74% while the 30-year yield finished 7bps lower at 2.16%.

In terms of US Fed policy, expectations for a higher federal funds rate over the next 12 months softened noticeably. At the close of business, March contracts implied an effective federal funds rate of 0.205%, 13bps higher than the current spot rate. June contracts implied 0.77% while February 2023 futures contracts implied an effective federal funds rate of 1.66%, 158bps above the spot rate.

Plank noted the figures “support the case” for a 25 basis point rise at the upcoming FOMC meeting “with the possibility of 50 basis point hikes later in the year.”

One figure which is indicative of the “spare capacity” of the US employment market is the employment-to-population ratio. This ratio is simply the number of people in work divided by the total US population. It hit a cyclical-low of 58.2 in October 2010 before slowly recovering to just above 61% in late-2019. February’s reading increased from 59.7% to 59.9%, still some way from the April 2000 peak reading of 64.7%.

Wage growth spiked in the US during the early stages of pandemic restrictions as lower-paid jobs disappeared at a faster rate relative to higher-paid jobs, disrupting the usual relationship between wage inflation and unemployment rates. Normally, wages tend to grow as the supply of labour tightens.

Apart from the unemployment rate, another measure of tightness in the labour market is the underutilisation rate. The latest reading of it ticked up from January’s 7.1% to 7.2%. Wage inflation and the underutilisation rate usually have an inverse relationship and hourly pay growth in the year to February slowed from January’s revised rate of 5.5% to 5.1%.

ADP payrolls up 475K in February; January figure revised radically

02 March 2022

Summary: ADP payrolls up 475,000 in February, greater than consensus expectations; January figure radically revised up; track record of predicting official payrolls reports questioned; positions down in small firms but up in larger businesses; just under 90% of gains in services sector, led by leisure/hospitality sector.

The ADP National Employment Report is a monthly report which provides an estimate of US non-farm employment in the private sector. Since publishing of the report began in 2006, its employment figures have exhibited a high correlation with official non-farm payroll figures, although a large difference can arise in any individual month.

The latest ADP report indicated private sector employment increased by 475,000 in February, greater than the 310,000 increase which had been generally expected. January’s 301,000 fall was revised up radically by 810,000.

NAB currency strategist Rodrigo Catril said, “The survey hasn’t had a good track record in predicting non-farm payrolls in recent months…”

The report was released on the same day as US Fed chief Jerome Powell testified before a congressional committee. Treasury bond yields jumped and, by the close of business, the 2-year Treasury bond yield had gained 19bps to 1.53%, the 10-year yield had added 17bps to 1.90% while the 30-year yield finished 16bps higher at 2.28%.

In terms of US Fed policy, expectations for higher federal funds rates over the next 12 months firmed considerably. At the close of business, March contracts implied an effective federal funds rate of 0.21%, 13bps higher than the current spot rate. June contracts implied 0.785% while March 2023 futures contracts implied an effective federal funds rate of 1.69%, 161bps above the spot rate.

Employment numbers in net terms increased across medium and large businesses while small businesses shed employees. Firms with less than 50 employees shed a net 96,000 positions, mid-sized firms (50-499 employees) added 18,000 positions while large businesses (500 or more employees) accounted for 552,000 fewer employees.

Employment at service providers accounted for just under 90% of the total net increase, or 417,000 positions. The “Leisure & Hospitality” sector was the largest single source of gains, with 170,000 more positions. The “Trade, Transportation & Utilities” and “Professional & Business” sectors were also significant source, each adding 98,000 positions and 72,000 positions respectively. Total jobs among goods producers increased by a net 57,000 positions.

Prior to the ADP report, the consensus estimate of the change in February’s official non-farm employment figure was +400,000. The non-farm payroll report will be released by the Bureau of Labor Statistics this coming Friday night (AEST), 4 March.

Click for more news