Summary: ISM PMI up from 57.6% to 58.6% in February, slightly above consensus expectation; “demand-driven, supply chain-constrained environment”; supply chain pressures “intense”; latest reading implies 4.5% 12-month US GDP growth rate in July.
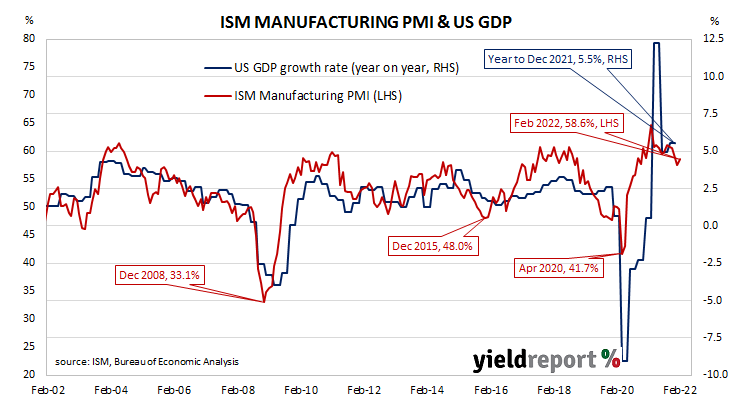
The Institute of Supply Management (ISM) manufacturing Purchasing Managers Index (PMI) reached a cyclical peak in September 2017. It then started a downtrend which ended in March 2020 with a contraction in US manufacturing which lasted until June 2020. Subsequent month’s readings implied growth had resumed, with the index becoming stronger through to March 2021. Since then, readings have remained at elevated levels despite recent declines.
According to the ISM’s February survey, its PMI recorded a reading of 58.6%, slightly above the generally expected figure of 58.0% and a little higher than January’s 57.6%. The average reading since 1948 is 53.0% and any reading above 50% implies an expansion in the US manufacturing sector relative to the previous month.
“The US manufacturing sector remains in a demand-driven, supply chain-constrained environment,” said Timothy Fiore, Chair of the ISM’s Manufacturing Business Survey Committee. He noted COVID-19 continued to have a noticeable effect but “there were signs of relief, with recovery expected in March.”
US Treasury yields fell significantly on the day as investors switched to lower-risk assets. By the close of business, the 2-year Treasury bond yield had dropped by 11bps to 1.34%, the 10-year yield had shed 10bps to 1.73% while the 30-year yield finished just 4bps lower at 2.12%.
In terms of US Fed policy, expectations for higher federal funds rates over the next 12 months softened considerably. At the close of business, March contracts implied an effective federal funds rate of 0.21%, 13bps higher than the current spot rate. June contracts implied 0.645% while March 2023 futures contracts implied an effective federal funds rate of 1.395%, 132bps above the spot rate.
“Backlogged orders and supplier delivery times lifted, suggesting supply chain pressures are intense,” said ANZ senior economist Catherine Birch. NAB senior economist Tapas Strickland agreed, stating, “There was no further easing of supply-side pressures in this survey.”
Purchasing managers’ indices (PMIs) are economic indicators derived from monthly surveys of executives in private-sector companies. They are diffusion indices, which means a reading of 50% represents no change from the previous period, while a reading under 50% implies respondents reported a deterioration on average.
According to the ISM’s latest announcement, a reading “above 48.7%, over a period of time, generally indicates an expansion of the overall economy.”
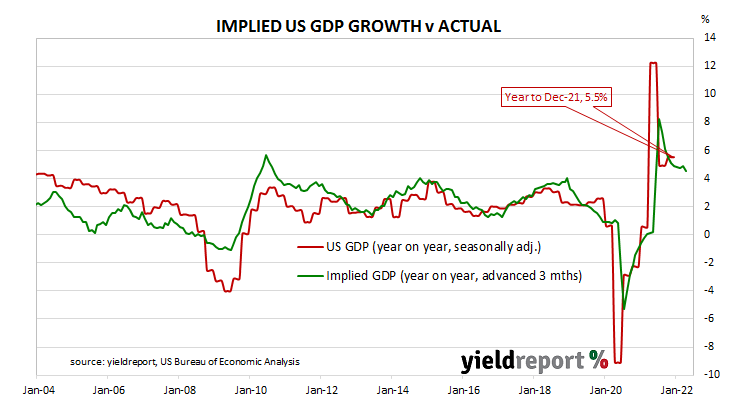
The ISM’s manufacturing PMI figures appear to lead US GDP by several months despite a considerable error in any given month. The chart below shows US GDP on a “year on year” basis (and not the BEA annualised basis) against US GDP implied by monthly PMI figures.
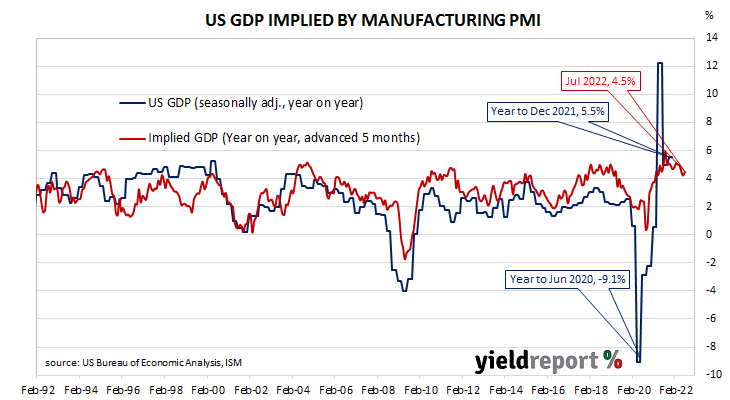
According to the ISM and its analysis of past relationships between the PMI and US GDP, February’s PMI corresponds to an annualised growth rate of 3.5%, or 0.9% over a quarter. Regression analysis on a year-on-year basis suggests a 12-month GDP growth rate of 4.5% five months after this latest report.
The ISM index is one of two monthly US PMIs, the other being an index published by IHS Markit. IHS Markit also produces a “flash” estimate in the last week of each month which comes out about a week before the ISM index is published. The IHS Markit February flash manufacturing PMI registered 57.5%, 2 percentage points higher than January’s final figure.