News

US Industrial production up in January; cold weather “flatters” result

16 February 2022

Summary: US industrial output up 1.4% in January, considerably higher than 0.4% expected; up 4.1% over past 12 months; “flattered” by higher utility production as cold weather hits; capacity utilisation rate up 1.0 ppt to 77.6%; above February 2020 figure, still short of long-term average.

The Federal Reserve’s industrial production (IP) index measures real output from manufacturing, mining, electricity and gas company facilities located in the United States. These sectors are thought to be sensitive to consumer demand and so some leading indicators of GDP use industrial production figures as a component. US production collapsed through March and April of 2020 before recovering the ground lost over the fifteen months to July 2021.

According to the Federal Reserve, US industrial production expanded by 1.4% on a seasonally adjusted basis in January. The result was considerably higher than the 0.4% increase which had been generally expected and in contrast with December’s 0.1% contraction. On an annual basis, the expansion rate picked up from December’s revised figure of 3.8% to 4.1%.

ANZ economist John Bromhead noted the result was “flattered” by increased production at US utilities in response to cold weather.

The figures were released at about the same time as the latest retail sales report and US Treasury bond yields moved lower on the day, especially at the short-end. By the close of business, the 2-year Treasury yield had shed 7bps to 1.51%, the 10-year yield had lost 3bps to 2.03% while the 30-year yield finished 4bps lower at 2.33%.

The same report includes US capacity utilisation figures which are generally accepted as an indicator of future investment expenditure and/or inflationary pressures. Capacity usage had hit a high for the last business cycle in early 2019 before it began a downtrend which ended with April 2020’s multi-decade low of 64.2%. January’s reading jumped from December’s revised reading of 76.6% to 77.6%, which is above February 2020’s reading of 76.3% but still short of the long-term average of 80.1%.

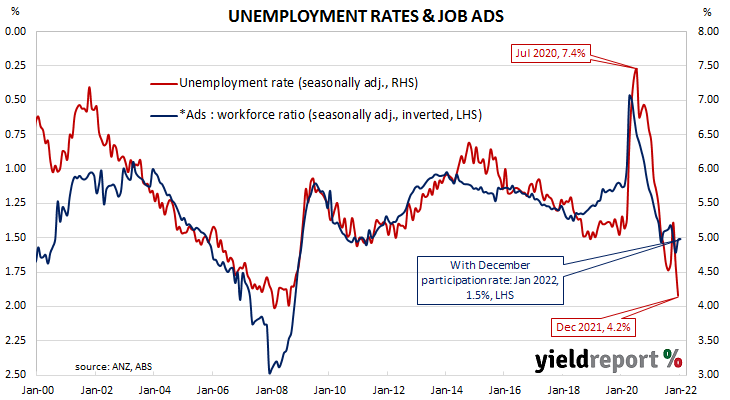
While the US utilisation rate’s correlation with the US jobless rate is solid, it is not as high as the comparable correlation in Australia.

US retail sales up in January; Omicron “no fear for consumers”

16 February 2022

Summary:  US retail sales up 3.8% in January; rise greater than 1.8% gain expected; Omicron wave “no fear for consumers”; evidence points “to strong underlying demand conditions, inflation”; rises in eight of twelve retail categories; “non-store” segment” the largest single influence, rises 14.3%.

US retail sales had been trending up since late 2015 but, commencing in late 2018, a series of weak or negative monthly results led to a drop-off in the annual growth rate below 2.0%. Growth rates then increased in trend terms through 2019 and into early 2020 until pandemic restrictions sent it into negative territory. A “v-shaped” recovery then took place which was followed by some short-term spikes as federal stimulus payments hit US households in the first and second quarters of 2021.

According to the latest “advance” sales numbers released by the US Census Bureau, total retail sales increased by 3.8% in January. The rise was greater than the 1.8% gain which had been generally expected and in contrast to December’s -2.5% after it was revised down from -1.9%. On an annual basis, the growth rate slowed from December’s revised figure of 16.7% to 13.0%.

“Certainly, the Omicron wave which the US was in the midst of last month, held no fear for consumers,” said NAB Head of FX Strategy within its FICC division. However, he also noted the influence of seasonal adjustments on the figures, “with traditionally strong December sales pulled forward into November and January benefiting more than it has historically from start of year sales.”

The figures were released at about the same time as January’s industrial production figures and US Treasury bond yields moved lower on the day, especially at the short-end. By the close of business, the 2-year Treasury yield had shed 7bps to 1.51%, the 10-year yield had lost 3bps to 2.03% while the 30-year yield finished 4bps lower at 2.33%.

ANZ economist John Bromhead said the report was “best looked at on a two-month comparison because of Omicron distortions.” However, he still noted “all the evidence is pointing to strong underlying demand conditions and inflation.”

Eight of the twelve categories recorded higher sales over the month. The “Non-store retailers” segment provided the largest single influence on the overall result, rising by 14.3% for the month and 8.4% for the year to January.

The non-store segment includes vending machine sales, door-to-door sales and mail-order sales but nowadays this segment has become dominated by online sales. It now accounts for a little over 14% of all US retail sales and it has become the second largest segment after the vehicles and parts segment.

German output drives euro-zone industrial production higher in December

16 February 2022

Summary: Euro-zone industrial production up 1.2% in December; noticeably larger than 0.4% expected; annual growth rate speed up to +1.6%; German production up, down in other major euro-zone economies.

Following a recession in 2009/2010 and the debt-crisis which flowed from it, euro-zone industrial production recovered and then reached a peak four years later in 2016. Growth rates then fluctuated for two years before beginning a steady and persistent slowdown from the start of 2018. That decline was transformed into a plunge in March and April of 2020 which then took over a year to claw back. Production in more-recent months has generally stagnated.

According to the latest figures released by Eurostat, euro-zone industrial production increased by 1.2% in December on a seasonally-adjusted and calendar-adjusted basis. The rise was noticeably larger than the 0.4% increase which had been generally expected but half November’s 2.4% gain after revisions. The calendar-adjusted growth rate on an annual basis sped up from November’s revised rate of -1.4% to +1.6%.

German and French sovereign bond yields fell moderately on the day. By the close of business, the German 10-year yield had shed 4bps to 0.27% while the French 10-year yield finished 3bps lower at 0.75%.

Industrial production expanded in just one of the euro-zone’s four largest economies. Germany’s production expanded by 1.1% while the growth figures for France, Spain and Italy were -0.2%, -1.0% and -0.6% respectively.

Back in black: WBC-MI leading index goes positive in January

16 February 2022

Summary:  Leading index growth rate up in January, no longer negative; first positive reading since Delta lockdowns; reading implies annual GDP growth of around 3.15% during June/September quarters; Westpac expects zero GDP growth in March quarter

Westpac and the Melbourne Institute describe their Leading Index as a composite measure which attempts to estimate the likely pace of Australian economic growth in the short-term. After reaching a peak in early 2018, the index trended lower through 2018 and 2019 before plunging to recessionary levels in the second quarter of 2020. Subsequent readings were markedly higher but readings through much of 2021 steadily declined.

The January reading of the six month annualised growth rate of the indicator registered +0.40%, up from December’s -0.10%. The result ended a four-month run of negative readings for the index.

“This is the first positive, above trend, read on the Index growth rate since the ‘Delta’ lockdowns impacted in August last year. With the growth rate now in positive territory, the Index is signalling that the growth outlook has improved with above trend growth over the next three to nine months likely,” said Westpac Chief Economist Bill Evans.

Index figures represent rates relative to “trend” GDP growth, which is generally thought to be around 2.75% per annum in Australia. The index is said to lead GDP by up to nine months, so theoretically the current reading represents an annual GDP growth rate of around 3.15% in the second or third quarters of 2022.

Domestic Treasury bond yields moved higher on the day, slightly lagging the overnight movements of their US Treasury bond counterparts. By the close of business, the 2-year ACGB yield had inched up 1bp to 1.71% while 10-year and 20-year yields both finished 5bps higher at 2.25% and 2.72% respectively.

Evans said Westpac expects zero GDP growth in the March quarter after a contraction in spending in January but “the economy is likely to bounce back strongly over the remainder of 2022, registering a solid 5.5% growth rate for the year overall.”

“Surprise uptick” for US core PPI in January report

15 February 2022

Summary: US producer price index (PPI) up 1.0% in January, double 0.5% expected; annual rate eases from 10.0% to 9.8%; “core” PPI also up 1.0%; jump in goods, services components a “big surprise”; not yet at peak but “still good reasons” easing coming.

Around the end of 2018, the annual inflation rate of the US producer price index (PPI) began a downtrend which continued through 2019. Months in which producer prices increased suggested the trend may have been coming to an end, only for it to continue, culminating in a plunge in April 2020. Figures returned to “normal” towards the end of that year but recent months’ annual rates have been well above the long-term average.

The latest figures published by the Bureau of Labor Statistics indicate producer prices rose by 1.0% after seasonal adjustments in January. The increase was double the 0.5% rise which had been generally expected and significantly more than December’s revised figure of 0.4%. However, on a 12-month basis, the rate of producer price inflation after seasonal adjustments eased from December’s revised rate of 10.0% to 9.8%.

Producer prices excluding foods and energy, or “core” PPI, also rose by 1.0% after seasonal adjustments. The annual rate accelerated from December’s revised rate of 6.5% to 7.2%. (Note “core” PPI in previous reports referred to prices excluding foods, energy and trade services.)

“Rising food and energy prices lifted the headline PPI, but the big surprise was the uptick in the core reading from the jump in both the goods and services components, up 0.8% and 0.7% respectively,” said NAB currency strategist Rodrigo Catril. He pointed to a 1.1% rise in capital equipment prices and “big jumps” in hospital charges as important factors behind the increases.

Long-term US Treasury bond yields rose noticeably on the day. By the close of business, the 10-year Treasury yield had gained 6bps to 2.06% and the 30-year yield had added 7bps to 2.37%. The 2-year yield finished unchanged at 1.58%.

“For now, the narrative is that price pressures have not yet peaked, although there are still good reasons to expect an ease in pressures come April or May and for the remainder of 2022,” Catril added.

The producer price index (PPI) is a measure of prices received by producers for domestically produced goods, services and construction. It is put together in a fashion similar to the consumer price index (CPI) except it measures prices received from the producer’s perspective rather than from the perspective of a retailer or a consumer. It is another one of the various measures of inflation tracked by the US Fed, along with core personal consumption expenditure (PCE) price data.

Something not right in US “hike narrative”; UoM sentiment index falls

11 February 2022

Summary: US consumer confidence softens further in February; University of Michigan index substantially below consensus figure; views of present conditions, future conditions both deteriorate; fall attributed “weakening personal financial prospects”; may be “amber signal” something not right in “hike narrative”.

US consumer confidence started 2020 at an elevated level but, after a few months, surveys began to reflect a growing unease with the global spread of COVID-19 and its reach into the US. Household confidence plunged in April 2020 and then recovered in a haphazard fashion, generally fluctuating at below-average levels according to the University of Michigan. The University’s measure of confidence had recovered back to the long-term average by April 2021 but then it plunged again in the September quarter and has since remained at historically low levels.

The latest survey conducted by the University indicates confidence among US households further softened on average in February. The preliminary reading of the Index of Consumer Sentiment registered 61.7, substantially below the generally expected figure of 67.5 and January’s final figure of 67.2. Consumers’ views of current conditions and expectations regarding future conditions both deteriorated in comparison to those held at the time of the January survey.

“The recent declines have been driven by weakening personal financial prospects, largely due to rising inflation, less confidence in the government’s economic policies and the least favourable long term economic outlook in a decade,” said the University’s Surveys of Consumers chief economist, Richard Curtin. He noted sentiment in higher-income households accounted for the month’s entire deterioration.

US Treasury bond yields moved noticeably lower on the day, reversing much of the previous day’s rises at the long end. By the close of business, the 2-year Treasury yield had shed 7bps to 1.51%, the 10-year yield had lost 9bps to 1.94% while the 30-year yield finished 7bps lower at 2.25%.

NAB senior economist Tapas Strickland said some observers would take the report’s figures “as an amber signal that something is not right in the hike narrative. No doubt inflation and a decline in real wages is a factor.”

Less-confident households are generally inclined to spend less and save more; some decline in household spending could be expected to follow. As private consumption expenditures account for a majority of GDP in advanced economies, a lower rate of household spending growth would flow through to lower GDP growth if other GDP components did not compensate.

“Rampant” inflation; US CPI exceeds expectations in Jan

10 February 2022

Summary: US CPI increases by 0.6% in January, above expectations; “core” rate up 0.6%; CPI “hot”, “broad-based”; Treasury yields jump, rate rise expectations harden; US consumers paying price for “rampant” inflation; rents, non-energy commodities, main drivers of headline rise.

The annual rate of US inflation as measured by changes in the consumer price index (CPI) halved from nearly 3% in the period from July 2018 to February 2019. It then fluctuated in a range from 1.5% to 2.0% through 2019 before rising above 2.0% in the final months of that year. Substantially lower rates were reported from March 2020 to May 2020 and they remained below 2% until March this year. Rates has risen significantly since then.

The latest CPI figures released by the Bureau of Labor Statistics indicated seasonally-adjusted consumer prices increased by 0.6% on average in January. The result was slightly higher than the 0.5% increase which had been generally expected and on par with December’s rise. On a 12-month basis, the inflation rate accelerated from December’s reading of 7.1% to 7.5%.

“Headline” inflation is known to be volatile and so references are often made to “core” inflation for analytical purposes. Core inflation, a measure of inflation which strips out the more variable food and energy components of the index, increased by 0.6% on a seasonally-adjusted basis for the month. As with the headline result, the rise was 0.1 percentage points above the consensus expectation and in line with December’s 0.6% increase. The annual growth rate increased from 5.5% to 6.0%.

“US CPI came in hot with both core and headline one-tenth more than expected. More importantly price pressures were very broad-based,” said NAB senior economist Tapas Strickland.

US Treasury bond yields surged on the day, especially at the short end. By the close of business, the 2-year Treasury yield had jumped 23bps to 1.60%, the 10-year yield had gained 10bps to 2.05% while the 30-year yield finished 8bps higher at 2.33%.

In terms of US Fed policy, expectations for a higher federal funds rate over the next 12 months hardened noticeably. At the close of business, March contracts implied an effective federal funds rate of 0.375%, 29bps higher than the current spot rate while June contracts implied 0.965%. February 2023 futures contracts implied an effective federal funds rate of 1.82%, 174bps above the spot rate.

ANZ economist Kishti Sen noted a “sharp” increase in rental prices over the month and said, “The latest inflation data for the US shows consumers are paying the price for rampant inflation, as the January inflation data far exceeded expectations.”

The largest influence on headline results is often the change in fuel prices. “Energy commodities”, the segment which contains vehicle fuels, declined by 0.8%, subtracting 0.03 percentage points. However, prices of non-energy services, the segment which includes actual and implied rents, had the largest effect in January, adding 0.23 percentage points after they increased by 0.4% on average. Commodities excluding food and energy also had a significant impact after prices rose by 1.0% on average over the month.

Family finances bite; consumer confidence softens in latest Westpac-MI report

09 February 2022

Summary: Household sentiment deteriorates modestly in February; decline in index a surprise given easing Omicron disruptions, improved labour market; touch under long-term average reading; improvements from falling infection, hospitalisation rates “more than offset by increased pressure on family finances”; three of five sub-indices lower; Unemployment Expectations index lower, points to jobless rate falling below 4% over next few months.

After a lengthy divergence between measures of consumer sentiment and business confidence in Australia which began in 2014, confidence readings of the two sectors converged again in mid-July 2018. Both readings then deteriorated gradually in trend terms, with consumer confidence leading the way. Household sentiment fell off a cliff in April 2020 but, after a few months of to-ing and fro-ing, it then staged a full recovery.

According to the latest Westpac-Melbourne Institute survey conducted in the first week of February, household sentiment has again deteriorated modestly. Their Consumer Sentiment Index declined from January’s reading of 102.2 to 100.8, ending a run of slightly-above average readings.

“Given that the health disruptions from the Omicron variant have eased and the labour market has strengthened it is surprising that we did not see some improvement in the Index in February,” said Westpac Chief Economist Bill Evans.

Any reading of the Consumer Sentiment Index above 100 indicates the number of consumers who are optimistic is greater than the number of consumers who are pessimistic. The latest figure is a touch under the long-term average reading of just over 101.

Domestic Treasury bond yields declined modestly on the day despite moderately higher US Treasury yields in overnight trading. By the close of business, the 2-year ACGB yield had slipped 1bp to 1.59%, the 10-year yield had lost 2bps to 2.12% while the 20-year yield finished 1bp lower at 2.60%.

In the cash futures market, expectations of a change in the actual cash rate, currently at 0.05%, softened a little with respect to rate rises in the second half of 2022. At the end of the day, contract prices implied the cash rate would rise gradually from the current rate of 0.050% to 0.14% by May, then increase to 0.555% by August and then to 1.37% by February 2023.

Evans noted improvements related to falling infection and hospitalisation rates have been “more than offset by increased pressure on family finances.” He attributed these pressures to Omicron-related disruptions to household earnings at the start of the year, rising prices and the expectation of higher interest rates.

Three of the five sub-indices registered lower readings, with the “Family finances versus a year ago” sub-index posting the largest monthly percentage loss. Readings for the sub-indices “Economic conditions – next 12 months” and “Economic conditions – next 5 years” both improved.

The Unemployment Expectations index, formerly a useful guide to RBA rate changes, fell from 112.7.1 to 102.8. Lower readings result from fewer respondents expecting a higher unemployment rate in the year ahead.

“Unemployment expectations have been a good indicator of the unemployment rate during the pandemic and points to the risk of the unemployment rate falling below 4% over the next few months; the RBA currently has this pencilled in to occur in Q3 2022,” said NAB senior economist Tapas Strickland.

Business conditions down, confidence up in January

08 February 2022

Summary: Business conditions deteriorate for second month; confidence recovers chunk of December loss; infections trigger consumer caution, staff shortages; firms optimistic outbreak will be short-lived; ANZ data points to recovery in conditions, confidence “will likely grow”; capacity utilisation rate up; 6 of 8 sectors of economy at/above respective long-run averages; inflationary pressures continue.

NAB’s business survey indicated Australian business conditions were robust in the first half of 2018, with a cyclical-peak reached in April of that year. Readings from NAB’s index then began to slip, declining to below-average levels by the end of 2018. Forecasts of a slowdown in the domestic economy began to emerge in the first half of 2019 and the index trended lower, hitting a nadir in April 2020 as pandemic restrictions were introduced. Conditions improved markedly over the next twelve months, only to revert back to more normal levels in the latter part of 2021.

According to NAB’s latest monthly business survey of over 400 firms conducted over the last two weeks of January, business conditions have deteriorated for a second month. NAB’s conditions index registered 3, down from December’s reading of 8.

NAB senior economist Brody Viney said the latest wave of coronavirus infections had “triggered consumer caution and staff shortages” He noted NAB’s indices which track firms’ profitability, trading conditions and employment, all fell.

In contrast, business confidence recovered a good chunk of what was lost in December. NAB’s confidence index rose from December’s reading of -12 to +3, just a few points below the long-term average. Typically, NAB’s confidence index leads the conditions index by approximately one month, although some divergences have appeared in the past from time to time.

“The confidence rebound signals that, despite the disruption, firms were optimistic that the outbreak would be short-lived and, consistent with this, forward order remain steady,” Viney added

Commonwealth Government bond yields increased markedly on the day. By the close of business, the 3-year ACGB yield had gained 8bps to 1.60% while 10-year and 20-year yields both finished 13bps higher at 2.14% and 2.61% respectively.

In the cash futures market, expectations of a change in the actual cash rate, currently at 0.05%, firmed a little in favour of rate rises in the second half of 2022. At the end of the day, contract prices implied the cash rate would rise gradually from the current rate of 0.050% to 0.155% by May, then increase to 0.575% by August and then to 1.395% by February 2023.

ANZ senior economist Adelaide Timbrell said some of her bank’s other economic reports point to a recovery of conditions. “We expect a quick bounce back in February, with both ANZ-Roy Morgan Australian Consumer Confidence and ANZ spending data improving in late January.” She also noted business confidence “will likely grow as the Omicron wave passes its peak.”

NAB’s measure of national capacity utilisation partially recovered from December’s revised figure of 80.7% to 81.6%. Six of the eight sectors of the economy were reported to be operating at or above their respective long-run averages. The retail and recreational/personal services sectors were the exceptions.

Capacity utilisation is generally accepted as an indicator of future investment expenditure and it also has a strong inverse relationship with the unemployment rate.

As with December’s report, there were several references to inflationary pressures. “Cost pressures remained elevated, with purchase cost growth reaching a record 3.4% in quarterly terms. Strong wage bill growth continued while on the output side, final product price inflation remained elevated, although retail price inflation eased somewhat.”

Job ad numbers sign of labour demand resilience in January

07 February 2022

Summary:  Job ads down 0.3% in January; 27.3% higher than same month in 2021; Omicron cases no hindrance to usual post-New Year rebound; ANZ expects job-switching rate to rise, may not have seen advertising peak yet; ads-to-workforce ratio steady at 1.5%.

From mid-2017 onwards, year-on-year growth rates in the total number of Australian job advertisements consistently exceeded 10%. That was until mid-2018 when the annual growth rate fell back markedly. 2019 was notable for its reduced employment advertising and this trend continued into the first quarter of 2020. Advertising plunged in April and May of 2020 as pandemic restrictions took effect but then recovered quite quickly.

According to the latest ANZ figures, total advertisements declined by 0.3% in January on a seasonally-adjusted basis. The fall followed a 5.8% drop in December and a 9.6% gain in November after revisions. On a 12-month basis, total job advertisements were 27.3% higher than in January 2021, down from December’s revised figure of 32.9%.

“Although ANZ Job Ads fell by 0.3% in January, they rose steeply on a weekly basis through the month, as is usual following the seasonal Christmas/New Year low. This was despite the large number of Omicron cases in the community, reflecting the resilience in labour demand and the widespread view that Omicron would only be a temporary setback,” said ANZ senior economist Catherine Birch.

Commonwealth Government bond yields rose on the day, especially at the short end. By the close of business, the 3-year ACGB yield had jumped 7bps to 1.52% while 10-year and 20-year yields both finished 3bps higher at 2.01% and 2.48% respectively.

Birch is expecting advertising to increase in the short-term. “After Omicron, we expect the job-switching rate to rise as workers change to better, higher paying jobs in 2022. This would mean more people quitting their current jobs, which should translate into a greater number of new job ads, raising ANZ Job Ads as well as the National Skills Commission measure. So we may not have seen the peak yet.”

The inverse relationship between job advertisements and the unemployment rate has been quite strong (see below chart), although ANZ themselves called the relationship between the two series into question in early 2019.  A rising number of job advertisements as a proportion of the labour force is suggestive of lower unemployment rates in the near-future while a falling ratio suggests higher unemployment rates will follow.

In 2008/2009, advertisements plummeted and Australia’s unemployment rate jumped from 4% to nearly 6% over a period of 15 months. When a more dramatic fall in advertisements took place in April 2020, the unemployment rate responded much more quickly.

Click for more news