News

US job market “on fire” in January

04 February 2022

Summary: Non-farm payrolls increase by 467,000 in January; considerably more than 180,000 expected; previous two months’ figures revised up by 111K; jobless rate down ticks up to 4.0%, participation rate up from 61.9% to 62.2%; may have been even stronger if not for Omicron surge; implies another strong number in February, US job market as “on fire”; jobs-to-population ratio increases to 59.7%; underutilisation rate falls from 7.3% to 7.1%; annual hourly pay growth speeds up to 5.7%; wages growth acceleration “not sustainable”, may “embolden” FOMC to accelerate rate hikes over 2022.

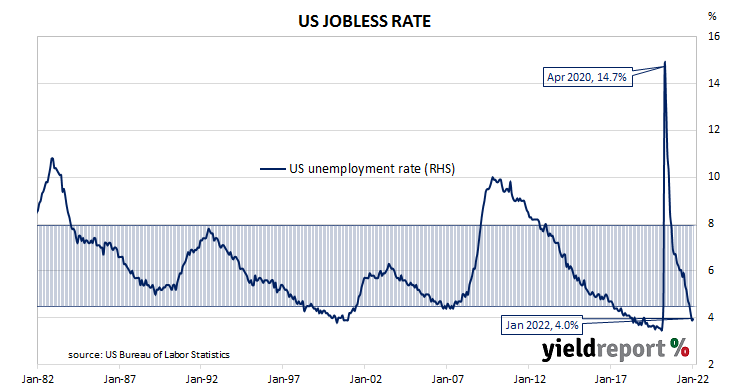
The US economy ceased producing jobs in net terms as infection controls began to be implemented in March 2020. The unemployment rate had been around 3.5% but that changed as job losses began to surge through March and April of 2020. The May 2020 non-farm employment report represented a turning point and subsequent months provided substantial employment gains. Changes in recent months have been generally more modest but usually well above the long-term monthly average.

According to the US Bureau of Labor Statistics, the US economy created an additional 467,000 jobs in the non-farm sector in January. The increase was considerably more than the 180,000 which had been generally expected earlier in the week and not all that much lower than the 510,000 jobs which had been added in December after revisions. Employment figures for November and December were also revised up by a total of 111,000.

The total number of unemployed increased by 194,000 to 6.513 million while the total number of people who are either employed or looking for work increased by 1.393 million to 163.687 million. These changes led to the US unemployment rate ticking up from 3.9% in December to 4.0%. The participation rate rose from December’s revised rate of 61.9% to 62.2%.

“Looking at the details of the report, the US Labor Department noted that payrolls might have been even stronger if not for the surge in Omicron cases with nearly 2 million workers unable to look for work last month because of the pandemic,” said NAB currency strategist NAB Rodrigo Catril.

US Treasury yields jumped on the day. By the close of business, the 2-year yield had gained 11bps to 1.31%, the 10-year yield had added 9bps to 1.92% while the 30-year yield finished 7bps higher at 2.22%.

In terms of US Fed policy, expectations for a higher federal funds rate over the next 12 months hardened noticeably. At the close of business, March contracts implied an effective federal funds rate of 0.265%, 19bps higher than the current spot rate while June contracts implied 0.795%. February 2023 futures contracts implied an effective federal funds rate of 1.515%, 145bps above the spot rate.

“The data were much stronger than expectations and rapidly falling Omicron cases implies another strong number in February,” said ANZ economist Hayden Dimes. He described the US job market as “on fire and providing significant upward pressure on inflation.”

One figure which is indicative of the “spare capacity” of the US employment market is the employment-to-population ratio. This ratio is simply the number of people in work divided by the total US population. It hit a cyclical-low of 58.2 in October 2010 before slowly recovering to just above 61% in late-2019. January’s reading increased from 59.5% to 59.7%, still some way from the April 2000 peak reading of 64.7%.

Wage growth spiked in the US during the early stages of pandemic restrictions as lower-paid jobs disappeared at a faster rate relative to higher-paid jobs, disrupting the usual relationship between wage inflation and unemployment rates. Normally, wages tend to grow as the supply of labour tightens.

Apart from the unemployment rate, another measure of tightness in the labour market is the underutilisation rate. The latest reading of it declined from December’s 7.3% to 7.1%. Wage inflation and the underutilisation rate usually have an inverse relationship and hourly pay growth in the year to January sped up from December’s revised rate of 4.9% to 5.7%.

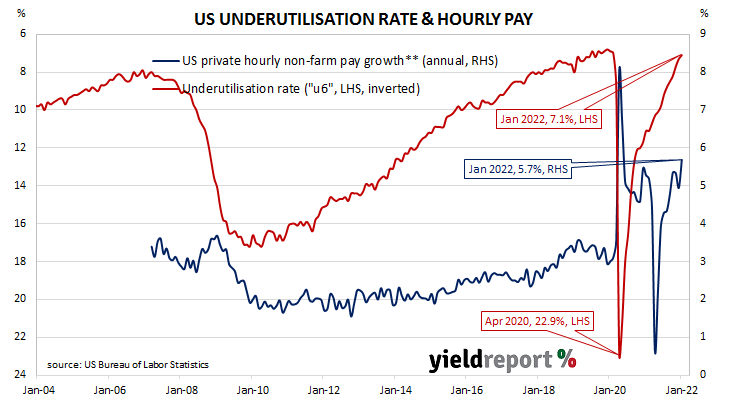
“This acceleration in wages growth is not sustainable and if it is corroborated by upcoming labour market data releases, FOMC officials will be emboldened to accelerate their expected pace of rate hikes over 2022,” noted NAB’s Catril.

Higher dwelling approvals in December “noise”, not sustained lift

03 February 2022

Summary: Home approval numbers up 8.2% in December; above 1.0% decline expected; down 7.5% on annual basis; “noise” rather than beginning of sustained lift; higher cash rate later in 2022 will reduce borrowing capacity, could slow activity; house approvals down 1.4%, apartments up 26.7%; non-residential approvals down 16.3% in dollar terms, residential alterations up 5.2% over month.

Building approvals for dwellings, that is apartments and houses, had been heading south since mid-2018. As an indicator of investor confidence, falling approvals had presented a worrying signal, not just for the building sector but for the overall economy. However, approval figures from late-2019 and the early months of 2020 painted a picture of a recovery taking place, even as late as April of that year. Subsequent months’ figures then trended sharply upwards before easing somewhat in the June and September quarters of 2021.

The Australian Bureau of Statistics has released the latest figures from December and total residential approvals increased by 8.2% on a seasonally-adjusted basis. The rise over the month in contrast to the 1.0% decline which had been generally expected and greater than November’s 2.6% increase. However, total approvals fell by 7.5% on an annual basis, slightly higher than the previous month’s revised figure of -8.2%. Monthly growth rates are often volatile.

“Dwelling approvals had a mixed finish to 2021, posting a better than expected 8.2% rise in the final month of the year but with the detail showing softness outside of a narrowly-based rise in ‘units’ that is more likely to be noise than the beginning of a sustained lift,” said Westpac senior economist Matthew Hassan.

Commonwealth Government bond yields fell on the day. By the close of business, the 3-year ACGB yield had lost 2bps to 1.37% while 10-year and 20-year yields each finished 4bps lower at 1.89% and 2.34% respectively.

“The popularity of working from home and low rates are supporting building approvals. A cash rate hike, expected in September 2022, will reduce borrowing capacity and could slow activity, though even after one or more increases in the cash rate, the borrowing environment remains broadly supportive,” said ANZ senior economist Adelaide Timbrell.

Westpac’s Hassan said if one looks through the monthly volatility, “building approvals more generally have seen a sharp turnaround since May…”

Approvals for new houses declined by 1.4% over the month, repeating November’s fall in percentage terms. On a 12-month basis, house approvals were 20.8% lower than they were in December 2020, down from November’s comparable figure of -10.3%.

Apartment approval figures are usually a lot more volatile and December’s total rose by 26.7% after an 11.2% gain in November. The 12-month growth figure improved from November’s revised rate of -3.9% to +23.5%.

Non-residential approvals fell by 16.3% in dollar terms over the month and by 5.2% on an annual basis. Figures in this segment also tend to be rather volatile.

Residential alteration approvals increased by 5.2% in dollar terms over the month and were 9.9% higher than in December 2020.

Omicron wave hits ADP January report; “temporary setback” may extend into Feb

02 February 2022

Summary: ADP payrolls down 301,000 in January, contrasts with consensus expectation of gain; December increase revised down by 31,000; economists blame wave of omicron infections in survey week; general sense of a temporary setback; history suggests losses not reversed immediately; positions down across firms of all sizes, bias towards small firms; 90% of loss in services sector, led by leisure/hospitality sector.

The ADP National Employment Report is a monthly report which provides an estimate of US non-farm employment in the private sector. Since publishing of the report began in 2006, its employment figures have exhibited a high correlation with official non-farm payroll figures, although a large difference can arise in any individual month.

The latest ADP report indicated private sector employment decreased by 534,000 in January, in contrast with the 208,000 increase which had been generally expected. December’s increase was revised down by 31,000 to 776,000.

Economists laid the blame on the latest wave of omicron infections in the US, with 5 million people reported to have been infected in the survey week.

NAB currency strategist Rodrigo Catril said, “Overall, there is a general sense that this is a temporary setback which arguably could extend into February, making interpretation of the state of the US labour market a difficult task over the near term…” He noted recent history suggests “Covid job losses do not reverse immediately.”

US Treasury yields, with the exception of those at the ultra-long end, moved lower on the day. By the close of business, the 2-year Treasury bond yield had lost 2bps to 1.15%, the 10-year yield had shed 3bps to 1.77% while the 30-year yield finished 4bps higher at 2.16%.

In terms of US Fed policy, expectations for a higher federal funds rate over the next 12 months softened slightly. At the close of business, March contracts implied an effective federal funds rate of 0.215%, 14bps higher than the current spot rate while June contracts implied 0.65%. February 2023 futures contracts implied an effective federal funds rate of 1.335%, 125bps above the spot rate.

Employment numbers in net terms fell across businesses of all sizes, again with a bias towards small firms. Firms with less than 50 employees shed a net 144,000 positions, mid-sized firms (50-499 employees) lost 59,000 positions while large businesses (500 or more employees) accounted for 98,000 fewer employees.

Employment at service providers accounted for just over 90% of the total net decrease, or 274,000 positions. The “Leisure & Hospitality” sector was the largest single source of losses, with 154,000 fewer positions. The “Trade, Transportation & Utilities” sector was also a significant source, losing 62,000 positions. Total jobs among goods producers decreased by a net 27,000 positions.

Prior to the ADP report, the consensus estimate of the change in January’s non-farm employment figure was +178,000. ANZ economist John Bromhead said these latest figures, in conjunction with initial unemployment claims, “has resulted in a wave of downward revisions for Friday’s official nonfarm payrolls release, which is now widely expected to show a negative number.”

The non-farm payroll report will be released by the Bureau of Labor Statistics this coming Friday night (AEST), 4 February.

Tight US job market confirmed by latest JOLTS report

01 February 2022

Summary: US quit rate falls back to 2.9% in December; JOLTS figures does little to dissuade view of tightness in US jobs market; points to “very strong labour demand”, “high worker confidence”; quits, separations down, job openings up; “soft” non-farm, ADP reports expected, likely to be “temporary blip”.

The number of US employees who quit their jobs as a percentage of total employment increased slowly but steadily after the GFC. It peaked in March 2019 and then tracked sideways until virus containment measures were introduced in March 2020. The quit rate then plummeted as alternative employment opportunities rapidly dried up. Following the easing of US pandemic restrictions, it proceeded to recover back to its pre-pandemic rate in the third quarter of 2020 before trending higher through 2021.

Figures released as part of the most recent Job Openings and Labor Turnover Survey (JOLTS) report show the quit rate fell back in December after it made a new series-high in November. 2.9% of the non-farm workforce left their jobs voluntarily, down from November’s 3.0%. There were 16,000 fewer quits during the month and an additional 651,000 people employed in the non-farm sector, leading to a fall in percentage terms.

“The JOLTS report was also out last night and, after Fed Chair explicit reference to the report last week as evidence of a tight labour market, the overnight update has done little to dissuade this view,” said NAB currency strategist Rodrigo Catril.

The report was released on the same day as the ISM’s January PMI report but US Treasury yields barely moved on the day. By the close of business, the 2-year Treasury bond yields had slipped 1bp to 1.17%, the 10-year yield had inched up 1bp to 1.80% while the 30-year yield finished unchanged at 2.12%.

In terms of US Fed policy, expectations for a higher federal funds rate over the next 12 months softened slightly. At the close of business, March contracts implied an effective federal funds rate of 0.22%, 14bps higher than the current spot rate while June contracts implied 0.665%. February 2023 futures contracts implied an effective federal funds rate of 1.345%, 126bps above the spot rate.

“The US December JOLTS report pointed to very strong labour demand and high worker confidence in finding new, better-paying jobs. It’s all pointing one way; higher wages and sticky inflation,” said ANZ senior economist Catherine Birch.

The fall in total quits was led by 89,000 fewer resignations in the “Health care and social assistance” sector and 64,000 fewer resignations in the “Accommodation and food services” sector. The “Retail trade” sector experienced the single largest increase, rising by 52,000. Overall, the total number of quits for the month fell from November’s revised figure of 4.499 million to 4.338 million.

In contrast, total vacancies at the end of December increased by 150,000, or 1.4%, from November’s revised figure of 10.775 million to 10.925 million. The rise was driven by a 133,000 increase in the “Accommodation and food services” sector while the “Finance & insurance” sector experienced the single largest decline, falling by 89,000. Overall, 11 out of 18 sectors experienced more job openings than in the previous month.

Total separations decreased by 305,000, or 4.9%, from November’s revised figure of 6.205 million to 5.900 million. The fall was led by the “Accommodation and food services” sector, where there were 65,000 fewer separations than in November. Separations decreased in 13 out of 18 sectors.

The “quit” rate time series produced by the JOLTS report is a leading indicator of US hourly pay. As wages account for around 55% of a product’s or service’s price in the US, wage inflation and overall inflation rates tend to be closely related. Former Federal Reserve chief and current Treasury Secretary Janet Yellen was known to pay close attention to it.

“The market is looking for a soft Omicron-impacted non-farm and ADP reports this week [and] the JOLTS survey supports the view that this is likely to only be a temporary blip,” NAB’s Catril added.

ISM PMI slips in January; supply chain disruptions ease

01 February 2022

Summary: ISM PMI declines from 58.8% to 58.0% in January, essentially in line with consensus expectation; supply-chain issues continue; key measures of supply chain disruptions ease again; latest reading implies 4.2% 12-month US GDP growth rate in June.

The Institute of Supply Management (ISM) manufacturing Purchasing Managers Index (PMI) reached a cyclical peak in September 2017. It then started a downtrend which ended in March 2020 with a contraction in US manufacturing which lasted until June 2020. Subsequent month’s readings implied growth had resumed, with the index becoming stronger through to March 2021. Since then, readings have remained at elevated levels despite recent declines.

According to the ISM’s January survey, its PMI recorded a reading of 57.6%, essentially in line with the generally expected figure of 58.0% but also a little lower than December’s 58.8%. The average reading since 1948 is 53.0% and any reading above 50% implies an expansion in the US manufacturing sector relative to the previous month.

Timothy Fiore, Chair of the ISM’s Manufacturing Business Survey Committee, said the US manufacturing sector continued to be constrained by supply-chain issues “but January was the third straight month with indications of improvements in labour resources and supplier-delivery performance.”

The report was released on the same day as the December JOLTS report but US Treasury yields were barely moved on the day. By the close of business, the 2-year Treasury bond yields had slipped 1bp to 1.17%, the 10-year yield had inched up 1bp to 1.80% while the 30-year yield finished unchanged at 2.12%.

In terms of US Fed policy, expectations for a higher federal funds rate over the next 12 months softened slightly. At the close of business, March contracts implied an effective federal funds rate of 0.22%, 14bps higher than the current spot rate while June contracts implied 0.665%. February 2023 futures contracts implied an effective federal funds rate of 1.345%, 126bps above the spot rate.

“Looking at some of the sub-indices, the key measures of supply chain disruptions eased again, notably the order backlogs index falling over 6 points to a 15-month low. Prices paid jumped nearly 8 points but this can be put down to the rise in oil prices,” said NAB currency strategist Rodrigo Catril.

Purchasing managers’ indices (PMIs) are economic indicators derived from monthly surveys of executives in private-sector companies. They are diffusion indices, which means a reading of 50% represents no change from the previous period, while a reading under 50% implies respondents reported a deterioration on average.According to the ISM’s latest announcement, a reading “above 48.7%, over a period of time, generally indicates an expansion of the overall economy.”

The ISM’s manufacturing PMI figures appear to lead US GDP by several months despite a considerable error in any given month. The chart below shows US GDP on a “year on year” basis (and not the BEA annualised basis) against US GDP implied by monthly PMI figures.

According to the ISM and its analysis of past relationships between the PMI and US GDP, January’s PMI corresponds to an annualised growth rate of 3.1%, or 0.8% over a quarter. Regression analysis on a year-on-year basis suggests a 12-month GDP growth rate of 4.2% five months after this latest report.

The ISM index is one of two monthly US PMIs, the other being an index published by IHS Markit. IHS Markit also produces a “flash” estimate in the last week of each month which comes out about a week before the ISM index is published. The IHS Markit January flash manufacturing PMI registered 55.0%, 2.7 percentage points lower than December’s final figure.

December home loan approvals hit new high

01 February 2022

Number of home loan approvals up 1.5% in December; value of loan commitments up 4.4%; total value of approvals hits new cycle high; value of owner-occupier loan approvals up 5.3%, investor approvals up 2.4%; “growing risk” lending resurgence continues in first half of 2022.

After the RBA reduced its cash rate target in a series of cuts beginning in mid-2019 the number and value of approvals began to noticeably increase, potentially ending the downtrend which had been in place since mid-2017. Figures from February through to May of 2020 provided an indication the downtrend was still intact but subsequent figures then pushed both back to elevated levels.

December’s housing finance figures have now been released and the total number of loan commitments (excluding refinancing loans) to owner-occupiers rose by 1.5%. The increase was smaller than November’s 4% rise, taking the annual growth rate from November’s figure of 1.0% to -3.4%.

The figures were released on the same day as December’s preliminary retails sales report and the RBA Board’s latest monetary policy announcement. Commonwealth Government bond yields barely changed on the day and, by the close of business, the 3-year ACGB yield had inched up 1bp to 1.38%, the 10-year yield had returned to its starting point at 1.92% and the 20-year yield had slipped 1bp to 2.39%.

In dollar terms, total loan approvals excluding refinancing increased by 4.4% over the month, considerably more than the 0.8% decline which had been generally expected but not quite as large as November’s 6.3%. On a year-on-year basis, total approvals excluding refinancing increased by 26.5%, down from the previous month’s 33.2%.

“At $32.8 billion, the total value of approvals hit a new cycle high, up 11% on the ‘delta lockdown’ low in October but only marginally above its May peak. That compares to the total value of property sales, which finished 2021 nearly 20% above its mid-year peak, suggesting rise in finance approvals still has some way to go,” said Westpac senior economist Matthew Hassan.

The total value of owner-occupier loan commitments excluding refinancing increased by 5.3%, a little less than November 7.6%. On an annual basis, owner-occupier loan commitments were 12.4% higher than in December 2020, whereas November’s annual growth figure was 17.2%.

The total value of investor commitments excluding refinancing arrangements increased by 2.4%. The rise follows a 3.8% increase in November and it is the fourteenth month of consecutive gains since the last monthly decline in October 2020. On an annual basis, the value of loan commitments in the month was 73.9% higher than in December 2020, down from 86.9% in November.

“There is a growing risk that the resurgence of lending could continue in the first half of 2022, as low rates of unemployment and likely stronger savings rates during Omicron support borrowing. If lending continues at this pace, APRA may consider more measures to slow it,” said ANZ senior economist Adelaide Timbrell.

December credit growth surges; “headwinds” building

31 January 2022

Summary: Private sector credit grows by 0.8% in December, above +0.6% expected; annual growth rate rises from 6.6% to 7.2%; business lending “key factor” driving credit surge; credit growth likely “robust over coming months” but headwinds building; business loans account for nearly half net growth, owner-occupier loans another third; investor lending accelerates, personal loans down.

The pace of lending to the non-bank private sector by financial institutions in Australia followed a steady-but-gradual downtrend from late-2015 through to early 2020 before hitting what appears to be a nadir in March 2021. Recent months’ figures indicate the downtrend is over and annual growth rates are now above the peak rate seen in the middle of the last economic expansion.

According to the latest RBA figures, private sector credit growth increased by 0.8% in December. The result was above the generally expected figure of 0.6% but lower than November’s 1.0% increase after it was revised up. On an annual basis, the growth rate increased from 6.6% to 7.2%.

“As occurred in early 2020, businesses during the delta outbreak accessed lines of credit to help ease cash flow pressures during lockdown. This was a key factor driving the surge in credit,” said Westpac senior economist Andrew Hanlan.

Commonwealth Government bond yields fell on the day, especially at the short end. By the close of business, the 3-year ACGB yield had shed 10bps to 1.37%, the 10-year yield had lost 4bps to 1.92% while the 20-year yield finished 5bps lower at 2.40%.

In the cash futures market, expectations of any material change in the actual cash rate, currently at 0.05%, remained fairly soft until May. At the end of the day, contract prices implied the cash rate would not exceed the RBA’s 0.10% target rate until April 2022 and then rise to 0.29% by June. February 2023 contracts implied a cash rate of 1.26%.

“We expect credit growth will remain robust over coming months. Headwinds are building however, in particular the business disruption from Omicron and slowing housing market. These should see a deceleration in credit growth from Q2 this year,” said Morgan Stanley Australia equity strategist Chris Read.

Business loans accounted for nearly one half of the net growth over the month, while owner-occupier loans accounted for just over a third. Investor loan growth accelerated while total personal debt shrank.

The traditional driver of loan growth rates, the owner-occupier segment, grew by 0.8% over the month, in line with November’s increase. The sector’s 12-month growth rate sped up from 9.3% to 9.6%.

Total lending in the business sector grew by 1.1%, well above the long-term monthly average but noticeably less than November’s 1.6% increase. The segment’s annual growth rate increased from 7.3% to 8.4%.

Monthly growth in the investor-lending segment slowed to a halt in early 2018. Shortly into the 2019/20 financial year, monthly growth rates slipped into the red before posting a series of flat or near-flat results until late 2020. Growth rates became positive again from December 2020. In December, net lending grew by 0.5%, slightly faster than November’s 0.4%. The 12-month growth rate accelerated from November’s 3.0% to 3.4%.

Total personal loans fell by 0.8% in December, in contrast to a 0.6% rise in November, taking the annual contraction rate from 3.5% to 3.8%. This category of debt includes fixed-term loans for large personal expenditures, credit cards and other revolving credit facilities.

Inflation Gauge back to 3% in January

31 January 2022

Summary: Melbourne Institute Inflation Gauge index up 0.4% in January; index up 3.0% on annual basis; bond yields fall, especially at short end; cash futures imply rate rise by June.

The Melbourne Institute’s Inflation Gauge is an attempt to replicate the ABS consumer price index (CPI) on a monthly basis. It has turned out to be a reliable leading indicator of the CPI, although there are periods in which the Inflation Gauge and the CPI have diverged for as long as twelve months. On average, the Inflation Gauge’s annual rate tends to overestimate the ABS rate by around 0.1%.

The Melbourne Institute’s latest reading of its Inflation Gauge index indicates consumer inflation increased by 0.4% in January. The rise follows a 0.2% increase in December and a 0.3% increase in November. On an annual basis, the index rose by 3.0%, up from December’s 2.8%.

The reading was released on the same day as ANZ’s latest Job Ads report and Commonwealth Government bond yields fCommonwealth Government bond yields fell on the day, especially at the short end. By the close of business, the 3-year ACGB yield had shed 10bps to 1.37%, the 10-year yield had lost 4bps to 1.92% while the 20-year yield finished 5bps lower at 2.40%.

In the cash futures market, expectations of any material change in the actual cash rate, currently at 0.05%, remained fairly soft until May. At the end of the day, contract prices implied the cash rate would not exceed the RBA’s 0.10% target rate until April 2022 and then rise to 0.29% by June. February 2023 contracts implied a cash rate of 1.26%.

Central bankers desire a certain level of inflation which is “sufficiently low that it does not materially distort economic decisions in the community” but high enough so it does not constrain “a central bank’s ability to combat recessions.” Hence the relatively recent obsession among central banks, including the RBA, to increase inflation.

Highest US core PCE inflation since 1983 in December

28 January 2022

Summary: US Fed’sfavoured inflation measure increases by 0.5% in December; in line with expectations; annual rate accelerates from 4.7% to 4.9%; highest core reading since September 1983; Treasury bond yields down moderately.

One of the US Fed’s favoured measures of inflation is the change in the core personal consumption expenditures (PCE) price index. After hitting the Fed’s target at the time of 2.0% in mid-2018, the annual rate then hovered in a range between 1.8% and 2.0% before it eased back to a range between 1.5% and 1.8% through 2019. It then plummeted below 1.0% in April 2020 before rising back to around 1.5% in the September quarter of that year. It has since ran up well above 3% during the June and September quarters.

The latest figures have now been published by the Bureau of Economic Analysis as part of the December personal income and expenditures report. Core PCE prices rose by 0.5% over the month, in line with expectations as well as November’s increase. On a 12-month basis, the core PCE inflation rate accelerated from November’s revised rate of 4.7% to 4.9%.

“That was the highest PCE data on a headline and core basis since February 1982 and September1983 respectively,” said ANZ Head of Australian Economics David Plank.

US Treasury bond yields fell moderately on the day. By the close of business, 2-year and 10-year Treasury bond yields had both shed 3bps to 1.16% and 1.77% respectively while the 30-year yield finished 2bps lower at 2.07%.

In terms of US Fed policy, expectations for a higher federal funds rate over the next 12 months softened slightly with respect to months prior to July but hardened a little with respect to later months. At the close of business, March contracts implied an effective federal funds rate of 0.225%, 15bps higher than the current spot rate while June contracts implied 0.665%. February 2023 futures contracts implied an effective federal funds rate of 1.335%, 125bps above the spot rate.

The core version of PCE strips out energy and food components, which are volatile from month to month, in an attempt to identify the prevailing trend. It is not the only measure of inflation used by the Fed; the Fed also tracks the Consumer Price Index (CPI) and the Producer Price Index (PPI) from the Department of Labor. However, it is the one measure which is most often referred to in FOMC minutes.

WBC-MI leading index languishes in negative territory for fourth month

27 January 2022

Summary:  Leading index growth rate up a little in December, still negative; reflects “high degree of uncertainty” around near-term outlook; strong reopening forces from December quarter currently impacted by omicron spread; reading implies annual GDP growth of around 2.50% during June/September quarters; Westpac raises December quarter GDP forecast to 2.6%, cuts March quarter to zero.

Westpac and the Melbourne Institute describe their Leading Index as a composite measure which attempts to estimate the likely pace of Australian economic growth in the short-term. After reaching a peak in early 2018, the index trended lower through 2018 and 2019 before plunging to recessionary levels in the second quarter of 2020. Subsequent readings were markedly higher but more-recent readings have steadily declined.

The December reading of the six month annualised growth rate of the indicator registered -0.15%, up a little from November’s -0.19%. This latest report marks the fourth consecutive month of negative readings for the index.

“The Index growth rate remains in slight negative territory in December, consistent with the high degree of uncertainty around the near-term outlook as the strong reopening forces we saw in the December quarter are impacted by the current spectacular spread of Omicron,” said Westpac Chief Economist Bill Evans.

Index figures represent rates relative to “trend” GDP growth, which is generally thought to be around 2.75% per annum. The index is said to lead GDP by up to nine months, so theoretically the current reading represents an annual GDP growth rate of around 2.50% in the second or third quarters of 2022.

Domestic Treasury bond yields generally moved lower on the day, despite substantial rises in US Treasury yields overnight. By the close of business, the 2-year ACGB yield had lost 3bps to 1.52% and the 10-year yield had shed 8bps to 1.98%. The 20-year yield finished unchanged at 2.56%.

Westpac has recently raised its GDP growth forecast for the December quarter from 2.2% to 2.6% on the back of retail sales figures from October and November. However, the bank also cut its March quarter forecast from 2.3% to zero.

Click for more news