News

November home loan approvals up, near record highs

14 January 2022

Summary: Number of home loan approvals up 4.0% in November; value of loan commitments up 6.3%; approvals excluding refinancing near record highs; ANZ expects rate rises to trigger material fall in lending eventually; value of owner-occupier loan approvals up 7.6%, investor approvals up 3.8%; rate rises to trigger “material fall in lending” eventually.

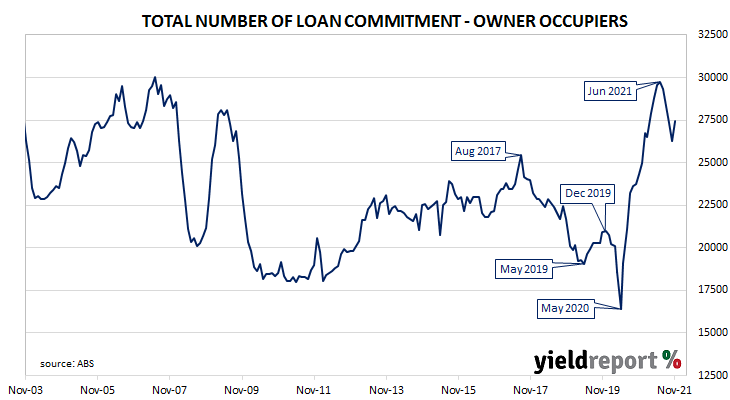
After  the RBA reduced its cash rate target in a series of cuts beginning in mid-2019 the number and value of approvals began to noticeably increase, potentially ending the downtrend which had been in place since mid-2017. Figures from February through to May of 2020 provided an indication the downtrend was still intact but subsequent figures then pushed both back to elevated levels.

November’s housing finance figures have now been released and the total number of loan commitments (excluding refinancing loans) to owner-occupiers increased by 4.0%. The rise reversed October’s 4% fall and took the annual growth rate from October’s figure of 0.6% to 1.0%.

Commonwealth Government bond yields finished the day higher at the short end but lower elsewhere. By the close of business, the 3-year ACGB yield had added 3bps to 1.29% while the 10-year yield had slipped 1bp to 1.88% and the 20-year yield had lost 2bps to 2.40%.

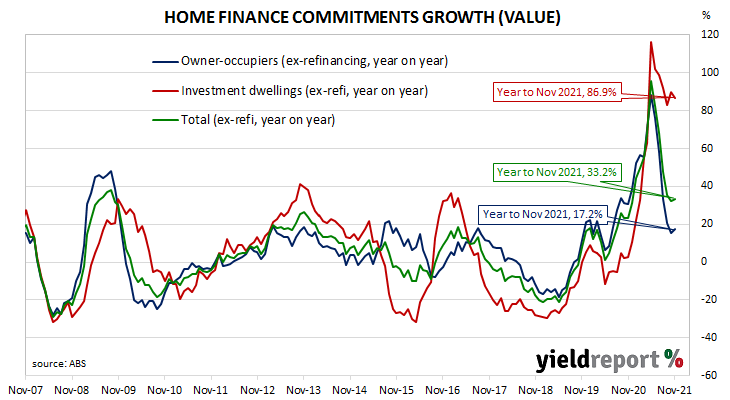
In dollar terms, total loan approvals excluding refinancing increased by 6.3% over the month, considerably more than the 0.4% rise which had been generally expected and in contrast with October’s -2.5%. On a year-on-year basis, total approvals excluding refinancing increased by 33.2%, marginally faster than the previous month’s comparable figure of 32.2%.

“Overall housing finance approvals excluding refinancing are near record highs and are an incredible 64.4% above their pre-pandemic February 2020 levels. The composition of loans has tilted slightly towards a greater investor share, though the investor share overall at 32% is still below the historical average of 36%,” said NAB senior economist Tapas Strickland.

ANZ senior economist Adelaide Timbrell said ANZ expects rate rises “to eventually trigger a material fall in lending”, noting fixed mortgage rates “are already rising”.  

The total value of owner-occupier loan commitments excluding refinancing increased by 7.6%, in contrast to October’s -4.1%. On an annual basis, owner-occupier loan commitments were 17.2% higher than in November 2020, whereas October’s annual growth figure was 15.1%.

The total value of investor commitments excluding refinancing arrangements increased by 3.8%. The rise follows a 1.1% increase in October and it is the thirteenth month of consecutive gains since the last monthly decline in October 2020. On an annual basis, the value of loan commitments in the month was 86.9% higher than in November 2020, down from 89.6% in October. 

“Some indications” US prices near peak after December PPI report

13 January 2022

Summary: Prices received by US producers (PPI) rise by 0.2% in December, half 0.4% expected; annual rate eases from 9.9% to 9.8%; “core” PPI increases by 0.5%; lower fuel, food prices helping; “some indications” prices near peak.

Around the end of 2018, the annual inflation rate of the US producer price index (PPI) began a downtrend which continued through 2019. Months in which producer prices increased suggested the trend may have been coming to an end, only for it to continue, culminating in a plunge in April 2020. Figures returned to “normal” towards the end of that year but recent months’ annual rates have been well above the long-term average.

The latest figures published by the Bureau of Labor Statistics indicate producer prices rose by 0.2% after seasonal adjustments in December. The increase was half the 0.4% rise which had been generally expected and much less than November’s revised figure of 1.0%. On a 12-month basis, the rate of producer price inflation after seasonal adjustments eased from November’s revised rate of 9.9% to 9.8%.

PPI inflation excluding foods and energy, or “core” PPI inflation, rose by 0.5% after seasonal adjustments, in line with expectations but less than November’s 0.9% rise. The annual rate accelerated from November’s revised rate of 8.0% to 8.3%.

“Lower gas prices are helping to reduce inflation. Food prices also fell 0.6% following recent lifts. New vehicle prices are still elevated due to a lack of inventory but vehicle prices are expected to ease soon,” said ANZ economist Kishti Sen. He noted “there are some indications that prices may now be near their peak.”

US Treasury bond yields fell on the day. By the close of business, the 2-year Treasury yield had lost 2bps to 0.89%, the 10-year yield had shed 4bps to 1.70% while the 30-year yield finished 5bps lower at 2.03%.

The producer price index (PPI) is a measure of prices received by producers for domestically produced goods, services and construction. It is put together in a fashion similar to the consumer price index (CPI) except it measures prices received from the producer’s perspective rather than from the perspective of a retailer or a consumer. It is another one of the various measures of inflation tracked by the US Fed, along with core personal consumption expenditure (PCE) price data.

US CPI tops 7%; “no evidence inflation pressures abating”

12 January 2022

Summary: US CPI increases by 0.5% in December, above expectations; “core” rate up 0.6%, as above expected figure; “no evidence inflation pressures abating”; US inflation yet to peak as labour market tightens further, wage pressures grow; non-energy commodities, rents main drivers of headline rise.

The annual rate of US inflation as measured by changes in the consumer price index (CPI) halved from nearly 3% in the period from July 2018 to February 2019. It then fluctuated in a range from 1.5% to 2.0% through 2019 before rising above 2.0% in the final months of that year. Substantially lower rates were reported from March 2020 to May 2020 and they remained below 2% until March this year. Rates has risen significantly since then.

The latest CPI figures released by the Bureau of Labor Statistics indicated seasonally-adjusted consumer prices increased by 0.5% on average in December. The result was above 0.1 percentage points above the consensus expectation but lower than November’s 0.8% rise. On a 12-month basis, the inflation rate accelerated from November’s seasonally adjusted reading of 6.9% to 7.1%.

“Headline” inflation is known to be volatile and so references are often made to “core” inflation for analytical purposes. Core inflation, a measure of inflation which strips out the more variable food and energy components of the index, increased by 0.6% on a seasonally-adjusted basis for the month. As with the headline result, the rise was 0.1 percentage points above the consensus expectation and November’s 0.5% increase. The annual growth rate increased from 5.0% to 5.5%.

There is no evidence that inflation pressures are abating. Energy prices declined slightly in December but pressures have broadened significantly beyond this, with core goods and services prices all surging,” said ANZ economist John Bromhead.

US Treasury bond yields barely moved on the day. By the close of business, the 2-year Treasury yield had inched up 1bp to 0.91%, the 10-year yield had returned to its starting point at 1.74% while the 30-year yield finished 1bp higher at 2.08%.

In terms of US Fed policy, expectations of any change in the federal funds range over the next 12 months softened slightly. January 2023 futures contracts implied an effective federal funds rate of 0.965%, nearly 90bps above the spot rate but just 0.5bps higher than at the end of the previous day.

Bromhead thinks US inflation is yet to peak as “pressures are likely to intensify as the labour market tightens further and wage pressures grow.” He expects US inflation to remain “in a 7.0%-8.0% range for quite a few months to come.”

The largest influence on headline results is often the change in fuel prices. “Energy commodities”, the segment which contains vehicle fuels, declined by 0.6%, subtracting 0.03 percentage points. However, prices of commodities excluding food and energy had the largest effect in December, adding 0.25 percentage points after they increased by 1.2% on average. Non-energy services, the segment which includes actual and implied rents, also had a significant impact after prices rose by 0.3% on average over the month.

Euro-zone industrial output up 2.3% in November

12 January 2022

Summary: Euro-zone industrial production increases by 2.3% in November; more than 0.3% expected figure; annual growth rate slows to -1.5%; production up in only one of euro-zone’s four largest economies.

Following a recession in 2009/2010 and the debt-crisis which flowed from it, euro-zone industrial production recovered and then reached a peak four years later in 2016. Growth rates then fluctuated for two years before beginning a steady and persistent slowdown from the start of 2018. That decline was transformed into a plunge in March and April of 2020 which then took over a year to claw back. However, production levels have since slid back below those from late 2019.

According to the latest figures released by Eurostat, euro-zone industrial production increased by 2.3% in November on a seasonally-adjusted and calendar-adjusted basis. The rise was considerably larger than the 0.3% increase which had been generally expected and in contrast to October’s 1.3% fall after revisions. However, the calendar-adjusted growth rate on an annual basis slowed from October’s revised rate of 0.2% to -1.5%.

German and French sovereign bond yields did not move on the day. By the close of business, German and French 10-year bond yields had each returned to their starting points at -0.07% and 0.27% respectively.

Industrial production expanded in only one of the euro-zone’s four largest economies. Germany’s production contracted by 0.1% while the growth figures for France and Spain were -0.5% and 0.8% respectively. Italy’s figure was unavailable.

Inflation Gauge slows, implies 2.7% annual rate for Dec quarter CPI

10 January 2022

Summary: Melbourne Institute Inflation Gauge index up 0.2% in December; index up 2.8% on annual basis; bond yields rise; implies 0.5% rise for official December quarter figure.

The Melbourne Institute’s Inflation Gauge is an attempt to replicate the ABS consumer price index (CPI) on a monthly basis. It has turned out to be a reliable leading indicator of the CPI, although there are periods in which the Inflation Gauge and the CPI have diverged for as long as twelve months. On average, the Inflation Gauge’s annual rate tends to overestimate the ABS rate by around 0.1%.

The Melbourne Institute’s latest reading of its Inflation Gauge index indicates consumer inflation increased by 0.2% in December. The rise follows a 0.3% increase in November and a 0.2% increase in October. On an annual basis, the index rose by 2.8%, down from November’s 3.1%.

Commonwealth Government bond yields rose on the day. By the close of business, the 3-year ACGB yield had added 2bps to 1.29% while 10-year and 20-year yields each finished 6bps higher at 1.95% and 2.48% respectively.

Given the Inflation Gauge’s tendency to overestimate, the latest figures imply an official CPI reading of 0.5% (seasonally adjusted) for the December quarter or 2.7% in annual terms. However, it is worth noting the annual CPI rate to the end of June was 3.7% while the Inflation Gauge had implied a 3.0% annual rate at the time.

Dwelling approval numbers up in November but declines likely ahead

10 January 2022

Summary: Home approval numbers up 3.6% in November; slightly larger than 3.0% expected; down 7.7% on annual basis; “not necessarily beginning of upward trend”; ANZ: approvals have some chance of holding up but “bigger risks” looking further out; NAB: “further declines likely”; house approvals up 1.7%, apartment up 7.5%; non-residential approvals up 28.3% in dollar terms, residential alterations down 0.8% over month.

Building approvals for dwellings, that is apartments and houses, had been heading south since mid-2018. As an indicator of investor confidence, falling approvals had presented a worrying signal, not just for the building sector but for the overall economy. However, approval figures from late-2019 and the early months of 2020 painted a picture of a recovery taking place, even as late as April of that year. Subsequent months’ figures then trended sharply upwards before easing somewhat in the June and September quarters of 2021.

The Australian Bureau of Statistics has released the latest figures from November and total residential approvals increased by 3.6% on a seasonally-adjusted basis. The rise over the month was slightly larger than the 3.0% increase which had been generally expected and in contrast with October’s 13.6% drop. Total approvals fell by 7.7% on an annual basis, up from the previous month’s revised figure of -8.2%. Monthly growth rates are often volatile.

“While this was stronger than expected, it is not necessarily the beginning of an upward trend,” said ANZ senior economist Adelaide Timbrell.

Commonwealth Government bond yields rose on the day. By the close of business, the 3-year ACGB yield had added 2bps to 1.29% while 10-year and 20-year yields each finished 6bps higher at 1.95% and 2.48% respectively.

Timbrell thinks approval numbers have some chance of holding up given the popularity of working from home and higher savings rates in the presence of reduced consumer spending. However, “there are bigger risks to building approvals looking further out, in particular higher interest rates.”

NAB economist Taylor Nugent was more pessimistic. “Further declines [from the April peak] are likely given the ongoing fall in loan approvals for new construction.”

Approvals for new houses increased by 1.7% over the month after rising by 3.7% in October after revisions. On a 12-month basis, house approvals were 8.1% lower than they were in November 2020, down from October’s comparable figure of -4.9%.

Apartment approval figures are usually a lot more volatile and November’s total rose by 7.5% after a 36.5% drop in October. The 12-month growth figure improved from October’s revised rate of -14.6% to -6.9%.

Non-residential approvals increased by 28.3% in dollar terms over the month and by 27.9% on an annual basis. Figures in this segment also tend to be rather volatile.

Residential alteration approvals declined by 0.8% in dollar terms over the month but were 11.4% higher than in November 2020.

US jobless rate under 4% in December

07 January 2022

Summary: Non-farm payrolls increase by 199K in December; considerably less than 450K expected; previous two months’ figures revised up by 141K; jobless rate down to 3.9%, participation rate revised up to 61.9%; inflationary pressures building “rapidly” in US jobs market; jobs-to-population ratio increases to 59.5%; underutilisation rate falls from 7.7% to 7.3%; annual hourly pay growth slows to 4.7%; lack of available employees “adding to underlying inflation pressures.”

The US economy ceased producing jobs in net terms as infection controls began to be implemented in March 2020. The unemployment rate had been around 3.5% but that changed as job losses began to surge through March and April of 2020. The May 2020 non-farm employment report represented a turning point and subsequent months provided substantial employment gains. Changes in recent months have been generally more modest but usually well above the long-term monthly average.

According to the US Bureau of Labor Statistics, the US economy created an additional 199,000 jobs in the non-farm sector in December. The increase was considerably less than the 450,000 which had been generally expected earlier in the week and not quite as large as 249,000 jobs which had been added in November after revisions. However, employment figures for October and November were also revised up by a total of 141,000.

The total number of unemployed decreased by 483,000 to 6.319 million while the total number of people who are either employed or looking for work increased by 168,000 to 162.294 million. These changes led to a fall in the US unemployment rate from November’s 4.2% to 3.9%. The participation rate remained unchanged from November’s revised rate of 61.9% after it was revised up from 61.8%.

“The fall in the unemployment rate and rise in earnings show inflationary pressures are building rapidly in the labour market,” said ANZ economist Hayden Dimes.

Longer-term US Treasury yields rose moderately on the day. By the close of business, 10-year and 30-year yields had each gained 4bps to 1.77% and 2.12% respectively. The 2-year yield finished unchanged at 0.87%.

In terms of US Fed policy, expectations of any change in the federal funds range over the next 12 months softened slightly. January 2023 futures contracts implied an effective federal funds rate of 0.92%, 84bps above the spot rate but 2bps lower than at the end of the previous day.

One figure which is indicative of the “spare capacity” of the US employment market is the employment-to-population ratio. This ratio is simply the number of people in work divided by the total US population. It hit a cyclical-low of 58.2 in October 2010 before slowly recovering to just above 61% in late-2019. December’s reading increased from 59.3% to 59.5%, still some way from the April 2000 peak reading of 64.7%.

Wage growth spiked in the US during the early stages of pandemic restrictions as lower-paid jobs disappeared at a faster rate relative to higher-paid jobs, disrupting the usual relationship between wage inflation and unemployment rates. Normally, wages tend to grow as the supply of labour tightens.

Apart from the unemployment rate, another measure of tightness in the labour market is the underutilisation rate. In December, this measure fell from 7.7% after revisions to 7.3%. Wage inflation and the underutilisation rate usually have an inverse relationship but this month hourly pay growth in the 12 months to December slowed from November’s revised rate of 5.1% to 4.7%.

Dimes noted total employment in the US is still short of the pre-pandemic peak but a lack of available employees was “adding to underlying inflation pressures.”

State-based differences evident in latest consumer sentiment index

15 December 2021

Summary: Household sentiment declines slightly in December; “clear difference” between NSW, Vic and Qld, WA, SA; still above long-term average; more negative responses to inflation, interest rates this year; three of five sub-indices lower.

After a lengthy divergence between measures of consumer sentiment and business confidence in Australia which began in 2014, confidence readings of the two sectors converged again in mid-July 2018. Both readings then deteriorated gradually in trend terms, with consumer confidence leading the way. Household sentiment fell off a cliff in April 2020 but, after a few months of to-ing and fro-ing, it then staged a full recovery.

According to the latest Westpac-Melbourne Institute survey conducted in the week beginning 6 December, household sentiment has deteriorated slightly. Their Consumer Sentiment Index declined from November’s reading of 105.3 to 104.3.

“There was a clear difference in responses between the states hit hardest by recent Delta outbreaks and the rest of Australia. Both New South Wales and Victoria posted significant falls while sentiment was up in Queensland, Western Australia and South Australia,” said Westpac Chief Economist Bill Evans.

Any reading of the Consumer Sentiment Index above 100 indicates the number of consumers who are optimistic is greater than the number of consumers who are pessimistic. The latest figure is still above the long-term average reading of just over 101.

Domestic Treasury bond yields increased noticeably on the day, especially at the short end. By the close of business, the 2-year ACGB yield had jumped 17bps to 1.19%, the 10-year yield had gained 7bps to 1.62% while the 20-year yield finished 9bps higher at 2.18%.

In the cash futures market, expectations of any material change in the actual cash rate, currently at 0.04%, remained fairly soft. At the end of the day, contract prices implied the cash rate would not reach the RBA’s 0.10% target rate until April 2022 and then rise to 0.80% by December 2022.

Evans noted a “heightened sensitivity to virus developments in those states where there is likely more concern about the newly emerging Omicron strain and the continued circulation of COVID locally.” However, he also said there were other factors at work which were making consumers more cautious. Negative responses to inflation and interest rates appear to be more common this year than at the end of 2020.

Three of the five sub-indices registered lower readings, with the “Time to buy a major household item” sub-index posting the largest monthly percentage loss. Readings for the sub-indices “Family finances versus a year ago” and “Family finances next 12 months both improved.

The Unemployment Expectations index, formerly a useful guide to RBA rate changes, rose from 95.3 to 104.1. Higher readings result from more respondents expecting a higher unemployment rate in the year ahead.

“Biggest annual gain since 2010” from November US PPI

14 December 2021

Summary: Prices received by US producers (PPI) rise by 0.8% in October, above expectations; annual rate up from 8.8% to 9.7%; “core” PPI increases by 0.7%; biggest annual gain since 2010.

Around the end of 2018, the annual inflation rate of the US producer price index (PPI) began a downtrend which continued through 2019. Months in which producer prices increased suggested the trend may have been coming to an end, only for it to continue, culminating in a plunge in April 2020. Figures returned to “normal” towards the end of that year but recent months’ annual rates have been well above the long-term average.

The latest figures published by the Bureau of Labor Statistics indicate producer prices rose by 0.8% after seasonal adjustments in November. The increase was greater than the 0.5% rise which had been generally expected as well as October’s revised figure of 0.6%. On a 12-month basis, the rate of producer price inflation after seasonal adjustments accelerated from 8.8% to 9.7%.

PPI inflation excluding foods and energy, or “core” PPI inflation, rose by 0.7% after seasonal adjustments, greater than the consensus expectation of a 0.4% increase and October’s 0.4% rise. The annual rate accelerated from October’s revised rate of 6.9% to 7.8%.

“This was the biggest annual gain since the series began in 2010,” said NAB currency strategist Rodrigo Catril.

He noted the PPI for finished goods rose by 13.3% year on year, “the strongest since 1980.”

US Treasury bond yields only rose moderately on the day as investors traded cautiously ahead of a decision from the December meeting of the US FOMC. By the close of business, 2-year, 10-year and 30-year Treasury yields had all gained 3bps to 0.66%, 1.44% and 1.83% respectively.

The producer price index (PPI) is a measure of prices received by producers for domestically produced goods, services and construction. It is put together in a fashion similar to the consumer price index (CPI) except it measures prices received from the producer’s perspective rather than from the perspective of a retailer or a consumer. It is another one of the various measures of inflation tracked by the US Fed, along with core personal consumption expenditure (PCE) price data.

“Brisk start” to December quarter output in euro-zone

14 December 2021

Summary: Euro-zone industrial production increases by 1.1% in October; less than 1.5% expected figure; annual growth rate slows to 3.3%; “brisk start” to December quarter, production just below February 2020 high; production up in two of euro-zone’s four largest economies, including Germany.

Following a recession in 2009/2010 and the debt-crisis which flowed from it, euro-zone industrial production recovered and then reached a peak four years later in 2016. Growth rates then fluctuated for two years before beginning a steady and persistent slowdown from the start of 2018. That decline was transformed into a plunge in March and April of 2020 which then took over a year to claw back. However, production levels have since slid back below those from late 2019.

According to the latest figures released by Eurostat, euro-zone industrial production increased by 1.1% in October on a seasonally-adjusted and calendar-adjusted basis. The rise was not quite as large as the 1.5% increase which had been generally expected but it was in contrast to September’s 0.2% fall after revisions. On an annual basis, the calendar-adjusted growth rate slowed from September’s revised rate of 5.1% to 3.3%.

ANZ senior economist Catherine Birch described the increase as “a brisk start to the quarter” and noted industrial production index “is now just below the February 2020 high, almost a complete recovery despite supply chain issues.”

German and French sovereign bond yields increased modestly on the day. By the close of business, German and French 10-year bond yields had each added 2bps to -0.37% and -0.02% respectively.

Industrial production growth expanded in two of the euro-zone’s four largest economies, including Germany. Germany’s production grew by 3.0% while the comparable figures for France, Italy and Spain were +0.9%, -0.6% and -0.6% respectively.

Click for more news