News

WBC-MI leading index holding up “quite well” but negative for second month

17 November 2021

Summary:  Leading index growth rate unchanged in October; in negative territory for two consecutive months but index holds up “quite well”; non-lockdown states operating above trend, global backdrop much more supportive; reading implies annual GDP growth of 2.25% during December/March quarters; Westpac maintains growth forecasts.

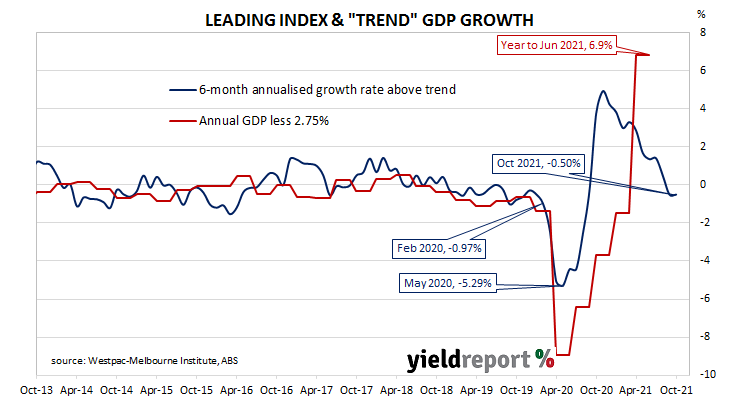
Westpac and the Melbourne Institute describe their Leading Index as a composite measure which attempts to estimate the likely pace of Australian economic growth in the short-term. After reaching a peak in early 2018, the index trended lower through 2018 and 2019 before plunging to recessionary levels in the second quarter of 2020. Subsequent readings were markedly higher but more-recent readings have steadily declined.

The latest reading of the six month annualised growth rate of the indicator registered -0.50%, unchanged from September’s reading.

“The Index growth rate has now been in negative territory for two consecutive months. Given that our two major cities were locked down for most of the September quarter and into October the Index has held up quite well,” said Westpac Chief Economist Bill Evans.

Index figures represent rates relative to “trend” GDP growth, which is generally thought to be around 2.75% per annum. The index is said to lead GDP by up to nine months, so theoretically the current reading represents an annual GDP growth rate of around 2.25% in the first or second quarters of 2022.

Domestic Treasury bond yields generally moved lower on the day, although ultra-long yield did rise noticeably. By the close of business, the 2-year ACGB yield had lost 3bps to 1.17%, the 10-year yield had slipped 1bp to 1.85% while the 20-year yield finished 5bps higher at 2.41%.

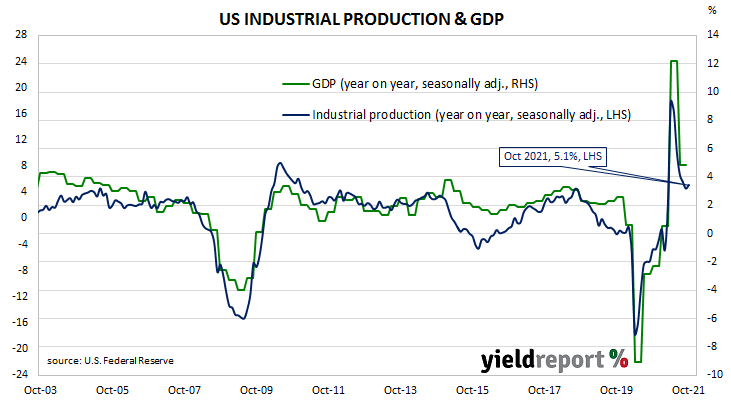
“One key consideration has been that, despite these lockdowns, the rest of the country has been operating above trend,” said Evans. He also pointed to other positive factors on the Index, such as higher US industrial production, noting the “global backdrop has also been much more supportive” than it was in 2020.

Westpac maintained its GDP growth forecasts for the September and December quarters at -4.0% and +1.6% respectively. Westpac still expects a 7.4% growth rate over calendar 2022.

Weak US consumer sentiment bypassed in latest retail sales report

16 November 2021

Summary:  US retail sales up by 1.7% in October, greater than 1.1% expected; weak consumer confidence not translated into spending; “broad strength” amongst “core” retail categories, implies solid pre-Christmas period; rises in all retail categories except two; “Non-store” segment” the largest single influence, rises 4.0%.

US retail sales had been trending up since late 2015 but, commencing in late 2018, a series of weak or negative monthly results led to a drop-off in the annual growth rate below 2.0%. Growth rates then increased in trend terms through 2019 and into early 2020 until pandemic restrictions sent it into negative territory. A “v-shaped” recovery then took place which was followed by some short-term spikes as federal stimulus payments hit US households in early 2021.

According to the latest “advance” sales numbers released by the US Census Bureau, total retail sales increased by 1.7% in October. The rise was greater than the 1.1% increase which had been generally expected as well as September’s +0.8% after it was revised up from 0.7%. On an annual basis, the growth rate accelerated from September’s revised figure of 14.3% to 16.3%.

“Consumer confidence measures have been weak but this has not passed through into actual spending,” said ANZ senior economist Catherine Birch.

US Treasury bond yields moved moderately higher on the day. By the close of business, the 2-year Treasury yield had inched up 1bps to 0.53%, the 10-year yield had added 3bps to 1.65% while the 30-year yield finished 4bps higher at 2.04%.

“The core measure of retail was even stronger relative to consensus at 1.6% against 0.9% expected. It is notable that amongst the core group there was broad strength amongst the retail categories, indicating strength in discretionary spending in the lead up to Christmas,” said NAB senior economist Tapas Strickland.

All except two of the categories recorded higher sales over the month. The “Non-store retailers” segment, provided the largest single influence on the overall result, rising by 4.0% for the month and by 10.2% for the year. Sales of vehicles, as well as petrol (“gasoline”) station sales also had significant influences on the total, with each segment rising by 1.8% and 3.9% respectively.

The non-store segment includes vending machine sales, door-to-door sales and mail-order sales but nowadays this segment has become dominated by online sales. It now accounts for a little over 14% of all US retail sales and it has become the second largest segment after the vehicles and parts segment.

US production rebounds in October, back above pre-pandemic level

16 November 2021

Summary: US industrial output expands by 1.3% in October, greater than 0.8% expected; up 5.1% over past 12 months rebound “inevitable after Hurricane disruption”; auto production up 11%, manufacturers overcoming raw materials, labour shortages; capacity utilisation rate up 1.2ppt to 76.4%; back above February 2020 figure, still well short of long-term average.

The Federal Reserve’s industrial production (IP) index measures real output from manufacturing, mining, electricity and gas company facilities located in the United States. These sectors are thought to be sensitive to consumer demand and so some leading indicators of GDP use industrial production figures as a component. US production collapsed through March and April of 2020 but then began recovering in subsequent months.

According to the Federal Reserve, US industrial production expanded by 1.6% on a seasonally adjusted basis in October. The result was greater than the 0.8% increase which had been generally expected and in contrast to September’s 1.3% contraction. On an annual basis, the expansion rate accelerated from September’s figure of 4.6% to 5.1%.

“It’s worth noting that a strong rebound was inevitable after Hurricane disruption and the level of manufacturing output is back above its pre-pandemic levels,” said NAB senior economist Tapas Strickland.

US Treasury bond yields moved moderately higher on the day. By the close of business, the 2-year Treasury yield had inched up 1bps to 0.53%, the 10-year yield had added 3bps to 1.65% while the 30-year yield finished 4bps higher at 2.04%.

Strickland noted an “11% bounce-back in auto production”, which may say something about the state of global semi-conductor production. “Even excluding this sector, the increase in production was a healthy 0.6%, with manufacturers overcoming shortages of raw materials and labour constraints.”

The same report includes US capacity utilisation figures which are generally accepted as an indicator of future investment expenditure and/or inflationary pressures. Capacity usage had hit a high for the last business cycle in early 2019 before it began a downtrend which ended with April 2020’s multi-decade low of 64.2%. October’s reading rose from 75.2% to 76.4%, back above February 2020’s reading of 76.3% but still well short of the long-term average of 80.1%.

While the US utilisation rate’s correlation with the US jobless rate is solid, it is not as high as the comparable correlation in Australia.

US September JOLTS ratios highest in series’ history

12 November 2021

Summary: US quit rate hits series high of 3.0% in September JOLTS report; “indicative of growing wage pressure”; quits up, separations up, job openings down; openings-to-jobless ratio highest in series’ history.

The number of US employees who quit their jobs as a percentage of total employment increased slowly but steadily after the GFC. It peaked in March 2019 and then tracked sideways until virus containment measures were introduced in March 2020. The quit rate then plummeted as alternative employment opportunities rapidly dried up but proceeded to recover back to its pre-pandemic rate in the third quarter of 2020.

Figures released as part of the most recent Job Openings and Labor Turnover Survey (JOLTS) report show the quit rate hit a new series-high in September. 3.0% of the non-farm workforce left their jobs voluntarily, up from August’s 2.9%. There were 164,000 more quits during the month, outweighing an additional 312,000 people employed in the non-farm sector in percentage terms.

“A high quits rate is often indicative of growing wage pressure, with employees quitting to move to better paid jobs elsewhere,” said Ray Attrill, NAB’s Head of FX Strategy within its FICC division.

US Treasury bond yields rose modestly on the day. By the close of business, 2-year and 10-year Treasury yields had each inched up 1bp to 0.52% and 1.56% respectively while the 30-year yield finished 2bps higher at 1.93%.

The rise in total quits was led by 56,000 more resignations in the “Arts, entertainment, and recreation” sector and 47,000 more resignations in the “Other services” sector. The “Retail trade” sector experienced the single largest decline, falling by 45,000. Overall, the total number of quits for the month rose from August’s revised figure of 4.270 million to 4.434 million.

In contrast, total vacancies at the end of September decreased by 191,000, or 1.8%, from August’s revised figure of 10.629 million to 10.438 million. The decline was driven by a 104,000 fall in the “Other services” sector and an 83,000 fall in the “Professional and business services” sector. The “Health care and social assistance” experienced the single largest increase, rising by 141,000. Overall, 10 out of 18 sectors experienced fewer job openings than in the previous month.

“Of note here is that the ratio of job opening to job seekers rose to 1.59 in September to be the highest in the more than twenty year history of the series. It will likely have risen further in October,” added Attrill.

Total separations increased by 186,000, or 3.1%, from August’s revised figure of 6.032 million to 6.218 million. The rise was led by the “Other services” sector, where there were 87,000 more separations than in August. Separations increased in 10 out of 18 sectors.

The “quit” rate time series produced by the JOLTS report is a leading indicator of US hourly pay. As wages account for around 55% of a product’s or service’s price in the US, wage inflation and overall inflation rates tend to be closely related. Former Federal Reserve chief and current Treasury Secretary Janet Yellen was known to pay close attention to it.

“Broad-based rise in prices” from US CPI report

10 November 2021

Summary: US CPI increases by 0.9% in October, more than 0.6% expected; “core” rate up 0.6%, above expectations; broad-based rise in prices, “challenges” transitory factors notion; fuel prices, rents, vehicles main drivers of headline rise; data “stokes” concerns of upside risk.

The annual rate of US inflation as measured by changes in the consumer price index (CPI) halved from nearly 3% in the period from July 2018 to February 2019. It then fluctuated in a range from 1.5% to 2.0% through 2019 before rising above 2.0% in the final months of that year. Substantially lower rates were reported from March 2020 to May 2020 and they remained below 2% until March this year.

The latest CPI figures released by the Bureau of Labor Statistics indicated seasonally-adjusted consumer prices increased by 0.9% on average in October. The result was higher than the 0.6% consensus expectation as well as September’s 0.4% rise. On a 12-month basis, the inflation rate accelerated from September’s seasonally adjusted reading of 5.4% to 6.2%.

“Headline” inflation is known to be volatile and so references are often made to “core” inflation for analytical purposes. Core inflation, a measure of inflation which strips out the more variable food and energy components of the index, increased by 0.6% on a seasonally-adjusted basis for the month. The result was larger than the expected figure of +0.4% as well as September’s 0.2% increase. The annual growth rate increased from 4.0% to 4.6%.

“Details in the report revealed a broad-based rise in prices, challenging the notion that higher inflation is just a function of transitory factors,” said NAB currency strategist Rodrigo Catril.

US Treasury bond yields jumped on the day. By the close of business, the 2-year Treasury yield had gained 10bps to 0.52%, the 10-year yield had added 13bps to 1.57% while the 30-year yield finished 10bps higher at 1.92%.

In terms of US Fed policy, expectations of any change in the federal funds range over the next 12 months continued to harden. November 2022 futures contracts implied an effective federal funds rate of 0.57%, 49bps above the spot rate.

The largest influence on headline results is often the change in fuel prices. “Energy commodities”, the segment which contains vehicle fuels, increased by 6.1%, adding 0.25 percentage points. Prices of “Services less energy services”, the segment which includes actual and implied rents, increased by 0.4% and “Services less energy services” increased by 1.0%. These two categories added 0.23 percentage points and 0.21 percentage points respectively.

“Since last week’s FOMC meeting, Fed speakers have argued that the risks to inflation lie to the topside. The October data certainly stoked that concern and it seems inevitable that there will be further upward creep in inflation forecasts and the dot plot when the Fed releases its Summary of Economic Projections next month,” said ANZ economist Daniel Been.

The Federal Reserve Bank of New York publishes an unofficial estimate of underlying inflation, known as the Underlying Inflation Gauge (UIG) and it was updated at the same time as the CPI figures. While the Federal Reserve states the UIG does not represent an official estimate, the UIG does appear to lead the core CPI measure.October’s UIG registered an annual rate of 4.3%, up from September’s figure of 4.0%.

November consumer sentiment improves; comes with some “intriguing aspects”

10 November 2021

Summary: Household sentiment improves a touch in November; “intriguing aspects” of survey; above long-term average; three of five sub-indices higher; change in labour market expectations a “stunning development”; unemployment index lowest since mid-1990s.

After a lengthy divergence between measures of consumer sentiment and business confidence in Australia which began in 2014, confidence readings of the two sectors converged again in mid-July 2018. Both readings then deteriorated gradually in trend terms, with consumer confidence leading the way. Household sentiment fell off a cliff in April 2020 but, after a few months of to-ing and fro-ing, it then staged a full recovery.

According to the latest Westpac-Melbourne Institute survey conducted in early October, household sentiment has improved a touch. Their Consumer Sentiment Index increased from September’s reading of 104.6 to 105.3.

“While the movement in the Index is hardly noteworthy, there are a number of intriguing aspects of the survey that provide us with useful evidence of how the economy is evolving as we emerge out of COVID,” said Westpac Chief Economist Bill Evans.

Any reading of the Consumer Sentiment Index above 100 indicates the number of consumers who are optimistic is greater than the number of consumers who are pessimistic. The latest figure is still above the long-term average reading of just over 101.

Domestic Treasury bond yields increased noticeably on the day with the exception of ultra-long yields which paradoxically declined moderately. By the close of business, the 2-year ACGB yield had jumped 19bps to 1.24%, the 10-year yield had gained 10bps to 1.87% while the 20-year yield finished 4bps lower at 2.30%.

In the cash futures market, expectations of any material change in the actual cash rate, currently at 0.03%, remained fairly soft. At the end of the day, contract prices implied the cash rate would not exceed the RBA’s 0.10% target rate until May 2022 and then rise to 1.00% by December 2022.

Three of the five sub-indices registered higher readings, with the “Economic conditions – next 12 months” sub-index posting the largest monthly percentage gain. Readings for the sub-indices “Family finances versus a year ago” and “Family finances next 12 months both deteriorated.

Among the intriguing aspects to which Evans referred were indications consumers are generally “determined” to spend more on Christmas gifts this year while simultaneously “being cautious about over-extending.” He also noted house owners with mortgages displayed “some concern about a potential rise in rates.” However, he described the change in labour market expectations as “by far and away the most stunning development.”

The Unemployment Expectations index, formerly a useful guide to RBA rate changes, fell from 107.1 to 95.3. Lower readings result from fewer respondents expecting a higher unemployment rate in the year ahead.

Evans said the latest reading of this index is the lowest it has been since the mid-1990s and “at historic highs for both males and females.” He described confidence amongst females as “particularly buoyant, near all-time record levels going back to 1975.”

US PPI up 0.6% in October; additional sizable rises likely

09 November 2021

Summary: Prices received by US producers (PPI) rise by 0.6% in October, in line with expectations; annual rate steady at 8.6%; “core” PPI increases by 0.4%; energy prices, “goods pipeline inflation pressures remain very strong”; worsening supply chain bottlenecks suggest “year-on-year gains will continue to rise”; goods prices up 1.2%, services prices up 0.2%; construction prices up 6.6%.

Around the end of 2018, the annual inflation rate of the US producer price index (PPI) began a downtrend which continued through 2019. Months in which producer prices increased suggested the trend may have been coming to an end, only for it to continue, culminating in a plunge in April 2020. Figures returned to “normal” towards the end of that year but recent months’ annual rates have been well above the long-term average.

The latest figures published by the Bureau of Labor Statistics indicate producer prices rose by 0.6% after seasonal adjustments in October. The increase was in line with expectations but slightly higher than September’s 0.5% increase. On a 12-month basis, the rate of producer price inflation after seasonal adjustments remained steady at 8.6%.

PPI inflation excluding foods and energy, or “core” PPI inflation, recorded 0.4% after seasonal adjustments, slightly less than the consensus expectation of a 0.5% increase but higher than September’s 0.2%. The annual rate slowed a little from 6.8% to 6.7%.

“Overall, goods pipeline inflation pressures remain very strong,” said ANZ economist Hayden Dimes.

US Treasury bond yields fell noticeably on the day as investors moved out of risky assets and the emergence of Lael Brainard as potentially the next chief of the US Fed in the not-too-distant future. By the close of business, the 2-year Treasury yield had lost 3bps to 0.42%, the 10-year yield had shed 6bps to 1.44% while the 30-year finished 7bps lower at 1.82%.

“Large energy price gains in November, alongside worsening supply chain bottlenecks, suggest that the year-on-year gains will continue to rise…even as base-effects dissipate,” said Westpac Head of New Zealand Strategy Imre Speizer. The BLS stated higher prices for final demand goods accounted for over 60% of the month’s increase after they rose by 1.2% on average. Prices of final demand services rose by 0.2% while final demand construction prices rose by 6.6%.    

The producer price index (PPI) is a measure of prices received by producers for domestically produced goods, services and construction. It is put together in a fashion similar to the consumer price index (CPI) except it measures prices received from the producer’s perspective rather than from the perspective of a retailer or a consumer. It is another one of the various measures of inflation tracked by the US Fed, along with core personal consumption expenditure (PCE) price data.

“First indications of a strong rebound” from NAB’s October survey

09 November 2021

Summary: Business conditions improve in October; confidence also improves; first indications of “strong rebound in activity”; upstream price pressures “not fully filtering into downstream final price growth”; capacity utilisation rate rises; six of eight sectors of economy at/above respective long-run averages.

NAB’s business survey indicated Australian business conditions were robust in the first half of 2018, with a cyclical-peak reached in April of that year. Readings from NAB’s index then began to slip, declining to below-average levels by the end of 2018. Forecasts of a slowdown in the domestic economy began to emerge in the first half of 2019 and the index trended lower, hitting a nadir in April 2020 as pandemic restrictions were introduced. Conditions improved markedly over the next twelve months, only to fall back in the middle of this year.

According to NAB’s latest monthly business survey of over 400 firms conducted over the last week and a half of October, business conditions have improved. NAB’s conditions index registered 11, up from September’s reading of 5.

Business confidence also improved and NAB’s confidence index rose from September’s revised reading of 10 to 21, well above the long-term average. Typically, NAB’s confidence index leads the conditions index by approximately one month, although some divergences have appeared in the past from time to time.

“Overall, the results provide first indications of a strong rebound in activity as the major states emerge from lockdowns, with more improvement likely in November as Victorian restrictions continue to ease,” said NAB senior economist Brody Viney.

Commonwealth Government bond yields generally fell on the day, although ultra-long yields remained stable. By the close of business, the 3-year ACGB yield had shed 3bps to 1.05% and the 10-year yield had lost 5bps to 1.77%. The 20-year yield finished unchanged at 2.34%.

In the cash futures market, expectations of any material change in the actual cash rate, currently at 0.03%, remained fairly soft. At the end of the day, contract prices implied the cash rate would not exceed the RBA’s 0.10% target rate until May 2022 but then rise to 0.75% by November 2022 and to 1.06% by March 2023.

“Further gains in business sentiment and activity measures will likely be welcomed by the RBA as further confirmation that the economy is recovering from state lockdown-imposed weakness. The RBA may also feel somewhat relieved by the fact that higher upstream price pressures are not fully filtering into downstream final price growth,” said Citi Research economist Josh Williamson.

NAB’s measure of national capacity utilisation increased noticeably, rising from September’s revised figure of 78.2% to 81.5%. Six of the eight sectors of the economy were reported to be operating at or above their respective long-run averages, with only the retail and recreational/personal services sectors operating at below-average levels.

Capacity utilisation is generally accepted as an indicator of future investment expenditure and it also has a strong inverse relationship with the unemployment rate.

Non-farm payrolls show “solid, dynamic” recovery in place

05 November 2021

Summary: Non-farm payrolls increase by 531K in October; above expectations; previous two months’ figures revised up by 235K; jobless rate down to 4.6%, participation rate steady at 61.6%; labour market recovery “in place”, US economic activity “re-accelerating.”; jobs-to-population ratio increases to 58.8%; underutilisation rate falls from 8.5% to 8.3%; annual hourly pay growth increases to 4.9%.

The US economy ceased producing jobs in net terms as infection controls began to be implemented in March 2020. The unemployment rate had been around 3.5% but that changed as job losses began to surge through March and April of 2020. The May 2020 non-farm employment report represented a turning point and subsequent months provided substantial employment gains. Changes in recent months have been generally more modest but still well above the long-term monthly average.

According to the US Bureau of Labor Statistics, the US economy created an additional 531,000 jobs in the non-farm sector in October. The increase was greater than the 425,000 which had been generally expected earlier in the week and considerably more than the 312,000 jobs which had been added in September after revisions. Additionally, employment figures for August and September were revised up by a total of 235,000.

The total number of unemployed decreased by 255,000 to 7.419 million while the total number of people who are either employed or looking for work increased by 104,000 to 161.458 million. These changes led to a fall in the US unemployment rate from September’s 4.8% to 4.6%. The participation rate remained unchanged from September’s rate of 61.6%.

ANZ economist Rahul Khare said the figures “show that a solid and dynamic labour market recovery is in place and that US economic activity is re-accelerating.” NAB senior economist Tapas Strickland basically agreed, describing the data as “undeniably strong”.

US Treasury yields fell on the day. By the close of business, the 2-year yield had shed 2bps to 0.39%, the 10- year yield had lost 8bps to 1.45% while the 30-year yield finished 7bps lower to 1.89%.

One figure which is indicative of the “spare capacity” of the US employment market is the employment-to-population ratio. This ratio is simply the number of people in work divided by the total US population. It hit a cyclical-low of 58.2 in October 2010 before slowly recovering to just above 61% in late-2019. October’s reading inched up from 58.7% to 58.8%, still some way from its April 2000 peak reading of 64.7%.

Wage growth spiked in the US during the early stages of pandemic restrictions as lower-paid jobs disappeared at a faster rate relative to higher-paid jobs, disrupting the usual relationship between wage inflation and unemployment rates. Normally, wages tend to grow as the supply of labour tightens.

One measure of tightness in the labour market is the underutilisation rate. In October, this measure declined from 8.5% to 8.3%. Hourly pay growth over the previous 12 months accelerated from September’s revised rate of 4.6% to 4.9%.

ADP payrolls beats estimates; revisions likely for October NFP

04 November 2021

Summary: ADP payrolls up by 571,000 in October, more than consensus expectations; September increase revised down by 45,000; may lead to upward revisions of upcoming non-farm payrolls report; positions up across firms of all sizes, bias again towards large firms; 80% of gain in services sector, led again by leisure/hospitality sector.

The ADP National Employment Report is a monthly report which provides an estimate of US non-farm employment in the private sector. Since publishing of the report began in 2006, its employment figures have exhibited a high correlation with official non-farm payroll figures, although a large difference can arise in any individual month.

The latest ADP report indicated private sector employment increased by 571,000 in October, more than the 400,000 which had been generally expected. September’s increase was revised down by 45,000 to 523,000.

Ray Attrill, NAB’s Head of FX Strategy within its FICC division, said the figures may result in “some upward revisions” to the upcoming non-farm payrolls report.

US Treasury yields moved moderately higher on the day. By the close of business, the 2-year Treasury bond yield had added 2bps to 0.47%, the 10-year yield had gained 5bps to 1.60% while the 30-year yield finished 6bps higher at 2.02%.

In terms of US Fed policy, expectations of any change in the federal funds rate over the next 12 months firmed a little in favour of earlier rate rises. Federal funds futures contracts for November 2022 implied an effective federal funds rate of 0.50%, 42bps above the current spot rate.

Employment numbers in net terms increased across businesses of all sizes, again with a strong bias towards large firms. Firms with less than 50 employees filled a net 115,000 positions, mid-sized firms (50-499 employees) gained 114,000 positions while large businesses (500 or more employees) accounted for 342,000 additional employees.

Employment at service providers accounted for just over 80% of the total net increase, or 458,000 positions. The “Leisure & Hospitality” sector was the largest single source of gains for a seventh consecutive month, with 185,000 additional positions. Total jobs among goods producers increased by a net 113,000 positions.

Prior to the ADP report, the consensus estimate of the change in September’s non-farm employment figure was 425,000. The non-farm payroll report will be released by the Bureau of Labor Statistics this coming Friday night (AEST), 5 November.

Click for more news