News

HomeBuilder scheme still unwinding as September home approvals decline

03 November 2021

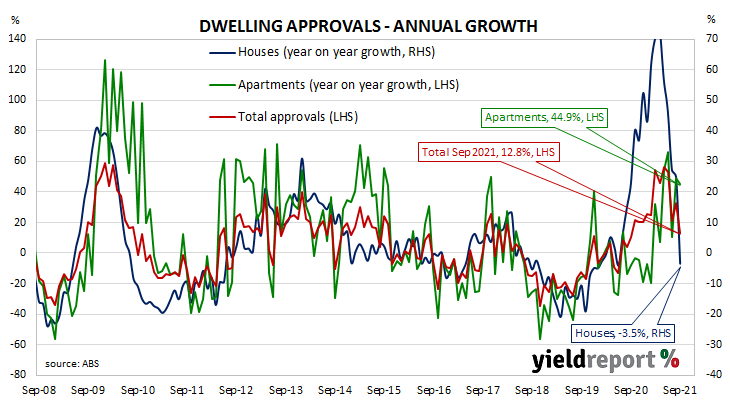
Summary: Home approval numbers fall 4.3% in September, slightly greater than expected decline; up 12.8% on annual basis; more softening coming, although “question mark” regarding units approvals remains; house approvals down 16.1%, aligns with continued unwinding of “HomeBuilder”; apartment approvals up 17.4%, likely to continue while investor lending strong; non-residential approvals down 11.3%, residential alterations down 20.0% over month.

Building approvals for dwellings, that is apartments and houses, had been heading south since mid-2018. As an indicator of investor confidence, falling approvals had presented a worrying signal, not just for the building sector but for the overall economy. However, approval figures from late-2019 and the early months of 2020 painted a picture of a recovery taking place, even as late as April of that year. Subsequent months’ figures then trended sharply upwards before easing somewhat in the June and September quarters of 2021.

The Australian Bureau of Statistics has released the latest figures from September and total residential approvals decreased by 4.3% on a seasonally-adjusted basis. The fall over the month was slightly greater than the 2.0% decline which had been generally expected and in contrast with August’s 7.6% rise. Total approvals increased by 12.8% on an annual basis, down substantially from the previous month’s revised figure of 32.5%. Monthly growth rates are often volatile.

“Overall, most of the detail in the September update aligns with our prior view that more softening is coming through, albeit with a bit of a question-mark around units,” said Westpac senior economist Matthew Hassan.

He noted August’s figures “suggested the HomeBuilder unwind may have run its course” but the latest report “puts that idea to rest.”

Commonwealth Government bond yields moved lower on the day. By the close of business, the 2-year ACGB yield had lost 2bps to 1.10%, the 10-year had shed 4bps to 1.88% while the 20-year yield finished 2bps lower at 2.43%.

Approvals for new houses decreased by 16.1% over the month after rising by 4.3% in August after revisions. On a 12-month basis, house approvals were 3.5% lower than they were in September 2020, down from August’s comparable figure of 25.0%.

Hassan pointed out “a big fall” in house approvals aligned with continued unwinding of the HomeBuilder scheme, noting it is unusual for approvals in this segment to fall by quite so much in one month.

Apartment approval figures are usually a lot more volatile and September’s total rose by 17.4% after an increase of 14.4% in August. The 12-month growth figure declined from August’s revised rate of 49.1% to 44.9%.

“Unit approvals are likely to continue to rise while investor lending is strong, though rising interest rates, particularly fixed rates, may curb residential investor demand,” said ANZ senior economist Adelaide Timbrell.

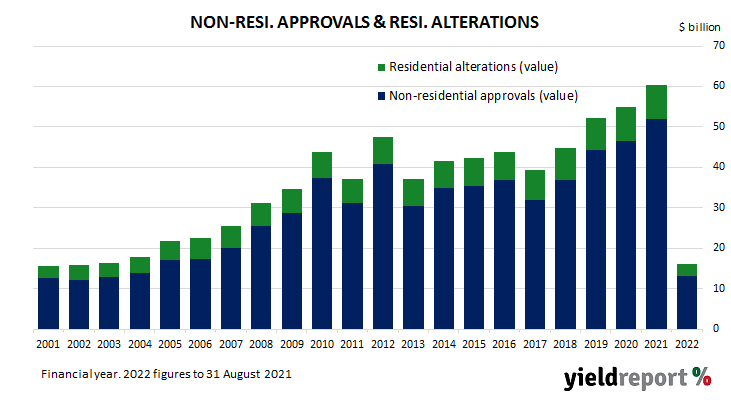
Non-residential approvals decreased by 11.3% in dollar terms over the month but were still up 49.5% on an annual basis. Figures in this segment also tend to be rather volatile.

Residential alteration approvals fell by 20.0% in dollar terms over the month but were 10.6% higher than in September 2020.

ISM PMI declines in October; “unprecedented number of hurdles”

01 November 2021

Summary: ISM PMI declines from 61.1% to 60.8% in October, slightly above consensus expectation; “unprecedented number of hurdles to meet increasing demand”; respondents “strongly optimistic”; latest reading implies 5.0% 12-month GDP growth rate in March.

The Institute of Supply Management (ISM) manufacturing Purchasing Managers Index (PMI) reached a cyclical peak in September 2017.  It then started a downtrend which ended in March 2020 with a contraction in US manufacturing which lasted until June 2020. Subsequent month’s readings implied growth had resumed, with the index becoming stronger through to March 2021. Since then, readings have remained at elevated levels.

According to the ISM’s October survey, its PMI recorded a reading of 60.8%, slightly above the generally expected figure of 60.3% but a little lower than September’s 61.1%. The average reading since 1948 is 53.0% and any reading above 50% implies an expansion in the US manufacturing sector relative to the previous month.

“Business Survey Committee panellists reported that their companies and suppliers continue to deal with an unprecedented number of hurdles to meet increasing demand,” said Timothy Fiore, Chair of the ISM’s Manufacturing Business Survey Committee.

US Treasury bond yields remained stable on the day except at the ultra-long end where they rose moderately. By the close of business, 2-year and 10-year Treasury bond yields had returned to their starting points at 0.50% and 1.56% respectively while the 30-year yield finished 3bps higher at 1.96%.

Fiore noted respondents continued to be “strongly optimistic, with four positive growth comments for every cautious comment.”

Purchasing managers’ indices (PMIs) are economic indicators derived from monthly surveys of executives in private-sector companies. They are diffusion indices, which means a reading of 50% represents no change from the previous period, while a reading under 50% implies respondents reported a deterioration on average. According to the ISM, a reading “above 42.8%, over a period of time, generally indicates an expansion of the overall economy.”                                                                 

Manufacturing PMI figures appear to lead US GDP by several months despite a considerable error in any given month. The chart below shows US GDP on a “year on year” basis (and not the BEA annualised basis) against US GDP implied by monthly PMI figures. 

According to the ISM and its analysis of past relationships between the PMI and US GDP, October’s PMI corresponds to an annualised growth rate of 5.0%, or 1.2% over a quarter. Regression analysis on a year-on-year basis suggests a 12-month GDP growth rate of 5.0% five months after this latest report.

The ISM index is one of two monthly US PMIs, the other being an index published by IHS Markit. IHS Markit also produces a “flash” estimate in the last week of each month which comes out about a week and a half before the ISM index is published. The IHS Markit October flash manufacturing PMI registered 59.2%, 1.3 percentage points lower than September’s final figure.

Inflation Gauge up 0.2% in October; annual rate now above 3%

01 November 2021

Summary: Melbourne Institute Inflation Gauge index up 0.2% in October; index up 3.1% on annual basis; bond yields dive, partially reverse previous week’s rises.

Despite the RBA’s desire for a higher inflation rate, ostensibly to combat recessions, attempts to accelerate inflation through record-low interest rates failed in the second half of the previous decade. The RBA’s stated objective is to achieve an inflation rate of between 2% and 3%, “on average, over time.” Australia’s inflation rate had been trending downwards at a modest rate after the GFC and the “coronavirus recession” then crushed it in the June quarter of 2020. Since then, the inflation rate has picked up, initially aided by what economists call “base effects”. 

The Melbourne Institute’s latest reading of its Inflation Gauge index indicates consumer inflation increased by 0.2% in October. The rise follows a 0.3% increase in September and a flat result in August. On an annual basis, the index rose by 3.1%, accelerating from September’s comparable figure of 2.7%.

Commonwealth Government bond yields dived on the day, partially reversing large rises from the latter part of the previous week. By the close of business, the 3-year ACGB yield had lost 21bps to 1.19%, the 10-year yield had shed 19bps to 1.93% while the 20-year yield finished 18bps lower at 2.45%.

The Melbourne Institute’s Inflation Gauge is an attempt to replicate the ABS consumer price index (CPI) on a monthly basis. It has turned out to be a reliable leading indicator of the CPI, although there are periods in which the Inflation Gauge and the CPI have diverged for as long as twelve months. On average, the Inflation Gauge’s annual rate tends to overestimate the ABS headline rate by around 0.1% on average.

Central bankers desire a certain level of inflation which is “sufficiently low that it does not materially distort economic decisions in the community” but high enough so it does not constrain “a central bank’s ability to combat recessions.” Hence the relatively recent obsession among central banks, including the RBA, to increase inflation.

Job ads up in October, recovers Sep quarter falls

01 November 2021

Summary:  Job ads up 5.6% in October; 56.0% higher than same month in 2020; October ads back to June 2020 peak; ads-to-workforce ratio slightly higher at 1.5%.

From mid-2017 onwards, year-on-year growth rates in the total number of Australian job advertisements consistently exceeded 10%. That was until mid-2018 when the annual growth rate fell back markedly. 2019 was notable for its reduced employment advertising and this trend continued into the first quarter of 2020. Advertising plunged in April and May of 2020 as pandemic restrictions took effect but then recovered quite quickly.

According to the latest ANZ figures, total advertisements increased by 6.2% in October on a seasonally-adjusted basis. The rise followed declines of 2.8% and 2.1% in September and August respectively after revisions. On a 12-month basis, total job advertisements were 56.0% higher than in October 2020, modestly lower than September’s revised figure of 60.6%.

ANZ senior economist Catherine Birch noted the latest figure “put it back on par with the June peak prior to the Delta lockdowns.”

Commonwealth Government bond yields fell noticeably on the day, partially reversing large rises from the latter part of the previous week. By the close of business, the 3-year ACGB yield had lost 21bps to 1.19%, the 10-year yield had shed 19bps to 1.93% while the 20-year yield finished 18bps lower at 2.45%.

The inverse relationship between job advertisements and the unemployment rate has been quite strong (see below chart), although ANZ themselves called the relationship between the two series into question in early 2019.  A rising number of job advertisements as a proportion of the labour force is suggestive of lower unemployment rates in the near-future while a falling ratio suggests higher unemployment rates will follow.

In 2008/2009, advertisements plummeted and Australia’s unemployment rate jumped from 4% to nearly 6% over a period of 15 months. When a more dramatic fall in advertisements took place in April 2020, the unemployment rate responded much more quickly.

Lower-than-expected US core PCE rise a “small reprieve”

29 October 2021

Summary: US Fed’sfavoured inflation measure increases by 0.2% in September; slightly lower than market expectations; annual rate steady at 3.6%; “small reprieve” ahead of expected wave of price pressures; Treasury bond yields up at front of curve, down elsewhere.

One of the US Fed’s favoured measures of inflation is the change in the core personal consumption expenditures (PCE) price index. After hitting the Fed’s target at the time of 2.0% in mid-2018, the annual rate then hovered in a range between 1.8% and 2.0% before it eased back to a range between 1.5% and 1.8% through 2019. It then plummeted below 1.0% in April 2020 before rising back to around 1.5% in the September quarter of that year. It has since spiked up above 3% in this year’s June and September quarters.

The latest figures have now been published by the Bureau of Economic Analysis as part of the September personal income and expenditures report. Core PCE prices rose by 0.2% over the month, slightly lower than the 0.3% increase which had been generally expected figure and August’s 0.3% increase. On a 12-month basis, the core PCE inflation rate remained unchanged at 3.6% for a fourth consecutive month.

“This is a small reprieve ahead of what is expected to be a new wave of price pressures, with used cars, hotel rooms and airline tickets prices all seen rising over the last few months of the year, “said NAB currency strategist Rodrigo Catril.

US Treasury bond yields rose at the front of the curve but fell elsewhere on the day. By the close of business, the 2-year Treasury bond yield had added 2bps to 0.50%, the 10-year yield had shed 2bps to 1.56% while the 30-year yield finished 5bps lower at 1.93%.

The core version of PCE strips out energy and food components, which are volatile from month to month, in an attempt to identify the prevailing trend. It is not the only measure of inflation used by the Fed; it also tracks the Consumer Price Index (CPI) and the Producer Price Index (PPI) from the Department of Labor. However, it is the one measure which is most often referred to in FOMC minutes.

Private credit beats estimates in September; “early signs” business investment rising

29 October 2021

Summary: Private sector credit grows by 0.6% in September, above +0.5% expected; annual growth rate rises from 4.7% to 5.3%; “early signs” business investment may be lifting “meaningfully”; owner-occupier loans account for two-thirds of net growth; investor loans up modestly again, personal loans down again.

The pace of lending to the non-bank private sector by financial institutions in Australia has been trending down since late-2015. Private sector credit growth appeared to have stabilised in the September quarter of 2018 only to deteriorate through to the end of 2019. The early months of 2020 provided some positive signs but they disappeared in April 2020. Recent months’ figures indicate the downtrend is over and annual growth rates are now back to levels last seen in 2016 and 2017.

According to the latest RBA figures, private sector credit growth increased by 0.6% in September. The result was just above the generally expected figure of 0.5% but in line with August’s increase. On an annual basis, the growth rate increased from August’s rate of 4.7% to 5.3%.

“The surprise was from business credit…Given any precautionary shoring up of balance sheets from businesses was likely complete by September, this to us suggests some early signs that business investment might be meaningfully lifting,”said ANZ senior economist Adelaide Timbrell.

Commonwealth bond yields jumped on the day, not because of the report or September’s sales figures private credit figures but because the RBA did not defend its April 2024 ACGB yield target. By the end of the day, the 3-year ACGB yield had gained 7bps to 1.40%, the 10-year rate had jumped 25bps to 2.12% while the 20-year yield finished 22bps higher at 2.63%.

Owner-occupier loans accounted for about two-thirds of the net growth over the month, with business loans accounting for a good chunk of the balance. Investor loans again grew quite modestly while total personal debt contracted again.

The traditional driver of loan growth rates, the owner-occupier segment, grew by 0.7% over the month, slightly slower than August’s 0.8% increase. The sector’s 12-month growth rate sped up from August’s revised rate of 8.4% to 8.7%.

Lending in the business sector expanded by 0.7%, slightly more than August’s 0.6% increase. The segment’s annual growth rate increased from August’s 3.4% to 4.6%.

Monthly growth in the investor-lending segment slowed to a halt in early 2018. Shortly into the 2019/20 financial year, monthly growth rates slipped into the red before posting a series of flat or near-flat results until late 2020. Growth rates became positive again from December 2020. In September, net lending grew by 0.3%, in line with August’s revised rate. The 12-month growth rate increased from August’s rate of 2.2% to 2.4%.                               

Total personal loans contracted by 0.6% in September following a similar-sized fall in August, with the annual contraction rate slowing from 5.6% to 5.3%. This category of debt includes fixed-term loans for large personal expenditures, credit cards and other revolving credit facilities.

September retail spending “encouraging”, non-Vic states provide surprises

29 October 2021

Summary: Retail sales up 1.3% in September, more than expected 0.3%; up 1.7% on annual basis: increase “encouraging” but overwhelmed by July, August weakness; better than expected lift in NSW, strong gains in non- lockdown states; largest influence on month from household goods.

Growth figures of domestic retail sales have been declining since 2014 and they reached a low-point in September 2017 when they registered an annual growth rate of just 1.5%. They then began increasing for about a year, only to stabilise at around 3.0% to 3.5% through late 2018 before trending lower through 2019 and early 2020. Monthly changes have been exceptionally volatile since then.

According to the latest ABS figures, total retail sales increased by 1.3% in September on a seasonally-adjusted basis. The gain was larger than the 0.3% increase which had been generally and in contrast to August’s 1.7% fall. On an annual basis, retail sales increased by 1.7%, up from August’s comparable figure of -0.7%.

“The increase in retail spending in September was encouraging but barely put a dent in the quarterly nominal result of -4.4%that was driven by the weakness in July and August,” said ANZ senior economist Adelaide Timbrell.

Commonwealth bond yields jumped on the day, not because of the sales figures or September’s private credit figures but because the RBA did not defend its April 2024 ACGB yield target. By the end of the day, the 3-year ACGB yield had gained 7bps to 1.40%, the 10-year rate had jumped 25bps to 2.12% while the 20-year yield finished 22bps higher at 2.63%.

“The state breakdown showed surprises on two fronts: a better than expected 2.3% lift in New South Wales and strong gains in ‘non lockdown’ states that more than offset a sizeable 2.1% decline in Victoria…The response in New South Wales is promising for October; our card data is already suggesting the further easing in restrictions has seen activity flourish through the month,” said Westpac senior economist Matthew Hassan.

Retail sales are typically segmented into six categories (see below), with the “food” segment accounting for nearly 45% of total sales. However, the largest influence on the total during the month came from the “Household Goods” segment which increased by 4.3% over the month and thus contributed 0.78 percentage points of the 1.3% increase. Food sales fell by 1.4% over the month and deducted 0.63 percentage points.

Another miss on US GDP in September as consumer spending slows

28 October 2021

Summary:  US GDP up 0.5% (2.0% annualised) in September quarter, less than 2.5% expected; “sharp” slowdown in personal consumption; GDP price deflator annual rate rises from 4% to 4.5%.

US GDP growth slowed in the second quarter of 2019 before stabilising at about 0.5% per quarter.  At the same time, US bond yields suggested future growth rates would be below trend. The US Fed agreed and it reduced its federal funds range three times in the second half of 2019. Pandemic restrictions in the June quarter of 2020 sent parts of the US economy into hibernation; the lifting of those same restrictions sparked a rapid recovery.

The US Bureau of Economic Analysis has now released September quarter “advance” GDP estimates and they indicate the US economy expanded by 0.5% or at an annualised growth rate of 2.0%. The figure was much less than the +2.5% (+10.4% annualised) which had been generally expected as well as the June quarter’s 1.6% expansion after revisions.

 “The slowdown was largely attributed to a sharp slowdown in personal consumption, which grew at just a 1.6% pace after a rapid 12% jump in the prior period,” said NAB economist Rodrigo Catril. He put this down to supply bottlenecks, rising prices and spreading COVID infections.

US GDP numbers are published in a manner which is different to most other countries; quarterly figures are compounded to give an annualised figure. In countries such as Australia and the UK, an annual figure is calculated by taking the latest number and comparing it with the figure from the same period in the previous year. The diagram above shows US GDP once it has been expressed in the normal manner, as well as the annualised figure.

US Treasury bond yields moved a modestly lower at the short end but somewhat higher at the long end on the day. By the end of it, the 2-year Treasury bond yield had lost 2bps to 0.48% while 10-year and 30-year yields each finished 3bps higher at 1.58% and 1.98% respectively.

In terms of US Fed policy, expectations of any change in the federal funds rate over the next 12 months hardened slightly in favour of earlier rate rises. Federal funds futures contracts for October 2022 implied an effective federal funds rate of 0.46%, 38bps above the current spot rate.

One part of the report which is often overlooked are the figures regarding the GDP price deflator, which is another measure of inflation. The GDP price deflator is restricted to new, domestically-produced goods and services and it is not based on a fixed basket as is the case for the consumer price index (CPI). The annual rate rose from the June quarter’s revised figure of 4.0% to 4.5%.

Euro-zone ESI beats estimates, near series high

28 October 2021

Summary: Euro-zone composite sentiment index rises from 117.8 to 118.6 in October, above expectations; readings up in four of five economic sectors, up in France, Italy, Span, down in Germany; sovereign bond yields noticeably higher on day; index implies GDP growth in excess of 5%.

The European Commission’s Economic Sentiment Indicator (ESI) is a composite index comprising five differently-weighted sectoral confidence indicators.  It is heavily weighted towards confidence surveys from the business sector, with the consumer confidence sub-index only accounting for 20% of the ESI. However, it has a good relationship with euro-zone GDP, although not as a leading indicator.

The ESI posted a reading of 118.6 in October, above the market’s expected figure of 116.7 and September’s reading of 117.6. The average reading since 1985 has been a touch over 100 and the latest reading is just short of its series high of 119.

Confidence improved in four of the five sectors and only the consumer sub-index deteriorated. On a geographical basis, the ESI increased in France, Italy and Spain but declined in Germany.

German and French 10-year bond yields finished the day noticeably higher. By the close of business, the German 10-year bond yield had gained 5bps to -0.14% while the French 10-year yield finished 6bps higher at 0.22%.

End-of-quarter ESI readings and annual euro-zone GDP growth rates are highly correlated. This latest reading corresponds to a year-to-October GDP growth rate of 5.6%, up from September’s figure of 5.4%.

Inflation concerns present but impact on CB sentiment index “muted”

26 October 2021

Summary: Conference Board Consumer Confidence Index rises in October; reading above expected figure; views of present conditions, short-term outlook both improve; impact of short term inflation concerns on confidence “muted”; signs consumer spending to support growth through final months of 2021.

After the GFC in 2008/09, US consumer confidence clawed its way back to neutral over a number of years and then went from strength to strength until late 2018. Measures of consumer confidence then oscillated within a fairly narrow band at historically high levels until they plunged in early 2020. Subsequent readings then fluctuated around the long-term average until March this year when they reached elevated levels.

The latest Conference Board survey held during the first three weeks of October indicated US consumer confidence has improved. October’s Consumer Confidence Index registered 113.8 on a preliminary basis, a reading which is above the median consensus figure of 109.5 as well as September’s final figure of 109.8.

Consumers’ views of present conditions and their outlook for the near-future both improved. The Present Situation Index rose from a revised figure of 144.3 to 147.4 while the Expectations Index increased from a revised figure of 86.7 to 91.3.

“While short-term inflation concerns rose to a 13-year high, the impact on confidence was muted,” said Lynn Franco, a senior director at The Conference Board.

Long-term US Treasury bond yields declined moderately. By the close of business, the 10-year Treasury bond yield had lost 2bps to 1.61% and the 30-year yield had shed 4bps to 2.04%. The 2-year yield finished 1bp higher at 0.45%.

In terms of US Fed policy, expectations of a rise in the federal funds rate over the next 12 months remained almost unchanged. Federal funds futures contracts for October 2022 implied an effective federal funds rate of 0.41%, about 33bps above the current spot rate.

Franco noted a higher proportion of respondents planned to purchase homes, cars and large appliances and he took this as “a sign that consumer spending will continue to support economic growth through the final months of 2021.” Additionally, nearly half intend to take a vacation in the next six months, “a reflection of the ongoing resurgence in consumers’ willingness to travel and spend on in-person services.”

The Consumer Confidence Survey is one of two monthly US consumer sentiment surveys which result in the construction of an index. The Conference Board’s index is based on perceptions of current business and employment conditions, as well as respondents’ expectations of conditions six months in the future. The other survey, conducted by the University of Michigan, is similar and it is used to produce an Index of Consumer Sentiment. That survey differs in that it also includes some longer-term questions.

Click for more news