News

US companies, suppliers struggle with increased demand: ISM

02 August 2021

Summary: ISM PMI falls from 60.6% to 59.5% in July, slightly below consensus expectation; companies, suppliers struggle to meet increasing demand levels; US Treasury market reaction suggests concern over ‘peak growth’, more slowdown ahead; various factors imposing limits on manufacturing sector; latest reading implies 4.7% 12-month GDP growth rate in December.


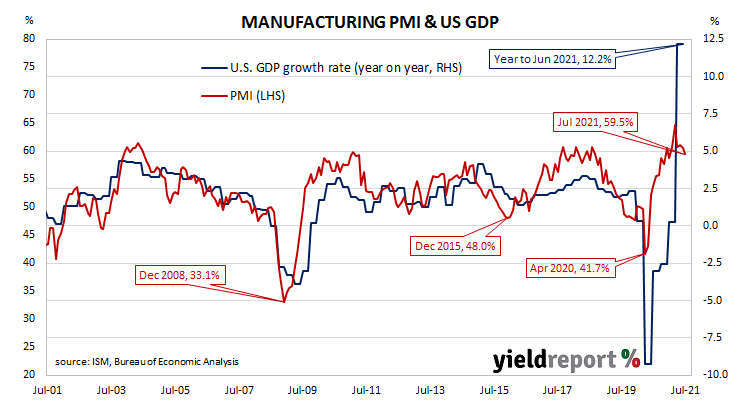
The ISM’s purchasing managers’ index (PMI) reached a cyclical peak in September 2017.  It then started a downtrend which ended in March 2020 with a contraction in US manufacturing which lasted until June 2020. Subsequent month’s readings implied growth had resumed before becoming stronger through the early months of 2021.

According to the latest Institute of Supply Management (ISM) survey, its Purchasing Managers Index recorded a reading of 59.5% in July. The result was slightly below the generally expected figure of 60.8% and slightly lower than June’s reading of 60.6%. The average reading since 1948 is 52.9% and any reading above 50% implies an expansion in the US manufacturing sector relative to the previous month.

The ISM’s Timothy Fiore said, “Business Survey Committee panellists reported that their companies and suppliers continue to struggle to meet increasing demand levels.”

Longer-term US Treasury bond yields fell on the day. By the close of business, the 10-year Treasury bond yield had shed 4bps to 1.19% and the 30-year yield had lost 3bps to 1.86%. The 2-year yield unchanged at 0.18%.

NAB currency strategist Rodrigo Catril said, “From a historic perspective a 59.5 manufacturing ISM reading is still a very robust activity reading. Nevertheless, reaction to the data release by the US Treasury market suggests the market is concerned over ‘peak growth’ and the potential for more slowdown ahead.”

Fiore pointed to various factors imposing limits on the US manufacturing sector, such as “near-record long raw-material lead times”, shortages of critical basic materials, transport difficulties, absenteeism and employee shortages. At the same time, he noted, “Optimistic panel sentiment remained strong, with 13 positive comments for every cautious comment.”

Purchasing managers’ indices (PMIs) are economic indicators derived from monthly surveys of executives in private-sector companies. They are diffusion indices, which means a reading of 50% represents no change from the previous period, while a reading under 50% implies respondents reported a deterioration on average. According to the ISM, a reading “above 42.8%, over a period of time, generally indicates an expansion of the overall economy.”

Inflation Gauge up 0.5% in July

02 August 2021

Summary: Melbourne Institute Inflation Gauge index rises by 0.5% in July; index up 2.6% on annual basis; bond yields unchanged at end of day.


Despite the RBA’s desire for a higher inflation rate, ostensibly to combat recessions, attempts to accelerate inflation through record-low interest rates have failed to date. The RBA’s stated objective is to achieve an inflation rate of between 2% and 3%, “on average, over time.” Australia’s inflation rate has been trending lower and lower since the GFC and the “coronavirus recession” then crushed it in the June quarter of 2020.

The Melbourne Institute’s latest reading of its Inflation Gauge index increased by 0.5% in July. The rise follows a 0.4% rise in June and a 0.2% decline in May. On an annual basis, the index rose by 2.6%, slowing from June’s comparable figure of 3.0%.

The figures were released on the same day as ANZ’s latest Job Ads report but Commonwealth Government bond yields remained remarkably stable on the day. By the close of business, 3-year, 10-year and 20-year ACGB yields had all returned to their starting points at 0.28%, 1.18% and 1.81% respectively.

The Melbourne Institute’s Inflation Gauge is an attempt to replicate the ABS consumer price index (CPI) on a monthly basis. It has turned out to be a reliable leading indicator of the CPI, although there are periods in which the Inflation Gauge and the CPI have diverged for as long as twelve months. On average, the Inflation Gauge’s annual rate tends to overestimate the ABS headline rate by around 0.1% on average.

Central bankers desire a certain level of inflation which is “sufficiently low that it does not materially distort economic decisions in the community” but high enough so it does not constrain “a central bank’s ability to combat recessions.” Hence the relatively recent obsession among central banks, including the RBA, to increase inflation.

Job ads hold up in July; JobSaver, labour “hoarding” helping

02 August 2021

Summary:  Job ads down 0.5% in July; 94.1% higher than same month in 2020; no dramatic effect from lockdowns, restrictions in second half of month; ongoing NSW restrictions to have limited impact in short-term, although “downside risks rise” as lockdown continues; JobSaver labour “hoarding” helping.


From mid-2017 onwards, year-on-year growth rates in the total number of Australian job advertisements consistently exceeded 10%. That was until mid-2018 when the annual growth rate fell back markedly. 2019 was notable for its reduced employment advertising and this trend continued into the first quarter of 2020. Advertising plunged in April and May of 2020 as pandemic restrictions took effect but then recovered relatively quickly.

According to the latest ANZ figures, total advertisements declined by 0.5% in July on a seasonally-adjusted basis. The fall followed a 1.5% increase in June and a 6.7% gain in May after revisions. On a 12-month basis, total job advertisements were 94.1% higher than in July 2020, down from June’s comparable figure of 133.6%.

ANZ senior economist Catherine Birch noted advertisements had not dramatically fallen in the second half of the month when New South Wales, Victoria and South Australia implemented “stay at home” or similar restrictions.

The figures were released on the same day as the Melbourne Institute’s latest reading of its Inflation Gauge but Commonwealth Government bond yields remained remarkably stable on the day. By the close of business, 3-year, 10-year and 20-year ACGB yields had all returned to their starting points at 0.28%, 1.18% and 1.81% respectively.

Birch said the figures added to “our expectation that the impact of New South Wales’ lockdown on employment and the unemployment rate will be limited”.  She expects the New South Wales Government’s JobSaver programme, in conjunction with the “hoarding” of labour by businesses, “will mitigate state and national effects on employment and unemployment.”  However, she also acknowledged “downside risks rise the longer [the] lockdown continues.”

The inverse relationship between job advertisements and the unemployment rate has been quite strong (see below chart), although ANZ themselves called the relationship between the two series into question in early 2019.  A rising number of job advertisements as a proportion of the labour force is suggestive of lower unemployment rates in the near-future. A falling ratio suggests higher unemployment rates will follow.

June credit jump reminiscent of March 2020 rise

30 July 2021

Summary: Private sector credit grows by 0.9% in June, above expected figure; annual growth rate rises from 1.9% to 3.1%; owner-occupier loans, business loans account for much of net growth; increased business lending in June may have similar drivers as in March 2020; housing credit growth continues, business loans up, personal loans down.


The pace of lending to the non-bank private sector by financial institutions in Australia has been trending down since late-2015. Private sector credit growth appeared to have stabilised in the September quarter of 2018 but the annual growth rate then continued to deteriorate through to the end of 2019. The early months of 2020 provided some positive signs but they disappeared in April 2020.

According to the latest RBA figures, private sector credit growth accelerated again In June, rising by 0.9%. The result was above the generally expected figure of 0.4% and nearly double May’s 0.5% increase after revisions. On an annual basis, the growth rate increased from 1.9% in May to 3.1%.

Commonwealth Government bond yields moved higher on the day following modest increases in US Treasury yield overnight. By the close of business, the 3-year ACGB yield had ticked up 1bp to 0.28% while 10-year and 20-year yields each finished 3bps higher at 1.18% and 1.81% respectively.

Owner-occupier loans and business loans equally accounted for much of the net growth over the month. Investor loans again grew quite modestly while total personal debt contracted.

Westpac senior economist Andrew Hanlan drew a parallel between the business sector’s reactions to lockdowns in June with those in March 2021. “The 2020 experience for business credit was that the jump in March was followed by a consolidation in April and then a reversal over the seven months to November, down by a cumulative 3.4%. There is the potential near-term for a partial reversal of the sizeable June 2021 increase.” However, he also sounded a cautiously hopeful note, saying “businesses may well have the confidence to resume borrowing to expand investment” once vaccination rates increase and the economy reopens.

US GDP misses despite “cashed up” US consumers spending big

29 July 2021

Summary:  US GDP up 1.6% (6.5% annualised) in June quarter, less than 2.0% expected; indicates lagged consumption boom; economy expansion at “extraordinary pace”; cashed-up consumer “spending big”,  downward surprise from inventories expected to reverse “over coming quarters”; GDP price deflator annual rate doubles from 2% to 4%.


US GDP growth slowed in the second quarter of 2019 before stabilising at about 0.5% per quarter.  At the same time, US bond yields suggested future growth rates would be below trend. The US Fed agreed and it reduced its federal funds range three times in the second half of 2019. Pandemic restrictions in the June quarter of 2020 sent parts of the US economy into hibernation; the lifting of those same restrictions sparked a rapid recovery.

The US Bureau of Economic Analysis has now released June quarter “advance” GDP estimates and they indicate the US economy expanded by 1.6% or at an annualised growth rate of 6.5%. The figure was less than the +2.0% (+8.3% annualised) which had been generally expected but slightly higher than the March quarter’s 1.5% expansion after revisions.

Westpac economist Lochlan Halloway said, “Overall, the report indicates a lagged consumption boom following two rounds of fiscal stimulus during Q1 as well as vaccine distributions.”

US GDP numbers are published in a manner which is different to most other countries; quarterly figures are compounded to give an annualised figure. In countries such as Australia and the UK, an annual figure is calculated by taking the latest number and comparing it with the figure from the same period in the previous year. The diagram above shows US GDP once it has been expressed in the normal manner, as well as the annualised figure.

US Treasury bond yields moved a little higher on the day. By the end of it, the 2-year Treasury bond yield had crept up 1bp to 0.21% while 10-year and 30-year yields each finished 2bps higher at 1.26% and 1.91% respectively.

In terms of US Fed policy, expectations of any change in the federal funds rate over the next 12 months remained largely stable. Federal funds futures contracts for July 2022 implied an effective federal funds rate of 0.12%, 2bps above the current spot rate.

Euro-zone GDP outlook firms, ESI index up again

29 July 2021

Summary: Euro-zone composite sentiment index up in July; slightly above expectations; readings from major euro-zone economies all up; sovereign bond yields a touch higher on day; index implies 5%+ GDP growth.


The European Commission’s Economic Sentiment Indicator (ESI) is a composite index comprising five differently-weighted sectoral confidence indicators.  It is heavily weighted towards confidence surveys from the business sector, with the consumer confidence sub-index only accounting for 20% of the ESI. However, it has a good relationship with euro-zone GDP, although not as a leading indicator.

The ESI posted a reading of 119.0 in July, slightly above the market’s expected figure of 118.2 and higher than June’s reading of 117.9. The average reading since 1985 has been just under 100.

Confidence improved across only two of the five sectors. The services and industry sub-indices both improved while the retail trade, construction and consumer sub-indices all deteriorated. On a geographical basis, the ESI increased in Germany, France, Italy and Spain.

German and French 10-year bond yields finished the day a touch higher. By the close of business, the German 10-year bond yield had crept up 1bp to -0.45% with the French 10-year yield finished unchanged at -0.10%.

End-of-quarter ESI readings and annual euro-zone GDP growth rates are highly correlated. This latest reading corresponds to a year-to-June growth rate of 5.1%, up from June’s comparable figure of 4.9%.


June CPI largely in line, no RBA move any time soon

28 July 2021

Summary: Annual Inflation rate hits 3.7% in June quarter, just above market expectations; RBA preferred measure rises to 1.6%, in line with expected figure; transport costs (fuel) main driver of result.


In the early 1990s, high rates of inflation in Australia were reined in by the “recession we had to have” as it became known. Since then, underlying consumer price inflation has averaged around 2.4%, a little below the midpoint of the RBA’s target range. Following the GFC, various measures of consumer inflation have been in a down-trend despite attempts by the RBA to increase them through historically low cash rates.

Consumer price indices for the June quarter have now been released by the ABS and the seasonally-adjusted inflation rate posted a 0.8% rise. The increase was just above the generally expected figure of 0.7% and higher than March’s comparable figure of 0.6%. On a 12-month basis, the seasonally-adjusted rate increased from 0.9% after revisions in March to 3.7%, with the 1.9% fall in the June 2020 quarter providing a significantly lower base for calculations.

The RBA’s preferred measure of underlying inflation, the “trimmed mean”, increased by 0.5% over the quarter, in line with market expectations and slightly higher than the March quarter’s 0.4%. The 12-month growth rate rose from 1.1% to 1.6%.

Commonwealth Government bond yields fell on the day, outpacing movements of their US Treasury counterparts overnight. By the close of business, the 3-year ACGB yield had lost 2bps to 0.28% while10-year and 20-year ACGB yield had each shed 6bps to 1.15% and 1.78% respectively.

In the cash futures market, expectations of a change in the actual cash rate, currently at 0.03%, remained largely unchanged. At the end of the day, contract prices implied the cash rate would inch up to around 0.21% by November 2022.

The main driver of the headline inflation figure in the quarter was a 2.8% rise in transport prices, contributing 0.3 percentage points of the 0.8% (unadjusted) increase over the quarter. The Food, Housing, Furnishings and Health segments all had roughly the same influence on the quarter; each contributed around 0.1% percentage points to the quarterly total, increasing 0.5%, 0.3%, 1.1%, 1.5% and 2.8% respectively.

Conference Board survey shows “no sign” rising infections dampening confidence

27 July 2021

Summary: Modest increase in Conference Board Consumer Confidence Index in July; reading well above expected figure; views of present conditions improve, short-term outlook virtually unchanged; Sep quarter growth “off to a strong start”; consumer spending “to support robust economic growth” in second half; “no sign” rising infections dampening confidence.


After the GFC in 2008/09, US consumer confidence clawed its way back to neutral over a number of years and then went from strength to strength until late 2018. Measures of consumer confidence then oscillated within a fairly narrow band at historically high levels until they plunged in early 2020. Subsequent readings then fluctuated around the long-term average until March this year.

The latest Conference Board survey held during the first three weeks of July indicated US consumer confidence has improved a little. July’s Consumer Confidence Index registered 129.1, well above the median consensus figure of 124.0 and slightly higher than June’s final figure of 128.9.

Consumers’ views of present conditions improved while their outlook of the near-future was virtually unchanged. The Present Situation Index rose from 159.6 to 160.3 while the Expectations Index slipped from 108.5 to 108.4.

“Consumers’ appraisal of present-day conditions held steady, suggesting economic growth in Q3 [the September quarter] is off to a strong start,” said Lynn Franco, a senior director at The Conference Board. She also noted “optimism about the short-term outlook didn’t waver” and consumers’ spending intentions had “picked up”.  She expects consumer spending “should continue to support robust economic growth in the second half of 2021.”

Longer-term US Treasury bond yields fell on the day. By the close of business, the 10-year Treasury bond yield had lost 6bps to 1.24% and 30-year had shed 4bps to 1.90%. The 2-year yield finished unchanged at 0.20%.

In terms of US Fed policy, expectations of any change in the federal funds rate over the next 12 months remained low. Federal funds futures contracts for July 2022 implied an effective federal funds rate of 0.13%, about 3bps above the current spot rate.

Ray Attrill, NAB’s Head of FX Strategy within its FICC division, said there was “no sign here of rising COVID infections yet dampening consumer spirits.”

German companies “significantly less optimistic”: ifo

26 July 2021

Summary: ifo business climate index down in July, below expected figure; expectations, current conditions indices both down; companies “significantly less optimistic”, supply bottlenecks, infection numbers weighing; business climate index “still close to early 2019 levels”; expectations index implies 2.6% growth in year-to-October.


Following a recession in 2009/2010, the ifo Institute’s business climate index largely ignored the European debt-crisis of 2010-2012, remaining at average-to-elevated levels through to early-2020. However, the index was quick to react in the March 2020 survey, falling precipitously. The rebound which began in May of that year was almost as sharp but it was also characterised by a period of below-average readings which lasted until early 2021.

According to the latest figures released by the Institute, its business climate index declined to 100.8 in July. The reading was below the expected reading of 102.0 and 0.9 points below June’s final reading of 101.7. The average reading since January 2005 is just above 97.

“Companies evaluated their current business situations as somewhat better, but their expectations for the coming months were significantly less optimistic,” said Clemens Fuest, the president of the ifo Institute. “Supply bottlenecks and concerns over newly rising infection numbers are weighing on the German economy.”

The expectations index decreased from June’s revised figure of 103.7 to 101.2, also below the generally-expected figure of 103.6. The current situation index fell from 99.7 to 100.4.

German and French long-term bond yields both increased modestly on the day. By the close of business, the German 10-year yield had inched up 1bp to -0.41% and the French 10-year yield had gained 2bps to -0.07%.

ANZ economist Hayden Dimes noted the various headwinds but described the latest reading of the business climate index as “still in a relatively good spot, close to early 2019 levels.”

“Strong economic growth” expected in US; leading index up in June

22 July 2021

Summary: US leading index up 0.7% in June, below expectations; “strong economic growth will continue in near term”; Conference Board 2021 forecast unchanged at 6.6%.


The Conference Board Leading Economic Index (LEI) is a composite index composed of ten sub-indices which are thought to be sensitive to changes in the US economy. The Conference Board describes it as an index which attempts to signal growth peaks and troughs; turning points in the index have historically occurred prior to changes in aggregate economic activity. Readings from March and April of 2020 signalled “a deep US recession” while subsequent readings indicated the US economy had recovered rapidly.

The latest reading of the LEI indicates it rose by 0.7% in June. The result was below the 0.9% increase which had been generally expected and lower than May’s revised figure of 1.2%. On an annual basis, the LEI growth rate slowed from 14.8% after revisions to 12.1%.

Ataman Ozyildirim, Senior Director of Economic Research at The Conference Board, described the increase as “broad-based” across the ten components of the index despite declines in two of them. He expects “strong economic growth will continue in the near term.”

Changes over time can be large but once they are standardised, a clearer relationship with GDP emerges. The latest reading implies a 5.8% year-on-year growth rate in September, down from August’s 6.8%. The Conference Board forecasts a 6.6% expansion across all of calendar 2021, unchanged from their forecast of a month ago.

Zero in the chart above represents the average US GDP growth rate from September 2002, or about 1.8% year on year.

US Treasury bond yields ended the day modestly lower. At the close of business, the 2-year Treasury yield remained unchanged at 0.21%, the 10-year yield had slipped 1bp to 1.28% while the 30-year yield finished 2bps lower at 1.92%.

Click for more news